INTRODUCTION
Calcareous grasslands of the Festuco-Brom-etea extend from southern Scandinavia to north-ern Spain, with their main distribution in the Atlantic, central-European and sub-Mediter-ranean regions (ROYER1991). Calcareous grass-lands are among the most species-rich habitats in Western Europe, both at local and regional scales (WILLEMS 2001, POSCHLOD & WALLISDEVRIES
2002). Belgium coincides with the northwestern
boundary of the distribution of many grassland plant species, especially thermophilous ones such as Teucrium montanum and Aster linosyris, and of plant communities such as Xerobromion grass-lands (WOLKINGER& PLANK1981, ROYER1991). Belgian calcareous grasslands are located at the border between the Atlantic and the Central Euro-pean floristic regions (BUTAYEet al. 2005).
Since World War II, the extent of calcareous grasslands has dramatically decreased in Western Europe (DZWONKO& LOSTER1998). Many surveys
PLANT COMMUNITIES AND SPECIES RICHNESS OF THE
CALCAREOUS GRASSLANDS IN SOUTHEAST BELGIUM
© 2007 Royal Botanical Society of BelgiumJulien PIQUERAY1,*, Emmanuelle BISTEAU1, Gaëtan BOTTINand Grégory MAHY
Laboratory of Ecology, Gembloux Agricultural University, 2, Passage des Déportés, B - 5030 Gembloux, Belgium 1 Equally contributing authors
(* Author for correspondence; e-mail: piqueray.j@fsagx.ac.be)
Received 12 September 2006; accepted 7 December 2006.
ABSTRACT. — Calcareous grasslands are biodiversity hotspots in Western Europe. In
Bel-gium, a number of phytosociological surveys have been realized in these habitats, but none covers the whole range of calcareous grasslands at the regional scale. The aim of this study was (i) to provide a synthesis of the floristic variation of calcareous grasslands of the Calestienne natural region using a uniform methodology; (ii) to relate floristic variation to environmental variables, and (iii) to characterize the specific diversity of the different grassland communities that occur in the study region. Seven different communities were identified with the TWINSPAN method. The originality of the grasslands on calcareous and calcareo-siliceous rocks was statistically confirmed. Significant differences for environmental variables were identified among the seven communities by a MANOVA. Main differences between communi-ties were related to xericity and pH, although a north-south gradient was also identified. More xeric grasslands were located in the southern part of the study region while northern part was occupied by more mesophilous grasslands. Multiple regressions were used to describe the influence of the environmental conditions on plant species richness. The most mesophilous grasslands appeared to be the most species-rich while soil acidity negatively affected species richness.
KEY WORDS. — Belgium, calcareous grasslands, environmental variables, MANOVA,
have been made during the last decades in order to determine the most suitable management and restoration measures (e.g., BOBBINK et al. 1987, DELESCAILLEet al. 1995, KÖHLERet al. 2005). In Belgium, ca. 100 hectares of calcareous grass-lands have been restored since 1990. Many are still occupied by clear cuttings managed with the aim to restore typical grassland communities. The remaining grasslands are frequently dominated by Brachypodium pinnatum or Bromus erectus as a result of the absence of grazing or mowing. The total currently managed area is ca. 300 hectares (ANDRÉ & VANDENDORPEL 2004, GRAUX 2004). However, managing and restoring plant commu-nities at a regional scale both require a good knowledge of the floristic composition and diver-sity variation in order to adapt management objectives to the local situation.
Despite numerous local descriptive studies of calcareous grasslands in Belgium (e.g., DUVI
-GNEAUD 1982, NOIRFALISE & DETHIOUX 1982, DUVIGNEAUD 1989), no large-scale general phy-tosociological synthesis, based on a large number of relevés and consistent statistical analyses, has been realized yet. VANSPEYBROUCKet al. (1989) performed a classification of calcareous grass-lands in Belgium, only using a limited number of relevés and focusing on the Xerobrometum types in its northern locations. Recently, BUTAYEet al. (2005) proposed a detailed study of the floristic variation of calcareous grasslands in Belgium, based on a large number of relevés. The geo-graphic scale of this study, however, was limited to the Viroin valley (western part of the Calesti-enne natural region).
This paper presents a regional scale study of the floristic variation and diversity of calcareous grasslands across the Calestienne region, with the exception of the Viroin valley already studied by BUTAYE et al. (2005). It differs from previous studies because: (i) we covered the whole geolog-ical range of calcareous grasslands; (ii) the large scale considered allowed to take into account bio-geographical variability; (iii) we based our analy-sis on a large number of relevés with an undi-rected relevé selection.
Our aims were (i) to provide a synthesis of the floristic variation of calcareous grasslands of the
Calestienne using a uniform methodology in order to classify grasslands into different communities; (ii) to relate this synthesis to environmental vari-ables and (iii) to characterize the species diversity of the different grassland communities identified.
METHODS
STUDY REGION
The studied grasslands were mainly located in the Calestienne region (Belgium), which is characterized by Devonian geological formations consisting of lime-stone or calcareo-siliceous rocks, the latter supporting soils with higher acidity. The study region also included locally occurring Cretaceous chalk formations near Visé (50°45’N – 5°40’E), and one small Carbonif-erous calcareous area near Theux (50°32’N – 5°49’E). These two localities were included because of the expected specific floristic composition of their grass-lands. The study region is characterized by a hilly land-scape, with isolated calcareous grasslands in a matrix of forest and arable land.
DATA COLLECTION
All existing calcareous grassland patches were first localized through literature and recent ortho-recti-fied vertical aerial photographs. In the region near Rochefort, grassland locations were obtained from a previous survey (BOTTINet al. 2005). A representative subset of patches was selected by stratified sampling, using geographical sub-regions as strata. This subset was representative of the different geological forma-tions present and of the different patch sizes. Within the selected patches, transects were established on a slope gradient. Along these transects, one-meter square plots were located every 20 meters, with a minimum of three plots and a maximum of ten plots per patch. When patch configuration (shape or size) did not allow to establish a transect, plots were randomly located. Plots falling in non-grassland vegetation were moved to the grassland zone nearest from their initial location. A total of 477 plots were established (see Appendix 1). During the 2004 vegetation period, the cover of all higher plant species in the one-meter square plots was recorded using the BRAUN-BLANQUET(1932) scale. A total of 245 plant species were found. Nomenclature fol-lowed LAMBINONet al. (2004). Species were classified following their preference for phytosociological alliances (see BISTEAU& MAHY2005 for details).
Envi-ronmental variables were derived directly from field observations for each plot. They included (i) biogeo-graphical variables: Belgian Lambert coordinates and altitude; (ii) topographic and soil variables: slope (degrees), mean soil depth (three measurements) and mean soil pH estimated with a Hellige pH-indicator (two measurements); (iii) community structure vari-ables: maximum height of vegetation, bare soil percent-age, moss cover, herbaceous vascular species cover and shrub cover (%). Because nutrient status is an important factor explaining grassland floristic composition (AL -MUFTIet al. 1977, CRITCHLEYet al. 2002), we derived it indirectly from ELLENBERGet al. (1992) as the mean indicator value for soil nitrogen richness (mN), com-puted over all inventoried species in the plot. Soil mois-ture status was derived in the same way, using the mean Ellenberg value for humidity (mF).
DATA ANALYSES
Prior to the analyses, Braun-Blanquet coefficients were transformed into ordinal coefficients, using the van
der Maarel scale (JONGMANet al. 1995). To fulfil our first objective, vegetation data were analyzed using TWINSPAN (HILL& SMILAUER2005). This method was chosen to make our results comparable with those obtained by BUTAYEet al. (2005) in the Viroin valley. Pseudospecies were defined using van der Maarel coeffi-cients 3 and 5 as cut-off levels (corresponding to 5% and 25% cover, respectively). A synoptic table was created depicting the constancy of the different species in the groups resulting from the classification. These groups were compared with the communities described in the EUNIS typology (EUROPEAN ENVIRONMENT AGENCY
2005) based on their indicator species. The distribution of the different communities derived from TWINSPAN was analyzed on the basis of the frequency of plots belonging to each community in 10 × 10 km squares. In relation to our second objective, a Canonical Correspondence Analysis (CCA) was run with
CANOCO4.5 and CANODRAWfor WINDOWS(TERBRAAK
& SMILAUER 2002). Environmental variables were selected, using 999 Monte Carlo permutations, at a significance level of 0.05. Their values were
standard-Fig. 1. TWINSPAN classification dendrogram of the calcareous grassland communities of the Calestienne region with their indicator species.
I II III IV V VI VII Number of relevés 54 155 153 70 28 10 7 Festuco-Brometea Potentilla neumanniana 57 50 46 67 79 40 -Thymus pulegioides 41 42 26 20 7 20 14 Hieracium pilosella 39 22 31 13 32 - 14 Sanguisorba minor 28 88 82 40 68 10 14 Bromus erectus 31 72 57 27 46 - -Helianthemum nummularium 24 39 50 67 64 60 14 Festuca gr. ovina 67 44 54 27 4 - 14 Campanula rotundifolia 13 12 36 3 14 - -Scabiosa columbaria 2 17 31 6 32 - -Koeleria macrantha 24 33 17 11 4 - -Teucrium chamaedrys 6 6 41 91 21 - -Brachypodium pinnatum 4 54 76 39 11 - -Euphorbia cyparissias 15 6 47 26 - - -Hippocrepis comosa 2 1 20 69 50 - -I II III IV V VI VII Number of relevés 54 155 153 70 28 10 7 Mesobromion Pimpinella saxifraga 17 60 47 4 7 - -Carex flacca 6 44 59 13 - - -Leontodon hispidus 2 26 27 1 - - -Carex caryophyllea 11 38 8 1 4 - -Carlina vulgaris 2 6 10 - 4 - -Anthyllis vulneraria 2 10 8 4 - - -Ranunculus bulbosus 17 50 15 - - - -Centaurea scabiosa 6 23 10 1 4 - -Genista tinctoria 7 28 15 - - - -Linum catharticum 2 35 41 - - - -Medicago lupulina 7 23 22 - - - -Ononis repens 2 19 6 - - - -Primula veris 2 11 10 - - - -Prunella laciniata 2 3 5 - - - -Genistella sagittalis 4 3 3 - - - -Polygala comosa - 2 17 1 - - -Polygala vulgaris - 18 7 9 - - -Epipactis atrorubens - 1 7 1 - - -Gymnadenia conopsea - 1 7 - - - -Picris hieracioides - 2 8 - - - -Plantago media - 23 12 - - - -Galium pumilum - 15 29 1 - - -Cirsium acaule - 15 18 - - - -Ononis spinosa - 2 1 - - - -Trifolium montanum - 4 3 - - - -Platanthera bifolia - 3 - - - - -Platanthera chlorantha - 2 2 - - - -Euphrasia nemorosa - 1 1 - - - -Carex tomentosa - - 3 - - - -Bunium bulbocastanum - 1 2 - - - -Gentianella germanica - - 3 - - - -Gentiana cruciata - 1 - - - - -Ophrys insectifera - - 4 - - - -Calamagrostis epigejos - 1 - - - - -Genista pilosa - 1 - - - - -Anacamptis pyramidalis - 1 - - - - -Gentianella ciliata - - 2 - - - -Onobrychis viciifolia - 1 - - - - -Ophrys apifera - 3 1 - - - -Orchis militaris - 1 1 - - - -I II III IV V VI VII Number of relevés 54 155 153 70 28 10 7 Xerobromion Melica ciliata - - - 29 46 50 14 Aster linosyris - 3 1 30 4 20 14 Cotoneaster integerrimus - - - 3 7 10 -Sesleria caerulea 2 1 18 50 54 - -Allium sphaerocephalon - 1 1 40 4 - -Arabis hirsuta - 1 1 13 7 - -Dianthus carthusianorum 4 - - 9 4 - -Allium oleraceum - 2 3 10 11 - -Carex humilis - - 2 63 - - -Stachys recta - - - 17 - - -Thlaspi montanum 2 1 3 14 - - -Globularia bisnagarica - - 5 11 - - -Pulsatilla vulgaris - - - 7 - - -Veronica prostrata - - - 3 - - -I II III IV V VI VII Number of relevés 54 155 153 70 28 10 7 Molinio-Arrhenatheretea Hypericum perforatum 24 19 33 9 4 20 43 Leucanthemum vulgare 11 39 15 - - 40 14 Lotus corniculatus 26 74 70 7 11 - -Taraxacum officinale 4 8 33 4 7 - -Centaurea jacea 37 45 19 6 4 30 29 Stachys officinalis 4 3 2 14 - - -Achillea millefolium 24 47 8 - - - -Dactylis glomerata 19 28 10 3 - - -Succisa pratensis - 16 2 - - - -Tragopogon pratensis - 3 4 1 - - -Trifolium medium 2 8 7 - - - -Trifolium pratense 2 13 2 - - - -Trifolium repens 9 5 3 - - - -Trisetum flavescens 6 23 10 - - - -Knautia arvensis 2 32 22 3 - - -Vicia cracca - 5 1 - - - -Vicia hirsuta 9 13 11 - - 10 -Vicia sativa 6 6 1 1 - - -Plantago lanceolata 37 61 22 - - - 14 Daucus carota 2 32 12 - - - -Anthoxanthum odoratum 2 8 - - - - -Arrhenatherum elatius 15 15 6 - - 10 -Potentilla reptans 11 8 5 - - - -Prunella vulgaris 2 3 7 - - - -Geranium molle 4 - - 1 - - -Senecio jacobaea 4 3 8 - - - -Avenula pubescens 2 18 5 - - - -Briza media 4 52 22 - - - -Crepis biennis 2 3 - - - - -Dactylorhiza fuchsii - 3 1 - - - -Heracleum sphondylium - 3 - - - -
-Table 1. Synoptic table of the grassland communities (I–VII) identified on the basis of the TWINSPAN classifica-tion. Species frequency of occurrence in the different communities (% of relevés with presence of the species).
Holcus lanatus - 4 2 - - - -Lathyrus pratensis - 5 1 - - - -Leontodon autumnalis - 4 - - - - -Molinia caerulea - 1 - - - - -Parnassia palustris - 1 - - - - -Potentilla erecta - 6 - - - - -Rhinanthus alectorolophus - 5 - - - - -Selinum carvifolia - 1 - - - - -Carex panicea - 4 - - - - -Cerastium fontanum - 5 - - - - -Colchicum autumnale - 1 - - - - -Carex tomentosa - - 3 - - - -Silaum silaus - - 1 - - - -I II III IV V VI VII Number of relevés 54 155 153 70 28 10 7 Nardo-Callunetea Danthonia decumbens 9 13 3 1 - - -Luzula campestris 6 8 3 - - - -Veronica officinalis 2 1 2 - - - -Calluna vulgaris 2 1 - - - - -Agrostis capillaris 50 9 4 - - - -Cuscuta epithymum 2 - - 3 - - -Hieracium maculatum 2 - 1 - - - -Deschampsia flexuosa 6 - - - -Rumex acetosella 22 - - - -Teucrium scorodonia 4 1 1 3 - 20 29 Cytisus scoparius 7 2 3 3 - 10 71 Festuca heteropachys - - - 100 86 Hieracium sabaudum - - - 14 Hieracium lachenalii - 2 3 - - - -Melampyrum pratense - - - - 4 - -Genista pilosa - 1 - - - - -Viola canina - 1 - - - - -I II III IV V VI VII Number of relevés 54 155 153 70 28 10 7 Sedo-Scleranthetea Scleranthus annuus 7 - - - -Trifolium arvense 22 1 - 1 - - -Cerastium pumilum 6 2 - - - - -Dianthus armeria 7 - - - -Trifolium campestre 2 - - - -Erophila verna 6 3 - - - - -Trifolium dubium 19 5 - - - - -Veronica arvensis 9 - - 3 - - -Echium vulgare 13 1 5 3 11 50 14 Sedum acre 2 - - 1 7 - -Lepidium campestre 4 1 - - 4 10 -Sedum album 13 - - 29 86 90 43 Sedum rupestre 52 1 1 7 - - 14 Acinos arvensis 2 - 4 16 39 - -Arabidopsis thaliana - - - 40 -Arenaria serpyllifolia 4 7 5 20 50 40 -Lactuca perennis - - - 1 - - -Lepidium campestre 4 1 - - 4 10 -Poa compressa 9 3 12 4 21 20 -Teucrium botrys - - 1 - 7 - -Sedum telephium - - - 60 -Sempervivum funckii - - - 30 -var. aqualiense Thlaspi perfoliatum - - - 1 - - -I II III IV V VI VII Number of relevés 54 155 153 70 28 10 7 Festucion pallentis Festuca pallens - - - - 50 - -Dianthus gratianopolitanus - - - - 7 - -Asplenium ruta-muraria - - 1 3 54 - 14 Cotoneaster integerrimus - - - 3 7 10 -Sesleria caerulea 2 1 18 50 54 - -I II III IV V VI VII Number of relevés 54 155 153 70 28 10 7 Trifolion medii Galium mollugo 13 1 8 44 14 30 -Origanum vulgare - 32 27 34 25 60 -Agrimonia eupatoria 2 21 4 - - - -Astragalus glycyphyllos - 1 1 - - - -Brachypodium sylvaticum - 5 4 - - - -Calamintha clinopodium - - 7 - - - -Centaurium erythraea 6 5 5 - - - -Festuca rubra 6 20 1 - - - -Galium verum 20 35 24 6 4 - -Inula salicina - - 1 - - - -Poa pratensis 17 27 18 1 - - -Senecio erucifolius - 1 1 - - - -Solidago virgaurea - 1 4 - - - -Trifolium medium 2 8 7 - - - -Viola hirta 2 25 52 19 - - -I II III IV V VI VII Number of relevés 54 155 153 70 28 10 7 Geranion sanguinei Anthericum liliago - - 3 29 11 10 14 Seseli libanotis - - - 27 43 - -Vincetoxicum hirundinaria - - 3 27 14 - -Rosa pimpinellifolia - - - 13 4 - -Polygonatum odoratum - - - 20 - - -Geranium sanguineum - - - 7 - - -Silene nutans 6 - - - 4 40 86 Campanula persicifolia - - - 10 -Inula conyzae - 3 6 7 - - -Bupleurum falcatum - 1 11 14 - - -Aquilegia vulgaris - - 1 1 - - -Digitalis lutea - - - -Fragaria viridis 2 5 3 - - - -Lithospermum officinale - - 1 - - - -Silene vulgaris - 1 - - - - -I II III IV V VI VII Number of relevés 54 155 153 70 28 10 7 Koelerio-Phleion phleoidis Festuca heteropachys - - - 100 86 Aster linosyris - 3 1 30 4 20 14 Artemisia campestris - - - 30 -Campanula patula - - - 10
-ized to give the same weight to each one of them. We tested whether environmental variables differed sig-nificantly between the vegetation types derived from TWINSPAN, through a multivariate analysis of vari-ance (MANOVA) and subsequent ANOVAs, using the
SAS CANDISCprocedure (SAS INSTITUTEINC. 1999).
The considered variables were soil depth, soil pH, slope, height of vegetation, bare soil percentage, shrub cover, herbaceous cover and moss cover. The four lat-ter variables (proportions) were arcsine transformed.
The third objective was first approached through Kruskal-Wallis comparisons of mean species richness per plot among grassland communities (derived from TWINSPAN). Second, the influence of the patch envi-ronmental conditions and geographical location on the species richness (one-meter square scale) was examined using best subset multiple regressions. The analysis was carried out both on the whole data set and on the differ-ent grassland communities iddiffer-entified. The models were built with the subset of predictor variables for which all p-values were significant at the 0.05 minimum level. When necessary, the dependent variables were trans-formed in order to meet normality and homoscedasticity requirements. Normality of the residuals was tested by Levene’s test and their homoscedasticity by Breuch-Pagan’s test. Box-Cox transformations on the dependent variable were applied using a MINITAB macro (PALM
2002) in order to improve the results of those tests.
RESULTS GENERAL CLASSIFICATION
Calcareous grasslands in the study area belong to the Festuco-Brometea class, character-ized by, among others, Festuca lemanii, Bromus erectus, Helianthemum nummularium, and San-guisorba minor (Table 1). The TWINSPAN classi-fication of relevés revealed seven different groups (Fig. 1, Table 1, Table 2). The number of relevés in each group varied considerably (from 7 to 155 relevés, Table 2). Two groups were represented by a very low number of relevés (groups VI and VII), mainly limited to two sites: “Heid des Gattes” (eight relevés out of ten for group VI) and “Heid de Stinval” (five relevés out of seven for group VII). Indicator species of groups I to III were Lotus corniculatus, Pimpinella saxifraga, and Plantago lanceolata (Fig. 1). These species are typically mesophilous, so these groups were
clas-sified as mesophilous grasslands. Besides the high occurrence of Mesobromion species, mesophilous grasslands were characterized by an important proportion of species from the Molinio-Arrhenatheretea and the Trifolion medii (Table 1). Two mesophilous communities were then identi-fied: the acidic mesophilous grasslands (group I) and the alkaline mesophilous grasslands (groups II and III). On the other hand, indicator species of groups IV to VII were Sedum album, Hippocrepis comosa, Teucrium chamaedrys and Carex humilis (Fig. 1), which are typically xerophilous species. In addition to the presence of Xerobromion species, these grasslands were characterized by Sedo-Scleranthetea and Geranion sanguinei species (Table 1). The xerophilous communities were classified into three different plant commu-nities : the very dry grasslands (group IV), the Festucion pallentis grasslands (group V) and the Koelerio-Phleion grasslands (groups VI and VII).
The MANOVA showed significant differ-ences between groups for environmental variables (Wilks’ Lambda, F = 17.55, NUM df = 60, DEN df = 2415, P < 0.0001). Also ANOVAs on separate environmental variables were significant (excepted for shrub cover). Subsequent pairwise comparisons are detailed in Table 2. Because of their very low number of relevés, groups VI and VII were removed from these analyses, and comparisons were made on a qualitative basis. A strong differ-ence was observed between groups II and III on the one hand and groups IV and V on the other hand. Relevés from groups II and III were characterized by significantly deeper soils, less steep slopes, lower bare soil percentage and higher herbaceous cover, compared to relevés from groups IV and V (Table 2). This typically contrasts mesophilous grasslands (groups II and III) against more xerophilous grasslands (groups IV and V). Accord-ing to the analysis of the nutrient level (mN), mesophilous grasslands were characterized by a more nitrophilous flora than xerophilous ones. The position of group I was rather difficult to interpret on the basis of environmental variables alone. ACIDIC MESOPHILOUS GRASSLANDS(GROUPI)
This group is characterized by Sedum rupestre and Agrostis capillaris (Fig. 1) and
contains an important proportion of species from the Mesobromion and few species from the Xero-bromion (Table 1). It is characterized by the important occurrence of species from the Nardo-Callunetea and the Sedo-Scleranthetea (Table 1) and species richness (ca. 13 species/m2) was lower
than other mesophilous grasslands (Table 2). Although it was grouped among typical mesophilous grasslands at the first level of the TWINSPAN division (Fig. 1), acidic mesophilous grasslands differed significantly from groups II and III in terms of environmental conditions (maximum vegetation height, bare soil percent-age and herbaceous cover). They also differed significantly from xerophilous communities (groups IV and V) for slope and were intermedi-ate for soil depth. Their main characteristic was a significantly lower pH. These communities may be found across the entire Calestienne region except in the more northeastern sites (Fig. 2). Their presence corresponds more to local varia-tions of ecological condivaria-tions (embankments on shale with more or less decarbonated soils) than to a biogeographical gradient.
ALKALINE MESOPHILOUS GRASSLANDS (GROUPS II ANDIII)
The two alkaline mesophilous communities (groups II and III) correspond to different levels of xericity. Group II represents the typical mesophilous grassland community, characterized by Plantago lanceolata, Achillea millefolium, Ranunculus bulbosus and Carex caryophyllea (Fig. 1). It also includes many species of the Molinio-Arrhenatheretea (Table 1). Group III corresponds to a mesophilous community typical of more xeric environments and is indicated by Euphorbia cyparissias and Teucrium chamaedrys (Fig. 1). This community is a transition between the Mesobromion and Xerobromion, as xeric species such as Carex humilis, Globularia bisna-garica and Sesleria caerulea appear and meadow species become scarce (Table 1). Generally, mesophilous grasslands (groups II and III) are well represented in the study region (308 out of 477 relevés) and are characterized by the high abundance of Bromus erectus and Brachypodium pinnatum. Many typical species of the Meso-Table 2. Comparisons of mean environmental variables between grassland communities identified on the basis of the TWINSPAN classification. Pairwise comparisons; using Kruskall-Wallis test: different letters indicate significant differences for a = 0.05.
Group I II III IV V VI VII
n 54 155 153 70 28 10 7 Altitude 195a 189a 223b 217b 172a 158n.t. 206n.t. Y 104283b 121816c 95125a 95328b 121174c 131977n.t. 132272n.t. Soil depth 4.14ab 8.90c 4.67b 2.78a 2.26a 2.90n.t. 3.57n.t. pH 4.99a 6.27b 6.75c 6.61bc 6.47bc 4.88n.t. 4.68n.t. Slope 14.9a 13.5a 10.7a 22.8b 33.3b 64.5n.t. 30.0n.t. MHV 59.9a 81.2c 70.9b 62.4ab 65.9ab 55.9n.t. 55.9n.t. % Bare soil 16.0b 8.2a 8.7a 15.3b 41.3c 46.0n.t. 45.0n.t. % Herbaceous 72.0b 88.3c 84.4c 76.4b 47.1a 52.5n.t. 40.0n.t. % Shrubs 1.96 1.96 2.08 0.69 1.25 2.30n.t. 2.07n.t. % Mosses 29.3c 12.9a 20.8bc 18.8ab 20.8bc 7.6n.t. 20.7n.t. Species richness 13.2a 20.7b 18.9b 13.1a 11.2a 13.7n.t. 6.9n.t. mF 3.58c 3.92d 3.77c 3.09b 2.98a 3.28n.t. 3.12n.t. mN 2.89b 3.19c 3.08b 2.39a 2.13a 2.86n.t. 2.40n.t. Notes. n = number of relevés; Y = Y Lambert coordinate; MHV = Maximum Height of Vegetation; % Bare soil = percentage of the relevé covered by bare soil; % Herbaceous = percentage of the relevé covered by herbaceous species; % Shrubs = percentage of the relevé covered by shrub species; % Mosses = percentage of the relevé covered by mosses; mF = pean Ellenberg indicator value for soil moisture; mN = pean Ellenberg indicator values for nutrient status.
bromion alliance (WOLKINGER & PLANK 1981) were present in the corresponding relevés, such as Cirsium acaule, Gentianella germanica and many orchids (Ophrys insectifera, Ophrys apifera, Orchis militaris, Anacamptis pyrami-dalis). Our relevés revealed a species-rich habitat, with a mean species richness of 20 species/m2and
a maximum of 35 species/m2. These grasslands
develop on gentle slopes or on plateaus with rela-tively deep soils. They exhibit a high vegetation and little bare soil. Contrary to the previous com-munity, the soil pH was high, varying between 6 and 7 (Table 2). The geographic distribution of these communities over the study zone indicates a tendency towards dominance of the meso-xerophilous community in the southwestern part, which is replaced by the more mesophilous com-munity in the northeastern part (Fig. 2).
VERY DRY GRASSLANDS(GROUPIV)
This community is characterized by Teu-crium chamaedrys and Carex humilis (Fig.1). Many Xerobromion species were found, such as Allium sphaerocephalon, Thlaspi montanum or Stachys recta. This community also contains numerous species of the Sedo-Scleranthetea, as Acinos arvensis or Sedum album, owing to a low vegetation cover (76% on average). Its mean species richness was lower than that of the Meso-bromion, with only 13 species/m2. It occurred on
steep slopes with a very thin alkaline soil (pH ≈ 7). Bare soil percentage was rather important, while maximum height of vegetation was low (Table 2). It was mainly located in the southern part of the study region, in the Lesse and Lomme valleys (Fig. 2).
Fig. 2. Study region and proportion of relevés from the different TWINSPAN groups in 10 ×10 km squares. Circle
Axis 1 Axis 2 III I II V IV VI VII 1.2 1.8 - 1.2 - 0.6 mF mN Soil dep th % Herbaceous % Shrubs X Y pH Altitude Slope % Mosses
Fig. 3. Position in the CCA ordination graph of communities identified by TWINSPAN. Horizontal and vertical bars represent standard deviation of the positions along the first and second axes of the ordination. Arrows represent environmental variables. X = X Lambert coordinate; Y = Y Lambert coordinate; % Herbaceous = percentage of the relevé covered by herbaceous species; % Shrubs = percentage of the relevé covered by shrub species; % Mosses = percentage of the relevé covered by mosses; mF = mean Ellenberg indicator value for soil moisture; mN = mean Ellenberg indicator values for nutrient status.
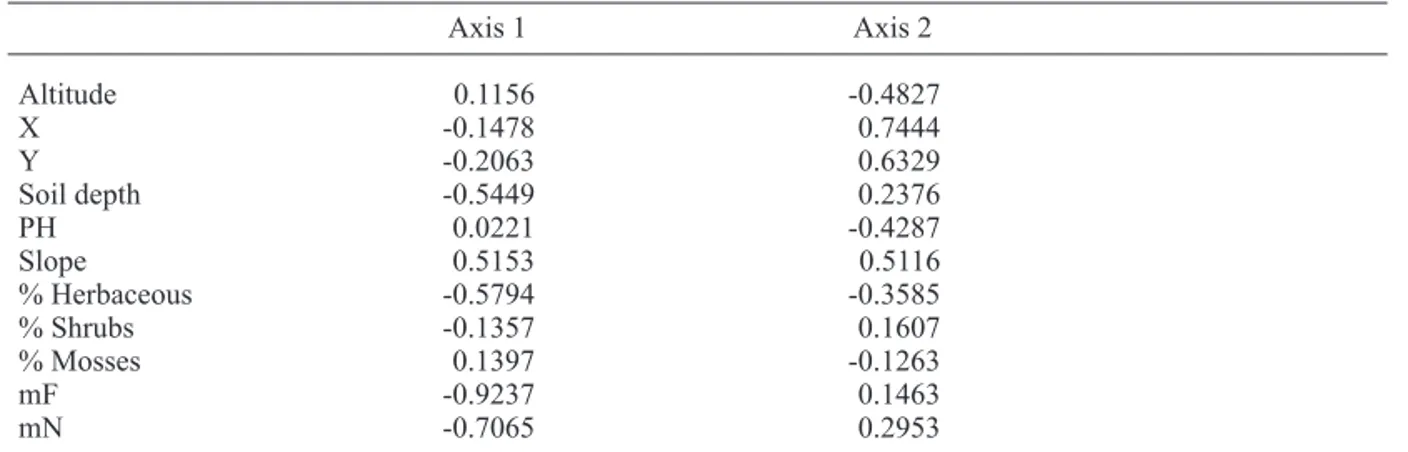
Table 3. Correlation between environmental variables and ordination axes from the CCA.
Axis 1 Axis 2 Altitude 0.1156 -0.4827 X -0.1478 0.7444 Y -0.2063 0.6329 Soil depth -0.5449 0.2376 PH 0.0221 -0.4287 Slope 0.5153 0.5116 % Herbaceous -0.5794 -0.3585 % Shrubs -0.1357 0.1607 % Mosses 0.1397 -0.1263 mF -0.9237 0.1463 mN -0.7065 0.2953
Notes. X = X Lambert coordinate; Y = Y Lambert coordinate; % Herbaceous = percentage of the relevé covered by herbaceous species; % Shrubs = percentage of the relevé covered by shrub species; % Mosses = percentage of the relevé covered by mosses; mF = mean Ellenberg indicator value for soil moisture; mN = mean Ellenberg indicator values for nutrient status.
FESTUCION PALLENTIS GRASSLANDS(GROUPV) This relatively species-poor community (11.2 species/m2 on average) is characterized by Festuca pallens, Sesleria caerulea, Cotoneaster integerrimus, and by the very rare Dianthus gra-tianopolitanus. These grasslands occupied cal-careous rock cliffs and cracks on very steep slopes. The Festucion pallentis community is very rare in Belgium and has mainly been found in the Ourthe valley (Fig.2).
KOELERIO-PHLEION GRASSLANDS(GROUPSVI AND
VII)
Both groups are positively differentiated from the others by the indicator species Festuca heteropachys (Fig. 1) and by a higher occurrence of indicator species from the Koelerio-Phleion alliance (Table 1). Their species richness was poor to very poor (Table 2).
Mean environmental conditions for these two groups (Table 2) were characteristic of
xerophilous communities with superficial soils on steep slopes, supporting open vegetation. These communities, however, differed from the other observed xerophilous communities (groups IV and V) by more acidic conditions (pH ≈ 4.5). They correspond best to the Koelerio-Phleion phleoidis alliance. This community is extremely rare in Belgium and mainly occurred in the Amblève valley (Fig. 2).
ORDINATION OF RELEVÉS AND ENVIRONMENTAL DATA
The two first axes explained respectively 27.1% and 15.5% of the species-environment relation. The ordination analysis confirmed the interpretation based on the TWINSPAN classifi-cation (Fig. 3). The first axis was highly corre-lated to herbaceous species cover, soil depth, soil moisture (mF), soil trophic level (mN), slope and bare soil percentage (Table 3). The gradient from negative to positive values on axis 1 corresponded to more superficial soils with lower water content and lower nutrient status,
Table 4. Between-class correlations of environmental variables. Values in italics refer to the associated probabilities. Soil pH Slope MHV % Bare % Herb % Shrubs % Mosses mF
Depth Soil pH 0.001 0.998 Slope -0.460 -0.302 0.299 0.511 MHV 0.913 0.382 -0.519 0.004 0.397 0.232 % Bare Soil -0.492 -0.452 0.914 -0.569 0.262 0.309 0.004 0.183 % Herb 0.682 0.449 -0.819 0.741 -0.957 0.092 0.312 0.024 0.057 0.001 % Shrubs 0.655 -0.058 -0.212 0.594 -0.269 0.394 0.110 0.901 0.648 0.159 0.560 0.382 % Mosses -0.654 -0.398 -0.028 -0.709 0.254 -0.501 -0.485 0.111 0.376 0.953 0.075 0.583 0.253 0.270 mF 0.819 0.065 -0.726 0.777 -0.734 0.799 0.773 -0.362 0.024 0.889 0.065 0.040 0.060 0.031 0.042 0.425 mN 0.767 0.028 -0.676 0.701 -0.729 0.790 0.801 -0.369 0.986 0.044 0.952 0.095 0.080 0.063 0.035 0.030 0.415 <.0001
Notes. MHV = Maximum Height of Vegetation; % Bare soil = Percentage of the relevé covered by bare soil; % Herb = percentage of the relevé covered by herbaceous species; % Shrubs = percentage of the relevé covered by shrub species; % Mosses = percentage of the relevé covered by mosses; mF = pean Ellenberg indicator value for soil moisture; mN = pean Ellenberg indicator values for nutrient status.
All grasslands 4thR T Y -** +*** +*** +* -* +*** -*** 18.1%
Mesophilous acidic grasslands (Group I)
SQR T Y -* +*** 38.4%
Mesophilous grasslands (Groups II, III)
4thR T Y -*** -*** +** -*** +*** -** 39.8%
Xerophilous grasslands (Group IV)
LOG 10 Y -*** +*** -*** 58.5%
Calcareous rocks grasslands (Group
V) Y 2 +** +* 33.1%
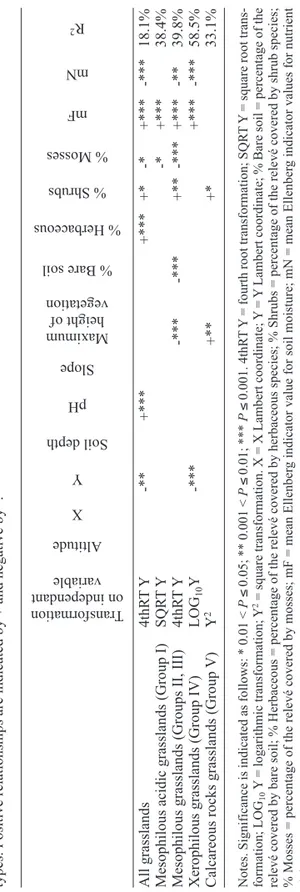
Notes. Significance is indicated as follows: * 0.01 <
P ≤ 0.05; ** 0.001 < P ≤ 0.01; *** P ≤ 0.001. 4thR T Y
= fourth root transformation; SQR
T
Y
= square root
trans-formation; LOG
10
Y
= logarithmic transformation;
Y
2= square transformation. X = X Lambert coordinate;
Y
=
Y
Lambert coordinate; % Bare soil = percentage of the
relevé covered by bare soil; % Herbaceous = percentage of the relevé covered by herbaceous species; % Shrubs = percentage of th
e relevé covered by shrub species;
% Mosses = percentage of the relevé covered by mosses; mF = mean Ellenber
g indicator value for soil moisture; mN = mean Ellenbe
rg indicator values for nutrient
status. Transformation on independant variable T able 5.
Optimal multivariate models for the local species richness, considering the whole grassland set and the dif
ferent
TWINSP
AN gras
sland
types. Positive relationships are indicated by + and negative by -.
Altitude X Soil depth pH Slope % Bare soil % Herbaceous % Shrubs % Mosses mF mN R 2 Maximum height of vegetation Y
steeper slopes and lower herbaceous cover, reflecting the transition from mesophilous to xerophilous grasslands. For the second axis, high correlations were found with most environ-mental variables although pH exhibited a partic-ularly high correlation. As no significant corre-lation was found between soil pH and any other environmental factor (Table 4), it can be consid-ered as an independent factor affecting the floristic composition of the studied communi-ties. The biogeographical parameter Y Lambert coordinate, however, exhibited the highest cor-relation with the second axis, confirming the influence of a south-north biogeographic influ-ence on floristic composition.
SPECIES DIVERSITY
Multiple regression analyses of local species richness on environmental variables yielded significant results for all grassland sets considered, explaining between 18.1% and 58.5% of the species richness variation (Table 5). Groups II and III were considered together given that they were just variations of the same community (mesophilous grasslands). Variables included in the models differed from one com-munity to another. Considering all grasslands together, local species richness increased with soil moisture (mF) and decreased with soil nutrient status (mN). Species richness in mesophilous grasslands was also negatively influenced by maximum vegetation height, bare soil percentage, moss cover and positively influenced by shrub cover. Soil pH was a signif-icant factor only for the whole data set. In acidic mesophilous grasslands, species richness was negatively influenced by the moss cover and positively by mF. These two variables explained 38.4% of the variation. Local species richness in xerophilous grasslands was signifi-cantly influenced by geographic location (Y Lambert coordinate). Grasslands with a more southern location showed higher species rich-ness. Festucion pallentis grasslands richness was positively influenced by structure variables (maximum height of vegetation and shrub cover).
DISCUSSION ACIDIC MESOPHILOUS GRASSLANDS
A similar grassland type has been described in the Viroin valley by BUTAYE et al. (2005)
(Agrostis capillaris-Cytisus scoparius commu-nity). BUTAYE et al. (2005) were nevertheless
unable to provide a complete description of this community because of the low number of relevés. From our more general survey, we suggest that these grasslands belong to the Chamaespartio-Agrostidenion alliance. Such grasslands were often spatially related with Sedo-Scleranthetea open grasslands, which could explain the pres-ence of species from this phytosociological class. Despite some affinities with xerophilous grass-lands regarding environmental variables, their floristic composition is typically mesophilous. Acidic grasslands have a unique composition because of the simultaneous occurrence of acidic and calcareous species at a 1 m2scale. This
floris-tic originality provides a high conservation value to this community.
ALKALINE MESOPHILOUS GRASSLANDS(GROUPSII ANDIII)
These grasslands belong to the Mesobromion alliance. Their very high species richness gives them a high conservation value and they are the principal habitat for orchid species. The presence of orchid species is the condition to consider cal-careous grasslands as a priority habitat, following the European Directive 92/43/CEE (Habitat Directive). Of the 93 sites that were investigated, about one third contained at least one orchid species. Moreover, some orchids may have been present in the remaining sites but did not occur in the relevés. The division between meso-xerophilous and typical mesophilous grasslands was not reported by BUTAYE et al. (2005) in the
Viroin valley. This was maybe due to the absence of a north-south gradient in their survey. VAN
SPEYBROUCKet al. (1989) reported a similar
influ-ence of the north-south gradient in a comparison of calcareous grasslands between the Belgian Meuse and the Lorraine districts.
VERY DRY GRASSLANDS(GROUPIV)
The Xerobromion reaches its northern boundary in Belgium, which was confirmed by its southern distribution within the study zone (Fig. 2). Nevertheless, the classification of these very dry grasslands in this phytosociological alliance is debatable. Following ROYER (1991), some of them should be classified in the Teucrio-Meso-bromenion sub-alliance. This sub-alliance is char-acterized by Teucrium chamaedrys, Globularia bisnagarica and Pulsatilla vulgaris, among oth-ers. Nonetheless, following NOIRFALISE & DETHIOUX (1982), those species are some Xero-bromion differential species. Although the com-munities we studied may well belong to the Xero-bromion, they are very impoverished as compared to its optimal range in central France (ROYER
1982), which does not prevent it from having an indisputable conservation value. Many species from this community are of particular interest for conservation in Belgium. These xerophilous grasslands are not as species-rich as the mesophilous ones and therefore the management objectives should be different, in terms of plant species richness.
FESTUCION PALLENTIS GRASSLANDS(GROUPV) Sites where this community occurred were previously described by DUVIGNEAUD(1982) and by DUVIGNEAUD & SAINTENOY-SIMON (1997). Nevertheless, this survey is the first to character-ize its originality. We demonstrated that the floris-tic composition of this community has specific characteristics compared to the other grassland communities. Most of its typical species such as Dianthus gratianopolitanus and Festuca pallens are rare and of conservation interest. Festuca pal-lens has its western limit of distribution in the Meuse valley.
KOELERIO-PHLEION GRASSLANDS(GROUPSVI AND
VII)
The Koelerio-Phleion phleoidis alliance was described as a rare vegetation in Belgium, and, therefore, provides a high conservation value to the sites where it occurs (DUVIGNEAUD & SAIN
-TENOY-SIMON 1988, DUVIGNEAUD & SAINTENOY -SIMON 1989). A distinction between groups VI and VII could be made as Xerobromion species were more represented in group VI (Heid des Gattes; Table 1). This has traditionally been inter-preted as an impoverishment of the flora in the ‘Heid de Stinval’ as compared to ‘Heid des Gattes’ (DUVIGNEAUD& SAINTENOY-SIMON1988, DUVIGNEAUD & SAINTENOY-SIMON 1989), and this was confirmed in our study by the lower local plant species richness recorded at the former site (Table 2). To our knowledge, this is the first time that these grassland communities are character-ized through direct comparisons at the regional scale and that their particularity is confirmed by statistical analysis.
SPECIESRICHNESS
The different results concerning species richness were generally in accordance with pre-vious surveys. Biogeographic influences have been described by different authors (e.g., VAN
SPEYBROEK et al. 1989, BRUUN 2000). These influences are often not easy to explain. In the current study, there was a species decline towards northern locations. This trend was par-ticularly strong for the Xerobromion grasslands (group IV), confirming that these grasslands reach their northern boundary in Belgium (WOLKINGER & PLANK 1981, MAUBERT & DUTOIT1995). The pH influence was due to the fact that acidic grasslands exhibited, on average, lower species richness as compared to other grasslands (Table 2). Higher species richness in alkaline grasslands has also been found by CRITCHLEY et al. (2002). Increased vegetation height and shrub cover generally negatively affected local species richness in calcareous grasslands (BOBBINK& WILLEMS1987). Never-theless, at a larger scale, variation in vegetation structure may provide a higher diversity of microhabitats and promote species richness (LINDBORG& ERIKSSON2004). The results found in this study are in accordance with the fact that higher soil fertility induces a decrease in species richness (e.g., AL-MUFTI et al. 1977, MARRS
REFERENCES
AL-MUFTIM.M., SYDESC.L., FURNESSS.B., GRIMEJ.P.
& BANDS.R., 1977. — A quantitative analysis of shoot phenology and dominance in herbaceous vegetation. J. Ecol. 65: 759-791.
ANDRÉ B. & VANDENDORPEL A., 2004. — Le projet
LIFE Nature de restauration et de gestion des milieux calcaires en Lesse et Lhomme (PROJET LIFE2000NATURE/B/7168) : une tradition pas-torale séculaire en dernier recours. Parcs & Réserves 59: 22-37.
BISTEAUE. & MAHYG., 2005. — Vegetation and seed
bank in a calcareous grassland restored from a Pinus forest. Appl. Veg. Sci. 8: 167-174.
BOBBINKR. & WILLEMSJ.H., 1987. — Increasing
dom-inance of Brachypodium pinnatum (L.) Beauv. in chalk grasslands : a threat to a species-rich ecosystem. Biol. Conserv. 40: 301-314.
BOBBINKR., HEINJOJ.D., SCHREURSJ., WILLEMSJ.H. &
ZIELMAN R., 1987. — Effects of selective
clip-ping and mowing time on species diversity in chalk grassland. Folia Geobot. Phytotax. 22: 363-376.
BOTTING., ETIENNEM., VERTÉP. & MAHYG., 2005. —
Methodology for the elaboration of Natura 2000 sites designation acts in the Walloon Region (Bel-gium) : calcareous grasslands in the Lesse-and-Lhomme area. Biotechnologie, Agronomie, Société, Environnement 9: 101-110.
BRAUN-BLANQUETJ., 1932. — Plant sociology : the
study of plant communities. McGraw-Hill, New York.
BRUUNH.H., 2000. — Patterns of species richness in dry grassland patches in an agricultural land-scape. Ecography 23: 641-650.
BUTAYE J., HONNAY O., ADRIAENS D., DELESCAILLE
L.M. & HERMYM., 2005. — Phytosociology and phytogeography of the calcareous grasslands on devonian limestone in southwest Belgium. Belg. J. Bot. 138: 24-38.
CRITCHLEY C.N.R., CHAMBERS B.J., FOWBERT J.A.,
BHOGALA., ROSES.C. & SANDERSONR.A., 2002.
— Plant species richness, functional type and soil properties of grasslands and allied vegetation in English environmentally sensitive areas. Grass Forage Sci. 57: 82-92.
DELESCAILLEL.M., DEWITTET. & HOFMANSK., 1995.
— La gestion mécanisée des pelouses sèches. Parcs Nationaux 50: 13-19.
DUVIGNEAUD J., 1982. — Les pelouses xériques
colonisant les falaises calcaires des vallées de
l’Our-the et de l’Amblève (province de Liège, Belgique) : leur importance floristique et phytogéographique. In: Colloques phytosociologiques : la végétation des pelouses calcaires, pp. 297-309. Strasbourg.
DUVIGNEAUDJ., 1989. — La petite Tinaimont à
Han-sur-Lesse (province de Namur). Parcs Nationaux 44: 113-121.
DUVIGNEAUD J. & SAINTENOY-SIMON J., 1988. — La
Heid des Gattes à Sougné-Remouchamps (Aywaille). Parcs Nationaux 43: 108-126.
DUVIGNEAUDJ. & SAINTENOY-SIMONJ., 1989. — Flore
et végétation de la Heid de Stinval (Louveigné, province de Liège). Les Naturalistes Belges 70: 129-138.
DUVIGNEAUDJ. & SAINTENOY-SIMONJ., 1997. — Les
“Tartines” de Comblain-au-Pont (province de Liège, Belgique). Les Naturalistes Belges 78: 11-16.
DZWONKO Z. & LOSTER S., 1998. — Dynamics of
species richness and composition in a limestone grassland restored after tree cutting. J. Veg. Sci. 9: 387-394.
ELLENBERG H., WEBER H.E., DÜLL R., WIRTH V.,
WERNERW. & PAULISSEND., 1992. — Zeigerwerte
von Pflanzen in Mitteleuropa. Scripta Geobot. 18: 3-258. Accessed online at http://www.boku.ac.at/ statedv/edvbotanik/zeigerwerte/, November 2005.
EUROPEAN ENVIRONMENT AGENCY, 2005. — EUNIS
database version 2.0. Accessed online at http://eunis.eea.europa.eu/index.jsp, March 2006. GRAUX G., 2004. — Le projet LIFE “restauration et
gestion durable des pelouses sèches en Haute Meuse”. Parcs & Réserves 59: 38-48.
HILLM.O. & SMILAUER P., 2005. — TWINSPAN for Windows version 2.3. Centre for Ecology and Hydrology & University of South Bohemia, Huntingdon & Ceské Budejovice.
JONGMANR.H.G., TERBRAAKC.F.J. & VANTONGEREN
O.F.R., 1995. — Data analysis in community and landscape ecology: 299 p. Cambridge university press, Cambridge.
KÖHLERB., GIGONA., EDWARDSP.J., KRÜSIB., LANGE
-NAUERR., LÜSCHERA. et al., 2005. — Changes in
species composition and conservation value of limestone grasslands in Northern Switzerland after 22 years of contrasting managements. Per-spect. Plant Ecol. Evol. Syst. 7: 51-67.
LAMBINONJ., DELVOSALLEL. & DUVIGNEAUDJ., 2004.
— Nouvelle flore de Belgique, du Grand-Duché de Luxembourg, du Nord de la France et des régions voisines. 5ème édn. Jardin botanique national de Belgique, Meise.
LINDBORG R. & ERIKSSON O., 2004. — Effects of restoration on plant species richness and compo-sition in Scandinavian semi-natural grasslands. Restor. Ecol. 12: 318-326.
MARRSR.H., 1993. — Soil fertility and nature conser-vation in Europe: theoretical considerations and practical management solutions. Adv. Ecol. Res. 24: 241-300.
MAUBERTP. & DUTOITT., 1995. — Connaître et gérer
les pelouses calcicoles: 65 p. Ministère de l’envi-ronnement, Cahier ATEN, Montpellier, France.
NOIRFALISEA. & DETHIOUXM., 1982. — Les pelouses
calcaires de la Belgique et leur protection. In: Colloques phytosociologiques : la végétation des pelouses calcaires, pp. 201-218. Strasbourg. PALMR., 2002. — Macros Minitab pour la régression
linéaire: 16 p. Available at http://www.fsagx.ac. be/si/reglin/accueil.htm
POSCHLOD P. & WALLISDEVRIES M.F., 2002. — The
historical and socioeconomic perspective of cal-careous grasslands: lessons from the distant and recent past. Biol. Conserv. 104: 361-376. ROYER J.M., 1982. — Caractérisation, répartition et
origine du Xerobromion. In: Colloques
phytoso-ciologiques : la végétation des pelouses calcaires, pp. 243-267. Strasbourg.
ROYERJ.M., 1991. — Synthèse eurosibérienne, phy-tosociologique et phytogéographique de la classe des Festuco-Brometea. Dissertationes Botanicae, vol. 178: 296 p. J.Cramer, Berlin-Stuttgart. SAS INSTITUTEINC., 1999. — SAS/STAT®User’s Guide,
version 8. SAS Institute Inc., Cary, NC, USA.
TERBRAAKC.F.J. & SMILAUERP., 2002. — CANOCO reference manual and CanoDraw for Windows user’s Guide : software for canonical community ordination, version 4.5: 500 p. Microcomputer Power, Ithaca, NY, USA.
VANSPEYBROEKD., KOEDAMN. & BÜSCHERP., 1989.
— On the delimitation of the Mesobromion and Xerobromion in Belgium and French Lorraine. Vegetatio 81: 137-144.
WILLEMS J.H., 2001. — Problems, approaches, and
results in restoration of Dutch calcareous grassland during the last 30 years. Restor. Ecol. 9: 147-154.
WOLKINGER F. & PLANK S., 1981. — Les pelouses
sèches en Europe. Collection Sauvegarde de la Nature, vol. 21: 57 p. Conseil de l’Europe, Stras-bourg.
APPENDIX
Name, number of plots, coordinates and location of the different study sites.
Site name Number of plots Site coordinates Location
Aisne 3 50°21’30” N - 5°33’54” E Durbuy
Aye 6 50°13’9” N - 5°18’18” E Marche-en-Famenne
Baillonville 6 50°17’34” N - 5°20’2” E Somme-Leuze
Bâtis d’Haur 8 50°6’4” N - 5°14’42” E Tellin
Belvédère 5 50°8’4” N - 5°12’11” E Rochefort
Biernauchamps 6 50°6’52” N - 5°14’24” E Rochefort
Bois Niaux 4 50°6’13” N - 5°9’59” E Rochefort
Bourdon 3 50°14’32” N - 5°23’22” E Hotton
Brochamps 10 50°5’55” N - 5°8’5” E Wellin
Brouire 3 50°6’18” N - 5°14’8” E Tellin
Carrière de Mont 3 50°32’18” N - 5°47’55” E Theux Carrière de Resteigne 9 50°5’23” N - 5°10’54” E Tellin
Carroi-Chenêt 6 50°5’48” N - 5°12’22” E Tellin Chafosse 3 50°12’55” N - 5°16’57” E Marche-en-Famenne Chéfiri 6 50°5’49” N - 5°10’28” E Tellin Chénisse 4 50°23’57” N - 5°30’40” E Durbuy Cocrai 2 50°11’54” N - 5°14’29” E Marche-en-Famenne Comblain-la-Tour 6 50°27’28” N - 5°34’2” E Hamoir Coteau du Tunnel 1 5 50°45’41” N - 5°38’22” E Bassenge Coteau du Tunnel 2 7 50°45’34” N - 5°38’32” E Bassenge Coteau du Tunnel 3 5 50°45’39” N - 5°38’23” E Bassenge
Falize 6 50°28’58” N - 5°41’29” E Aywaille
Fond des Vaulx 3 50°13’48” N - 5°21’24” E Marche-en-Famenne Fond Saint-Martin 10 50°8’3” N - 5°12’0” E Rochefort
Fouyeu 6 50°20’56” N - 5°30’6” E Durbuy Grand Va 3 50°23’40” N - 5°33’25” E Ferrières Grignaux 1 3 50°6’50” N - 5°10’13” E Rochefort Grignaux 2 5 50°6’52” N - 5°10’11” E Rochefort Grignaux 3 3 50°7’3” N - 5°10’10” E Rochefort Grignaux 4 3 50°7’6” N - 5°10’4” E Rochefort
Gros Tienne de Lavaux 10 50°6’21” N - 5°5’57” E Rochefort
Hamoir 8 50°25’30” N - 5°31’31” E Hamoir
Hampteau 3 50°15’45” N - 5°27’33” E Hotton
Hazalles 7 50°19’50” N - 5°28’54” E Durbuy
Hé des Gattes 9 50°28’50” N - 5°41’21” E Aywaille Heid de Stinval 7 50°32’13” N - 5°41’50” E Sprimont
Herbet 6 50°23’10” N - 5°31’35” E Durbuy Hérimont 4 50°6’54” N - 5°10’20” E Rochefort Heyoule 1 3 50°46’60” N - 5°39’59” E Bassenge Heyoule 2 8 50°46’47” N - 5°40’3” E Bassenge Heyoule 3 3 50°46’54” N - 5°39’58” E Bassenge La Soyère 5 50°5’13” N - 5°11’54” E Tellin
Les Vevis 3 50°6’34” N - 5°15’9” E Rochefort
Logne 6 50°23’39” N - 5°32’15” E Ferrières
Lorinchamps 10 50°5’45” N - 5°14’20” E Tellin
Maupas 10 50°6’37” N - 5°12’30” E Rochefort
Mignées 5 50°19’10” N - 5°28’28” E Erezée
Mont 7 50°32’24” N - 5°48’7” E Theux
Mont des Pins 6 50°22’1” N - 5°31’11” E Durbuy
Naurdichamps 3 50°6’38” N - 5°15’12” E Rochefort
Noiseux 5 50°17’48” N - 5°22’29” E Somme-Leuze
Pairées centre 10 50°5’59” N - 5°11’4” E Tellin
Pairées est 5 50°5’59” N - 5°11’15” E Tellin
Pairées sud 5 50°5’53” N - 5°10’53” E Tellin
Pairées ouest 8 50°6’0” N - 5°10’20” E Tellin
Palogne 4 50°23’50” N - 5°32’1” E Ferrières
Parking Han 3 50°7’42” N - 5°11’14” E Rochefort
Petit Herbet 3 50°23’0” N - 5°31’5” E Durbuy
Pierreux/Xhoris 8 50°27’7” N - 5°35’25” E Ferrières
Plome Mohon 5 50°17’20” N - 5°26’42” E Hotton
Prairie Hazalles 3 50°19’60” N - 5°29’1” E Durbuy Rochers Masbourg-Forrières 3 50°7’22” N - 5°17’29” E Nassogne Roches Noires 5 50°28’57” N - 5°34’29” E Comblain-au-Pont
Roké 4 50°7’22” N - 5°9’8” E Rochefort
Roptai 4 50°7’4” N - 5°8’32” E Rochefort
Rouge-Croix 10 50°8’8” N - 5°10’28” E Rochefort
Route Bure-Belvaux 1 4 50°6’33” N - 5°13’8” E Rochefort Route Bure-Belvaux 2 6 50°6’32” N - 5°12’43” E Rochefort Route Han-Hamerenne 4 50°8’4” N - 5°11’41” E Rochefort Route Resteigne-Belvaux 1 1 50°6’1” N - 5°11’18” E Tellin Route Resteigne-Belvaux 2 3 50°5’57” N - 5°11’19” E Tellin Route Resteigne-Belvaux 3 6 50°5’51” N - 5°11’9” E Tellin Route Resteigne-Belvaux 4 1 50°5’49” N - 5°11’19” E Tellin Route Resteigne-Belvaux 5 2 50°5’44” N - 5°11’18” E Tellin Route Tellin-Wavreille 1 3 50°6’2” N - 5°13’53” E Tellin Route Tellin-Wavreille 2 3 50°6’6” N - 5°13’54” E Tellin
Saint Remy 9 50°10’48” N - 5°13’31” E Rochefort
Spinets 1 2 50°10’32” N - 5°17’5” E Marche-en-Famenne
Spinets 2 9 50°10’13” N - 5°16’29” E Marche-en-Famenne
Sur Tombeux 4 50°25’55” N - 5°32’32” E Hamoir
Tartines 9 50°28’42” N - 5°35’25” E Comblain-au-Pont
Terre Telle 7 50°17’12” N - 5°27’11” E Hotton
Thier Pirard 3 50°28’30” N - 5°34’41” E Comblain-au-Pont
Tienne Moseray 3 50°5’44” N - 5°10’43” E Tellin
Tinaimont 1 4 50°7’45” N - 5°13’7” E Rochefort Tinaimont 2 2 50°7’48” N - 5°12’55” E Rochefort Tinaimont 3 2 50°7’48” N - 5°12’51” E Rochefort Tinaimont 4 4 50°7’47” N - 5°12’42” E Rochefort Tombe 9 50°47’37” N - 5°40’19” E Bassenge Verlaine 4 50°23’55” N - 5°30’57” E Durbuy
Viaduc E411 4 50°5’59” N - 5°7’33” E Rochefort