HAL Id: hal-02429551
https://hal.archives-ouvertes.fr/hal-02429551
Submitted on 6 Jan 2020HAL is a multi-disciplinary open access archive for the deposit and dissemination of sci-entific research documents, whether they are pub-lished or not. The documents may come from teaching and research institutions in France or abroad, or from public or private research centers.
L’archive ouverte pluridisciplinaire HAL, est destinée au dépôt et à la diffusion de documents scientifiques de niveau recherche, publiés ou non, émanant des établissements d’enseignement et de recherche français ou étrangers, des laboratoires publics ou privés.
Fenofibrate decreases plasma ceramides in type 2
diabetic patients: a novel marker for CVD?
Mikael Croyal, Zied Kaabia, Luis León, Stéphane Ramin-Mangata, Thomas
Baty, Fanta Fall, Stéphanie Billon-Crossouard, Audrey Aguesse, Tim
Hollstein, David Sullivan, et al.
To cite this version:
Mikael Croyal, Zied Kaabia, Luis León, Stéphane Ramin-Mangata, Thomas Baty, et al.. Fenofibrate decreases plasma ceramides in type 2 diabetic patients: a novel marker for CVD?. Journal of Diabetes & Metabolism, OMICS International, 2018, 44 (2), pp.143-149. �10.1016/j.diabet.2017.04.003�. �hal-02429551�
Fenofibrate decreases plasma ceramides in type 2 diabetic patients: a novel
marker for CVD?
Mikaël Croyala,b§, Zied Kaabiab*, Luis Leóna*, Stéphane Ramin-Mangatac,d, Thomas Batyb, Fanta Fallb, Stéphanie Billon-Crossouarda,b, Audrey Aguessea,b, Tim Hollsteine, David R.
Sullivanf, Estelle Nobecourtc,d,g, Gilles Lambertc,d,§ and Michel Krempfa,b,h.
* These authors contributed equally to the study
a
INRA, UMR 1280, Physiologie des Adaptations Nutritionnelles, Nantes, France. bCRNHO, West Human Nutrition Research Center, CHU, Nantes, France. cINSERM, UMR 1188 DéTROI, Sainte Clotilde, France. dUniversité de La Réunion, Faculté de Médecine, Saint Denis, France. eInterdisziplinäres Stoffwechsel Centrum Arbeitsbereich Lipidstoffwechsel, Charité Campus Wirchow Klinikum, Berlin, Germany. fThe Royal Prince Alfred Hospital, Sydney, Australia. gCHU de la Réunion, Saint-Pierre, France. hDepartment of Endocrinology, Metabolic diseases and Nutrition, G and R Laennec Hospital, Nantes, France.
§ Correspondence: Pr. Gilles Lambert and Mikaël Croyal, Inserm UMR 1188, Plateforme CYROI, 2 Rue Maxime Rivière, 97490 Sainte Clotilde, France. Tel: + 262 262 938 807; Fax: +262 262 938 801; E-mail: gilles.lambert@univ-reunion.fr; mikael.croyal@univ-nantes.fr.
ABSTRACT
Aim – The benefit on cardiovascular outcomes of the lipid-lowering drug Fenofibrate is controversial. Our aim was to find new circulating markers to identify patients susceptible to benefit from Fenofibrate prescription.
Methods - Analyses were conducted on plasma samples collected from 102 patients with type 2 diabetes before and after Fenofibrate treatment (200 mg/day) enrolled in the FIELD trial. Non-targeted and targeted lipid analyses, and apolipoprotein measurements were achieved using mass spectrometry methods.
Results - Lipidomics revealed a global decrease in ceramides after Fenofibrate treatment confirmed by quantitative analysis (-18.2%, p <0.001). These changes were strongly associated with those measured for plasma sphingomyelin (r =0.80, p <0.001) and to a lower extent with those of sphingosine-1-phosphate (r =0.34, p <0.001). Ceramide levels decreased in 73.5% of the patients. In addition to expected lipid modulations (decrease in triglycerides, total cholesterol, LDL-cholesterol and increase in HDL-cholesterol), Fenofibrate also lowered plasma apoC-II (-11.1%, p <0.01), apoC-III (-24.6%; p <0.001), apoB100 (-27.0%, p <0.01), sphingomyelinase (-7.6%, p <0.001), and increased plasma apoA-II (22.4%, p <0.001) as well as adiponectin (11.4%, p <0.001). No significant association was found between ceramide decrease and these modulations except for total cholesterol (r =0.20, p =0.047) and HDL protein components. At baseline, only elevated sphingolipid levels were significantly associated with ceramide reduction after Fenofibrate treatment.
Conclusion - Fenofibrate lowers plasma ceramide independently of usual lipid parameters. As ceramides are strong markers of atherosclerosis, our study underpins the need to further evaluate their contribution to cardiovascular events in Fenofibrate treated patients.
Keywords: Fenofibrate, type 2 diabetes, ceramide, lipidomics, apolipoprotein.
Abbreviations: CVD, cardiovascular disease; LDL-C, LDL-cholesterol; TG, triglyceride; HDL-C, HDL-cholesterol; PPAR, peroxisome proliferator-activated receptor alpha; ESI, electrospray ionization; LC-HRMS, Liquid Chromatography-High-Resolution Mass Spectrometry; m/z, mass-to-charge ratio; RSD, Relative Standard Deviation; S1P, sphingosine-1-phosphate; Cer, Ceramide; SM, Sphingomyelin; IS, Internal Standard; apo, apolipoprotein; TC, total cholesterol; S-ASM, secretory acid sphingomyelinase; PCA, Principal Component Analysis; OPLS, Orthogonal Projection of Latent Structures.
1. INTRODUCTION
The mortality caused by cardiovascular diseases (CVD) is almost four-fold higher in diabetic patients and accounts for about 80% of diabetes-related death [1, 2]. Patients with type 2 diabetes usually present with atherogenic dyslipidemia characterized by elevated triglycerides (TG), a mild elevation of low-density lipoprotein cholesterol (LDL-C), and low high-density lipoprotein cholesterol (HDL-C) levels [3].
Fibrates target this atherogenic dyslipidemia as they increase HDL-C and decrease plasma TG and LDL-C concentrations [4] via an activation of peroxisome proliferator-activated receptor alpha (PPAR), a major transcriptional regulator of lipoprotein metabolism [5, 6]. Fenofibrate was one of the first marketed fibrates and was tested in two large randomized cardiovascular outcome trials in diabetic patients. Unfortunately, both the Fenofibrate Intervention and Event Lowering in Diabetes (FIELD) and Action to Control Cardiovascular Risk in Diabetes (ACCORD-LIPID) trials [7, 8] failed to demonstrate significant benefits on cardiovascular events. However, significant beneficial effect was observed in a subset of patients with high TG and low HDL-C [9-12], suggesting that Fenofibrate may be cardio protective in some well-selected patients.
Here, we speculated that traditional as well as novel lipid markers could explain the heterogeneity in cardiovascular response observed with Fenofibrate treatment. To unravel potential new lipid markers of Fenofibrate treatment in a group of patients with type 2 diabetes, we performed non-targeted and targeted lipidomic approaches using several powerful mass spectrometry-based methods [13-15] to explore a broad range of biochemical parameters, including lipid species and apolipoproteins [16, 17].
2. MATERIALS AND METHODS
2.1. Patients and study design
We used plasma samples from 102 type 2 diabetic patients (males/females: 81/21, age: 62.2 ± 8.9, body mass index: 30.3 ± 5.3 kg/m²) enrolled at the Royal Prince Alfred Hospital (Sydney, Australia) for the FIELD study [18]. Briefly, plasma samples were collected after a 6-week placebo run-in period (a capsule daily at breakfast; no lipid-lowering medication) and after a 6-week active period (200 mg/day comicronized Fenofibrate) [19], and stored at -80°C until analysis. The study was approved by the Royal Prince Alfred Hospital ethics committee, and all patients gave written informed consent.
2.2. Non-targeted lipidomic analysis
All solvents were LC-MS grade and purchased from Biosolve (Valkenswaard, Netherlands) unless otherwise specified. We first performed a non-targeted lipidomic analysis on a subset of paired samples (38 patients arbitrarily selected, before and after treatment, n =76). Quality control (QC) samples were used as previously indicated [20]. To constitute the QC samples, 10 µL of each plasma sample (n =76) were collected and pooled before to be split in twenty aliquots of 25 µL. Lipids were extracted from plasma and QC samples (25 µL) with 500 µL of a methanol/chloroform mixture (2/1, v/v). Following centrifugation at 20,000 × g (10°C) for 10 min, supernatants were collected and dried under nitrogen, then solubilized in 100 μL of a isopropanol/acetonitrile/water mixture (2/1/1, v/v/v). Samples were arbitrarily randomized before analysis [20] by liquid chromatography-high resolution mass spectrometry (LC-HRMS). LC-HRMS analyses were performed on a SynaptTM G2 HRMS Q-TOF mass spectrometer equipped with an electrospray ionization (ESI) interface operating in the positive mode and an Acquity H-Class® UPLCTM device (Waters Corporation, Milford, MA, USA). Samples and QC extracts were injected (10 µL) onto a reversed-phased LC column
and lipids were eluted as detailed in Table S1 (‘Appendix A’, see supplementary material associated with this article online). The full-HRMS mode was applied for lipid detection (mass-to-charge ratio (m/z) range 50-1,200) at a mass resolution of 25,000 full-widths at half maximum. The ionization settings were as follows: capillary voltage, +2 kV; cone voltage, 30 V; desolvation gas (N2) flow rate, 900 L/h; desolvation gas/source temperatures, 550/120 °C.
Leucine enkephalin solution (2 µg/mL, 50% acetonitrile) was infused at a constant flow rate of 10 µL/min in the lockspray channel, allowing for correction of the measured m/z throughout the batch (theoretical m/z 556.2771 in positive mode). Data acquisition and processing were achieved using MassLynx® and MakerLynx® software (version 4.1, Waters Corporation). Lipid markers were extracted from the detected variables using an in-house database containing reference lipid standards (exact mass measured ± 5 ppm, elemental compositions, retention times, fragmentation patterns) [21, 22]. Simultaneously, QC sample analyses were executed to evaluate the analytical system performance during the run. The relative standard deviation (RSD, %) was calculated for QC variables peak areas to evaluate their analytical quality and robustness. Finally, lipid markers having a RSD value below 30% in QC samples were kept for subsequent multivariate analysis [20].
2.3. Quantification of sphingolipids in plasma
A pool of reference standard solutions, including sphingosine-1-phosphate (S1P d18:1), 9 ceramide (Cer) species and 9 sphingomyelin (SM) species (Avanti Polar, Coger, Paris, France; Table S2, ‘Appendix B’, see supplementary material associated with this article online), was prepared and then serially diluted in methanol to obtain 7 standard solutions ranging 1-500 nmol/L, 2-1000 nmol/L and 0.04-20 µmol/L for Cer, S1P, and SM, respectively. Standard solutions and plasma samples (10 µL) were then extracted with 500 µL of methanol/chloroform mixture (2/1, v/v) containing exogenous internal standards [IS; Cer
(d18:1/17:0), 500 nmol/L; S1P d17:1, 500 nmol/L and SM (d18:1/17:0), 5 µmol/L]. Samples were mixed and centrifuged 10 min at 20,000 × g (10 °C). Supernatants were dried under a nitrogen stream and solubilized in 100 µL of methanol for liquid chromatography-tandem mass spectrometry (LC-MS/MS) analyses. LC-MS/MS analyses were performed on a Xevo® TQD mass spectrometer with an ESI interface and an Acquity H-Class® UPLCTM device (Waters Corporation). Data acquisition and analyses were performed with MassLynx® and TargetLynx® software, respectively (version 4.1, Waters Corporation). Samples (10 µL) were injected onto a reversed-phase LC column and compounds were separated as indicated in Table S1 (‘Appendix A’, see supplementary material associated with this article online). Sphingolipids were then detected by the mass spectrometer with the ESI interface operating in the positive ion mode (capillary voltage, +3 kV; desolvatation gas (N2) flow and temperature,
1000 L/h and 400 °C; source temperature, 150 °C). The multiple reaction monitoring mode was applied as described in Table S2 (‘Appendix B’, see supplementary material associated with this article online). The linearity was expressed by the mean r² and was greater than 0.998 for all compounds (linear regression, 1/x weighting, origin excluded). The intra- and inter-assay imprecisions of the analytical method were assessed over 4 distinct experiments (6 replicates for 4 spiked concentrations), and RSD were below 13%, 6% and 9% for Cer, SM and S1P, respectively. Recoveries were assessed with IS and were greater than 91%.
2.4. Apolipoprotein quantification
Apolipoproteins (A-I, A-II, B100, C-I, C-II, C-III, E and M) were quantified in plasma samples (30 µL) using a validated multiplexed assay involving trypsin proteolysis and subsequent analysis of proteotypic peptides by LC-MS/MS [16, 17]. The ProteinWorksTM eXpress kit was used according to supplier’s instructions (Waters Corporation) for samples preparation. Unlabeled and labeled synthetic peptides (Thermo Scientific Biopolymers,
Darmstadt, Germany) were used for standard solutions and IS, respectively. After digestion, samples were cleaned using 30 mg Oasis HLB 1 cc Cartridges (Waters Corporation). The cartridges were conditioned, equilibrated, loaded, washed and eluted with methanol (1 mL), water (1 mL), samples (~200 µL), 5% methanol (1 mL) and 80% methanol (500 µL), respectively. Eluates were dried under nitrogen, reconstituted with 100 µL of 5% actetonitrile, and 10 µL were injected into the LC-MS/MS system as described previously [16] (Tables S1 and S3, ‘Appendix A’ and ‘Appendix C’, see supplementary material associated with this article online). The linearity was expressed by the mean r² which was greater than 0.995 for all compounds (linear regression, 1/x weighting, origin excluded). The intra- and inter-assay imprecisions were assessed over 4 distinct experiments (3 replicates for 60 plasma samples), and RSD were below 9% and 12% for all apolipoproteins, respectively.
2.5. Other biochemical measurements
Total cholesterol (TC), TG, HDL-C and LDL-C concentrations were obtained as described previously [18] and non-HDL cholesterol (non-HDL-C) concentrations were calculated. Secretory acid sphingomyelinase (S-ASM) and adiponectin concentrations were measured in plasma samples using two commercial ELISA kits according to the manufacturer’s instructions (Cloud-Clone Corp., Houston, TX, USA and Adipogen Corporation, San Diego, CA, USA, respectively). HDL particles diameters were estimated using the updated Shen’s model as follows [23]: HDL diameter (nm) = 4.66 + 12.31 × [HDL-C/(apoA-I+apoA-II)] with HDL-C, apoA-I and apoA-II in mg/dL.
2.6. Statistical analysis
Targeting a comprehensive comparison of our sample profiles originating from patients before and after treatment, unsupervised “Principal Component Analysis” (PCA) and
supervised “Orthogonal Projection of Latent Structures” (OPLS) models were used with dedicated software (SIMCA-P+, Umetrics, Umea, Sweden). The PCA model aims at giving a general overview of the main discriminations observed, whereas the OPLS model targets a supervised discrimination through the integration of a variable Y indicating the “treatment” status of the patients. Corresponding OPLS models Volcano plot allowed visualization of the most discriminant normalized variables between pre-treated and post-treated patient samples. Models validity was appraised using permutation tests and CV-ANOVA. Univariate statistical analyses were performed with GraphPad Prism software (version 6.0, GraphPad Software Inc., La Jolla, CA, USA). Results were compared using a paired t test and the parametric Pearson correlations. Results were expressed as mean ± standard deviation and were considered statistically significant at p <0.05.
3. RESULTS
3.1. Selection of lipid markers with Fenofibrate treatment
From non-targeted analysis, data processing allowed the detection of 1437 variables, each characterized by a specific m/z ratio and a retention time. All variables related to an overlapping isotopic signal were excluded and variables corresponding to a single marker detected in several adducts were added. 153 variables presented a possible match with our lipid database, based on accurate mass (± 5 ppm) and retention time (± 30 s) (Table S4, ‘Appendix D’, see supplementary material associated with this article online). Among these 153 lipids, 119 exhibiting a RSD value below 30% (range 0.2-27.4%) in QC samples (n =20) were selected for multivariate analysis. As shown in Figure 1A, the non-supervised PCA model exhibited a clear discrimination between the pre- and post-treatment groups. A supervised OPLS model was subsequently performed (R2(X) = 0.369, R2(Y) = 0.979, Q2 = 0.954, CV-ANOVA: p <0.0001) and relevant markers related to Fenofibrate treatment were
selected from the OPLS associated Volcano plot. As shown in Figure 1B, several markers were significantly regulated by Fenofibrate treatment. The major result (Figure 1B) was a global decrease in all variables corresponding to Cer species (i.e., 14 compounds including isomers, in red) after Fenofibrate treatment. Five Cer species were significantly down-regulated (p <0.001) using multivariate analysis.
3.2. Fenofibrate reduced plasma ceramide concentrations
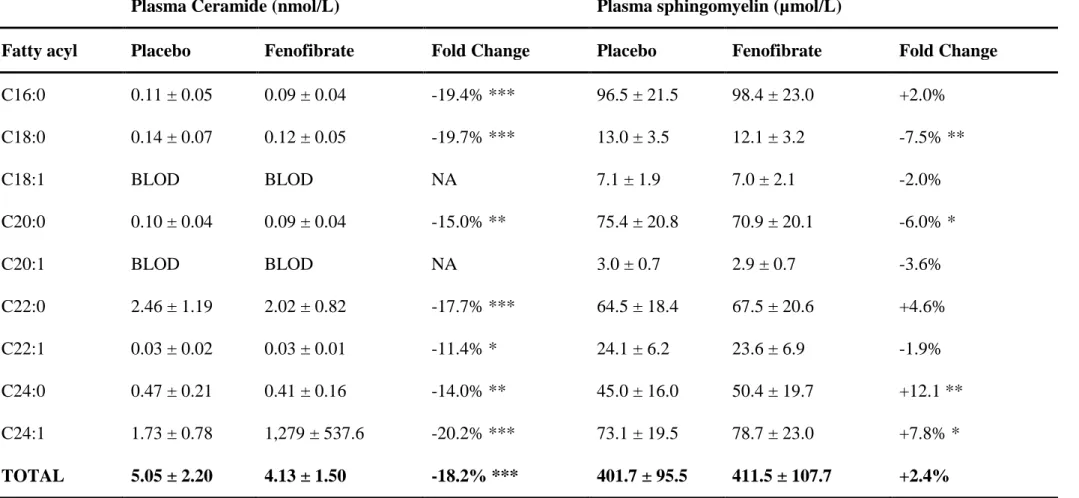
As detailed in Table 1, both Cer and SM species were quantified in the entire set of paired plasma samples (102 patients before and after treatment). Seven Cer species were detected in plasma and significantly decreased (-11.4% to -20.2%; p <0.05) by Fenofibrate treatment. In comparison with placebo, Fenofibrate reduced total plasma Cer levels by 18.2% (p <0.001). Cer reduction was observed for 73.5% of patients (n =75, Figure S1, ‘Appendix E’, see supplementary material associated with this article online). Although 4 out of 9 SM species detected in plasma were significantly altered (either increased or decreased significantly), Fenofibrate did not significantly affect total plasma SM levels (p =0.366). Neither did Fenofibrate modulate plasma S1P concentrations (1.07 ± 0.34 µmol/L vs 1.04 ± 0.33 µmol/L for placebo, respectively; p =0.377).
3.3. Ceramide lowering was not related to the secretory acid sphingomyelinase Compared with placebo (Figure 2A), Fenofibrate reduced significantly the product-to substrate ratios (Cer/SM) of S-ASM by 23.6% (p <0.001). Changes in plasma Cer and SM levels were strongly correlated (Figure 2B, r = 0.800, p <0.001) suggesting that both lipid families were similarly impacted by Fenofibrate treatment. As shown in Figure 2C, Fenofibrate slightly but significantly reduced S-ASM plasma concentrations by 7.6% (131.2 ±
32.0 ng/mL vs 121.2 ± 27.8 ng/mL, p <0.001), but these changes were not significantly associated with the Cer/SM ratios (Figure 2D, r = -0.146, p =0.124).
3.4. Effect of Fenofibrate on other plasma lipids and apolipoproteins
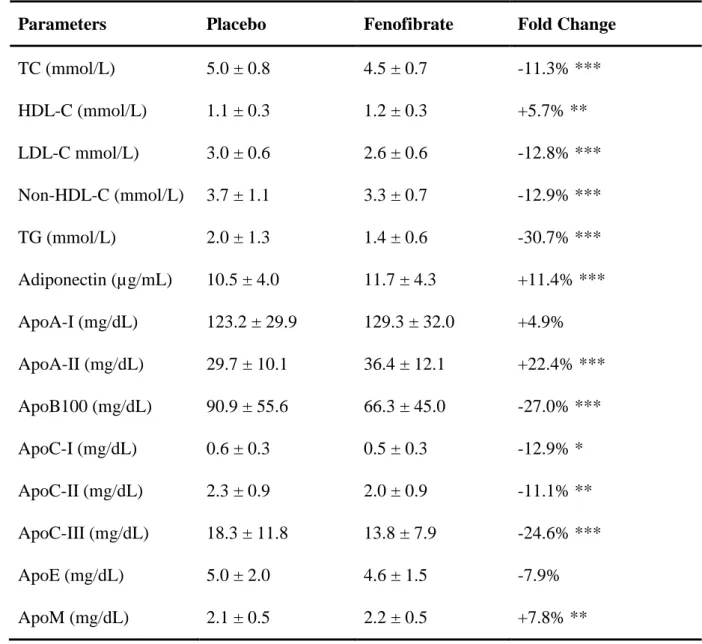
As previously reported (Table 2), Fenofibrate decreased TC by 11.3% (p < 0.001), LDL-C by 12.8% (p <0.001), non-HDL-C by 12.9% (p <0.001) and TG by 30.7% (p <0.001), while HDL-C increased by 5.7% (p <0.01). In addition, Fenofibrate increased plasma adiponectin by 11.4% (p <0.001), apoA-II by 22.4% (p <0.001), and apoM by 7.8% (p =0.016), but decreased plasma apoB100 by 27.0% (p <0.001), apoC-I by 12.9% (p =0.050), apoC-II by 11.1% (p =0.005), and apoC-III by 24.6% (p <0.001). No significant modulation was observed for plasma apoE (-7.9%, p =0.058) and apoA-I (6.1%, p =0.104). As expected, several associations were observed between plasma lipids and apolipoproteins (Table S5, ‘Appendix F’, see supplementary material associated with this article online). Of note, Fenofibrate treatment did not affect significantly the size of HDL particles (8.3 ± 0.9 vs 8.3 ± 1.0 nm for placebo, respectively; p =0.970).
3.5. Ceramide associations with plasma lipids and apolipoproteins
After Fenofibrate treatment, the decrease in plasma Cer levels was significantly associated with changes in TC (r =0.203, p =0.047), S1P (r =0.34, p <0.001), apoA-I (r =0.26, p =0.011), apoA-II (r =0.21, p =0.045), and apoM (r =0.24, p =0.018). No association was found between plasma S-ASM changes and any lipid species or HDL particles size. Neither did we find a correlation between plasma Cer and non-HDL-C, plasma TG and plasma apoB100. Changes in Cer were found similar when patients were stratified by elevated non-HDL-C (> 3.36 mmol/L) or TG (> 2.33 mmol/L) levels, or low HDL-C (< 0.88 mmol/L) or LDL-C (< 2.59 mmol/L) levels as described in studies showing significant
beneficial effects in these subgroups [9-12]. As shown in Figure 3, significant inverse correlations were found between the decrease of Cer and baseline levels of plasma Cer (r =-0.52, p <0.001), SM (r =-0.37, p <0.001), S1P (r =-0.27, p =0.01) and S-ASM (r =-0.22, p =0.034) concentrations, whereas no association was found between the reductions in plasma Cer and basal levels of apolipoproteins, adiponectin or other plasma lipids. Noteworthy, in the subset of patients in whom Cer levels were reduced by Fenofibrate (n =75), we found a significant correlation between Cer modulation and baseline levels of TG (r =-0.34, p =0.004). However, we did not find any association between Cer and TG modulations in the subset of patients (n = 50) with elevated baseline TG levels (> 1.7 mmol/L or 150 mg/dL).
4. DISCUSSION
In this study, we investigated modifications in the lipidomic profiles of type 2 diabetic patients treated with Fenofibrate. The non-targeted lipidomic approach unravels a global decrease in plasma ceramides (Cer), subsequently confirmed by accurate quantitative assay. Fenofibrate also increased plasma apolipoproteins related to HDL metabolism, and decreased those related to triglyceride-rich lipoprotein metabolism.
Sphingolipids and especially Cer appear to be important bioactive lipids involved in type 2 diabetes [24, 25] and atherosclerosis [26, 27]. Recently, Cer were independently associated with fatal outcome of coronary artery disease, and their predictive value was shown to be superior to that of LDL-C [28]. Cer play a central role in sphingolipid metabolism and their synthesis requires the activation of serine-palmitoyl transferase (SPT) [29]. After synthesis into the liver, Cer can be either converted to sphingomyelin (SM) or catabolized to sphingosine and then sphingosine-1-phosphate (S1P). Following hepatic synthesis, SM are incorporated to very-low-density lipoprotein (VLDL) for secretion into the circulation where
sphingomyelinases can convert them back into Cer. The availability of SM for transport on lipoproteins depends on SPT. Alternatively, adiponectin can stimulate ceramidase activity in the liver, thus enhancing the conversion of Cer into S1P, independently of other effects on lipid metabolism [30]. Thus, Cer reduction measured after Fenofibrate treatment could be either related to a direct impact on hepatic (SPT, ceramidase) or circulating (sphingomyelinase) synthesis, but also indirectly related to a carrier effect (VLDL) due to changes in circulating lipoprotein levels.
Here, Fenofibrate reduced plasma secretory acid sphingomyelinase (S-ASM) and related product-to-substrate ratio (i.e., Cer/SM). However these changes were not correlated and S-ASM changes did not appear to be the main factor related to the decrease of plasma Cer synthesis in the circulation. Plasma Cer reductions were only associated with elevated baseline levels of plasma Cer, SM, and S1P. SPT is strongly increased in hypertriglyceridemia [31] and we showed a significant association between Cer modulation and elevated baseline levels of TG in the subset of patients in whom Cer levels were reduced by Fenofibrate. It might be speculated that Fenofibrate could act on the SPT reaction, a rate-limiting step in the de novo synthesis of Cer [29], but this is unlikely since changes in Cer did not significantly correlate with changes in TG levels in these patients. Noteworthy, we did not observe any correlation with the increase of adiponectin known to be an independent stimulator of ceramidase leading to the conversion of Cer into S1P [30].
Fenofibrate is a PPARagonist and acts on lipoprotein metabolism [5, 6]. Thus, the reduction of plasma Cer observed in our study could result from changes in lipoprotein secretion and/or catabolism. The variations measured in apolipoprotein plasma concentrations could support this hypothesis but no correlation was found between plasma Cer and apolipoprotein variations except for HDL components. In that respect, Rosuvastatin also reduced Cer concentrations, which paralleled reductions in VLDL levels [32]. This suggests
that Cer modulations could be related to enhanced VLDL catabolism, an effect likely mediated by reductions in apoC-III [33] and/or by an increase in adiponectin [34]. It is known that Fenofibrate reduces VLDL levels by accelerating their catabolism [35-37]. Here, Fenofibrate significantly increased adiponectin and reduced apoC-III, but no correlation could be made between changes in both apoC-III and adiponectin and changes in Cer, so it is unlikely that Fenofibrate mediated Cer reductions might result from lower level of VLDL.
There are some limitations in this study. We have restricted the non-targeted lipidomic approach to known lipid compounds of our database, potentially neglecting some interesting but uncharacterized compounds. Accurate analysis of a more complete set of variables should therefore provide additional insights into the efficacy of Fenofibrate. It must also be underlined that the number of patients was small and that evaluation of Cer decrease on cardiovascular events was thus not feasible.
5. CONCLUSION
In summary, we showed that Fenofibrate reduced plasma Cer in type 2 diabetic patients, especially in those presenting with high baseline Cer levels. This modulation did not appear related to their lipoprotein profile, even when patients were stratified by baseline lipid levels. Our study therefore indicates that Cer could be an independent marker of CVD in type 2 diabetic patients, as previously suggested for non-diabetics [28, 38, 39]. As Cer appear to be involved in type-2 diabetes and atherosclerosis [24, 26, 27], our study underlines the need to evaluate their predictive value on the onset of cardiovascular events in those patients.
ACKNOWLEDMENTS
We are grateful to the Biogenouest CORSAIRE core facility for financial support. GL is the recipient of an Allocation de Recherche Chaire-Mixte (Inserm-Université de La Réunion), and a Programme de Recherche Hospitalière en Santé ANR-16-RHUS-0007.
DISCLOSURE OF INTEREST
REFERENCES
[1] Kannel WB. Lipids, diabetes, and coronary heart disease: insights from the Framingham Study. Am Heart J 1985;110:1100-7.
[2] Stamler J, Vaccaro O, Neaton JD, Wentworth D. Diabetes, other risk factors, and 12-yr cardiovascular mortality for men screened in the Multiple Risk Factor Intervention Trial. Diabetes Care 1993;16:434-44.
[3] Shipman KE, Strange RC, Ramachandran S. Use of fibrates in the metabolic syndrome: A review. World J Diabetes 2016;7:74-88.
[4] Farnier M. Update on the clinical utility of fenofibrate in mixed dyslipidemias: mechanisms of action and rational prescribing. Vasc Health Risk Manag 2008;4:991-1000. [5] Kersten S. Peroxisome proliferator activated receptors and lipoprotein metabolism. PPAR Res 2008:132960.
[6] Feng X, Gao X, Jia Y, Zhang H, Pan Q, Yao Z, Yang N, Liu J, Xu Y, Wang G, Yang X. PPAR-α Agonist Fenofibrate Decreased Serum Irisin Levels in Type 2 Diabetes Patients with Hypertriglyceridemia. PPAR Res 2015:924131.
[7] Keech A, Simes RJ, Barter P, Best J, Scott R, Taskinen MR, Forder P, Pillai A, Davis T, Glasziou P, Drury P, Kesäniemi YA, Sullivan D, Hunt D, Colman P, d'Emden M, Whiting M, Ehnholm C, Laakso M. Effects of long-term fenofibrate therapy on cardiovascular events in 9795 people with type 2 diabetes mellitus (the FIELD study): randomised controlled trial. Lancet 2005;366:1849-61.
[8] Ginsberg HN, Elam MB, Lovato LC, Crouse JR 3rd, Leiter LA, Linz P, Friedewald WT, Buse JB, Gerstein HC, Probstfield J, Grimm RH, Ismail-Beigi F, Bigger JT, Goff DC Jr, Cushman WC, Simons-Morton DG, Byington RP. Effects of combination lipid therapy in type 2 diabetes mellitus. N Engl J Med 2010;362:1563-74.
[9] Jun M, Foote C, Lv J, Neal B, Patel A, Nicholls SJ, Grobbee DE, Cass A, Chalmers J, Perkovic V. Effects of fibrates on cardiovascular outcomes: a systematic review and meta-analysis. Lancet 2010;375:1875-84.
[10] Burgess DC, Hunt D, Li L, Zannino D, Williamson E, Davis TM, Laakso M, Kesäniemi YA, Zhang J, Sy RW, Lehto S, Mann S, Keech AC. Incidence and predictors of silent myocardial infarction in type 2 diabetes and the effect of fenofibrate: an analysis from the
Fenofibrate Intervention and Event Lowering in Diabetes (FIELD) study. Eur Heart J 2010;31:92-9.
[11] Bruckert E, Labreuche J, Deplanque D, Touboul PJ, Amarenco P. Fibrates effect on cardiovascular risk is greater in patients with high triglyceride levels or atherogenic dyslipidemia profile: a systematic review and meta-analysis. J Cardiovasc Pharmacol 2011;57:267-72.
[12] Elam MB, Ginsberg HN, Lovato LC, Corson M, Largay J, Leiter LA, Lopez C, O'Connor PJ, Sweeney ME, Weiss D, Friedewald WT, Buse JB, Gerstein HC, Probstfield J, Grimm R, Ismail-Beigi F, Goff DC Jr, Fleg JL, Rosenberg Y, Byington RP. Association of Fenofibrate Therapy With Long-term Cardiovascular Risk in Statin-Treated Patients With Type 2 Diabetes. JAMA Cardiol 2016;doi:10.1001/jamacardio.2016.4828.
[13] Lam SM, G Shui. Lipidomics as a principal tool for advancing research. J Genet Genomics 2013;40:375-90.
[14] Han X. Lipidomics for studying metabolism. Nat Rev Endocrinol 2016;12:668-79. [15] Quehenberger O, Armando AM, Brown AH, Milne SB, Myers DS, Merrill AH, Bandyopadhyay S, Jones KN, Kelly S, Shaner RL, Sullards CM, Wang E, Murphy RC, Barkley RM, Leiker TJ, Raetz CR, Guan Z, Laird GM, Six DA, Russell DW, McDonald JG, Subramaniam S, Fahy E, Dennis EA. Lipidomics reveals a remarkable diversity of lipids in human plasma. J Lipid Res 2010;51:3299-305.
[16] Croyal M, Fall F, Ferchaud-Roucher V, Chétiveaux M, Zaïr Y, Ouguerram K, Krempf M, Nobécourt E. Multiplexed peptide analysis for kinetic measurements of major human apolipoproteins by LC/MS/MS. J Lipid Res 2016;57:509-15.
[17] Tavori H, Christian D, Minnier J, Plubell D, Shapiro MD, Yeang C, Giunzioni I, Croyal M, Duell PB, Lambert G, Tsimikas S, Fazio S. PCSK9 Association With Lipoprotein(a). Circ Res 2016;119:29-35.
[18] Lambert G, Ancellin N, Charlton F, Comas D, Pilot J, Keech A, Patel S, Sullivan DR, Cohn JS, Rye KA, Barter PJ. Plasma PCSK9 concentrations correlate with LDL and total cholesterol in diabetic patients and are decreased by fenofibrate treatment. Clin Chem 2008;54:1038-45.
[19] Scott R, Best J, Forder P, Taskinen MR, Simes J, Barter P, Keech A [FIELD Study Investigators]. Fenofibrate Intervention and Event Lowering in Diabetes (FIELD) study:
baseline characteristics and short-term effects of fenofibrate [ISRCTN64783481]. Cardiovasc Diabetol 2005;4:13.
[20] Dunn WB, Broadhurst D, Begley P, Zelena E, Francis-McIntyre S, Anderson N, Brown M, Knowles JD, Halsall A, Haselden JN, Nicholls AW, Wilson ID, Kell DB, Goodacre R. Procedures for large-scale metabolic profiling of serum and plasma using gas chromatography and liquid chromatography coupled to mass spectrometry. Nat Protoc 2011;6:1060-83. [21] Gallart-Ayala H, Courant F, Severe S, Antignac JP, Morio F, Abadie J, Le Bizec B. Versatile lipid profiling by liquid chromatography-high resolution mass spectrometry using all ion fragmentation and polarity switching. Preliminary application for serum samples phenotyping related to canine mammary cancer. Anal Chim Acta 2013;796:75-83.
[22] Sandra K, Pereira Ados S, Vanhoenacker G, David F, Sandra P. Comprehensive blood plasma lipidomics by liquid chromatography/quadrupole time-of-flight mass spectrometry. J Chromatogr A 2010;1217:4087-99.
[23] Mazer NA, Giulianini F, Paynter NP, Jordan P, Mora S. A comparison of the theoretical relationship between HDL size and the ratio of HDL cholesterol to apolipoprotein A-I with experimental results from the women’s health study. Clin Chem 2013;59:949-58.
[24] Boon J, Hoy AJ, Stark R, Brown RD, Meex RC, Henstridge DC, Schenk S, Meikle PJ, Horowitz JF, Kingwell BA, Bruce CR, Watt MJ. Ceramides contained in LDL are elevated in type 2 diabetes and promote inflammation and skeletal muscle insulin resistance. Diabetes 2013;62:401-10.
[25] Haus JM, Kashyap SR, Kasumov T, Zhang R, Kelly KR, Defronzo RA, Kirwan JP. Plasma ceramides are elevated in obese subjects with type 2 diabetes and correlate with the severity of insulin resistance. Diabetes 2009;58:337-43.
[26] Cheng JM, Suoniemi M, Kardys I, Vihervaara T, de Boer SP, Akkerhuis KM, Sysi-Aho M, Ekroos K, Garcia-Garcia HM, Oemrawsingh RM, Regar E, Koenig W, Serruys PW, van Geuns RJ, Boersma E, Laaksonen R. Plasma concentrations of molecular lipid species in relation to coronary plaque characteristics and cardiovascular outcome: Results of the ATHEROREMO-IVUS study. Atherosclerosis 2015;243:560-6.
[27] Bismuth J, Lin P, Yao Q, Chen C. Ceramide: a common pathway for atherosclerosis? Atherosclerosis 2008;196:497-504.
[28] Tarasov K, Ekroos K, Suoniemi M, Kauhanen D, Sylvänne T, Hurme R, Gouni-Berthold I, Berthold HK, Kleber ME, Laaksonen R, März W. Molecular lipids identify cardiovascular risk and are efficiently lowered by simvastatin and PCSK9 deficiency. J Clin Endocrinol Metab 2014;99:E45-52.
[29] Deevska GM, Sunkara M, Morris AJ, Nikolova-Karakashian MN. Characterization of secretory sphingomyelinase activity, lipoprotein sphingolipid content and LDL aggregation in ldlr-/- mice fed on a high-fat diet. Biosci Rep 2012;32:479-90.
[30] Holland WL, Miller RA, Wang ZV, Sun K, Barth BM, Bui HH, Davis KE, Bikman BT, Halberg N, Rutkowski JM, Wade MR, Tenorio VM, Kuo MS, Brozinick JT, Zhang BB, Birnbaum MJ, Summers SA, Scherer PE. Receptor-mediated activation of ceramidase activity initiates the pleiotropic actions of adiponectin. Nat Med 2011;17:55-63.
[31] Torre-Villalvazo I, Gonzalez F, Aguilar-Salinas CA, Tovar AR, Torres N. Dietary soy protein reduces cardiac lipid accumulation and the ceramide concentration in high-fat diet-fed rats and ob/ob mice. J Nutr 2009;139:2237-43.
[32] Ng TW, Ooi EM, Watts GF, Chan DC, Meikle PJ, Barrett PH. Association of Plasma Ceramides and Sphingomyelin With VLDL apoB-100 Fractional Catabolic Rate Before and After Rosuvastatin Treatment. J Clin Endocrinol Metab 2015;100:2497-501.
[33] Ooi EM, Watts GF, Chan DC, Chen MM, Nestel PJ, Sviridov D, Barrett PH. Dose-dependent effect of rosuvastatin on VLDL-apolipoprotein C-III kinetics in the metabolic syndrome. Diabetes Care 2008;31:1656-61.
[34] Ng TW, Watts GF, Farvid MS, Chan DC, Barrett PH. Adipocytokines and VLDL metabolism: independent regulatory effects of adiponectin, insulin resistance, and fat compartments on VLDL apolipoprotein B-100 kinetics? Diabetes 2005;54:795-802.
[35] Watts GF, Barrett PH, Ji J, Serone AP, Chan DC, Croft KD, Loehrer F, Johnson AG. Differential regulation of lipoprotein kinetics by atorvastatin and fenofibrate in subjects with the metabolic syndrome. Diabetes 2003;52:803-11.
[36] Vergès B, Florentin E, Baillot-Rudoni S, Monier S, Petit JM, Rageot D, Gambert P, Duvillard L. Effects of 20 mg rosuvastatin on VLDL1-, VLDL2-, IDL- and LDL-ApoB kinetics in type 2 diabetes. Diabetologia 2008;51:1382-90.
[37] Ouguerram K, Magot T, Zaïr Y, Marchini JS, Charbonnel B, Laouenan H, Krempf M. Effect of atorvastatin on apolipoprotein B100 containing lipoprotein metabolism in type-2 diabetes. J Pharmacol Exp Ther 2003;306:332-7.
[38] Sigruener A, Kleber ME, Heimerl S, Liebisch G, Schmitz G, Maerz W. Glycerophospholipid and sphingolipid species and mortality: the Ludwigshafen Risk and Cardiovascular Health (LURIC) study. PLoS One 2014;9:e85724.
[39] Laaksonen R, Ekroos K, Sysi-Aho M, Hilvo M, Vihervaara T, Kauhanen D, Suoniemi M, Hurme R, März W, Scharnagl H, Stojakovic T, Vlachopoulou E, Lokki ML, Nieminen MS, Klingenberg R, Matter CM, Hornemann T, Jüni P, Rodondi N, Räber L, Windecker S, Gencer B, Pedersen ER, Tell GS, Nygård O, Mach F, Sinisalo J, Lüscher TF. Plasma ceramides predict cardiovascular death in patients with stable coronary artery disease and acute coronary syndromes beyond LDL-cholesterol. Eur Heart J 2016;37:1967-76.
Table 1 - Mean ± standard deviation of ceramide and sphingomyelin concentrations measured in plasma. A paired t test was used for group comparisons (*, p <0.05; **, p <0.01; ***, p <0.001). BLOD: below the limit of detection, NA: not applicable.
Plasma Ceramide (nmol/L) Plasma sphingomyelin (µmol/L)
Fatty acyl Placebo Fenofibrate Fold Change Placebo Fenofibrate Fold Change
C16:0 0.11 ± 0.05 0.09 ± 0.04 -19.4% *** 96.5 ± 21.5 98.4 ± 23.0 +2.0% C18:0 0.14 ± 0.07 0.12 ± 0.05 -19.7% *** 13.0 ± 3.5 12.1 ± 3.2 -7.5% ** C18:1 BLOD BLOD NA 7.1 ± 1.9 7.0 ± 2.1 -2.0% C20:0 0.10 ± 0.04 0.09 ± 0.04 -15.0% ** 75.4 ± 20.8 70.9 ± 20.1 -6.0% * C20:1 BLOD BLOD NA 3.0 ± 0.7 2.9 ± 0.7 -3.6% C22:0 2.46 ± 1.19 2.02 ± 0.82 -17.7% *** 64.5 ± 18.4 67.5 ± 20.6 +4.6% C22:1 0.03 ± 0.02 0.03 ± 0.01 -11.4% * 24.1 ± 6.2 23.6 ± 6.9 -1.9% C24:0 0.47 ± 0.21 0.41 ± 0.16 -14.0% ** 45.0 ± 16.0 50.4 ± 19.7 +12.1 ** C24:1 1.73 ± 0.78 1,279 ± 537.6 -20.2% *** 73.1 ± 19.5 78.7 ± 23.0 +7.8% * TOTAL 5.05 ± 2.20 4.13 ± 1.50 -18.2% *** 401.7 ± 95.5 411.5 ± 107.7 +2.4%
Table 2 - Mean ± standard deviation of plasma lipids before and after Fenofibrate treatment.
1
A paired t test was used for group comparisons (* p <0.05; ** p <0.01; *** p <0.001).
2
Parameters Placebo Fenofibrate Fold Change
TC (mmol/L) 5.0 ± 0.8 4.5 ± 0.7 -11.3% *** HDL-C (mmol/L) 1.1 ± 0.3 1.2 ± 0.3 +5.7% ** LDL-C mmol/L) 3.0 ± 0.6 2.6 ± 0.6 -12.8% *** Non-HDL-C (mmol/L) 3.7 ± 1.1 3.3 ± 0.7 -12.9% *** TG (mmol/L) 2.0 ± 1.3 1.4 ± 0.6 -30.7% *** Adiponectin (µg/mL) 10.5 ± 4.0 11.7 ± 4.3 +11.4% *** ApoA-I (mg/dL) 123.2 ± 29.9 129.3 ± 32.0 +4.9% ApoA-II (mg/dL) 29.7 ± 10.1 36.4 ± 12.1 +22.4% *** ApoB100 (mg/dL) 90.9 ± 55.6 66.3 ± 45.0 -27.0% *** ApoC-I (mg/dL) 0.6 ± 0.3 0.5 ± 0.3 -12.9% * ApoC-II (mg/dL) 2.3 ± 0.9 2.0 ± 0.9 -11.1% ** ApoC-III (mg/dL) 18.3 ± 11.8 13.8 ± 7.9 -24.6% *** ApoE (mg/dL) 5.0 ± 2.0 4.6 ± 1.5 -7.9% ApoM (mg/dL) 2.1 ± 0.5 2.2 ± 0.5 +7.8% **
TC, total cholesterol; HDL-C, high-density lipoprotein cholesterol; LDL-C, low-density
3
lipoprotein cholesterol; non-HDL-C, non-HDL cholesterol; TG, triglyceride; Apo,
4
apolipoprotein.
5 6 7
FIGURE CAPTIONS
1
Figure 1 - Lipidomics unravels ceramides as new potential lipid markers of Fenofibrate
2
efficiency. (A) Principal component analysis (PCA) model based on identified lipids (n
3
=119) from the lipid fingerprints of human plasma samples (placebo versus Fenofibrate, n
4
=38 per group). (B) Orthogonal Projection of Latent Structures (OPLS) corresponding
5
Volcano plot representation highlighting major lipid class differences associated with
6
treatment, namely ceramide species (red dots) and additional significant lipids labeled (PC,
7
phosphatidylcholine; PG, phosphatidylglycerol; TG, triglyceride; DG, diglyceride; VIP,
8
variable importance of projection).
9
Figure 2 – Associations between ceramides (Cer) and sphingomyelins (SM) changes into
10
the circulation. (A) Changes in ceramides-to-sphingomyelins (Cer/SM) ratios after
11
Fenofibrate treatment. (B) Pearson correlation between changes in plasma Cer and SM after
12
Fenofibrate treatment. (C) Effect of Fenofibrate on secretory acid sphingomyelinase
(S-13
ASM) concentrations. (D) Pearson correlation between changes in Cer/SM ratios and S-ASM
14
concentrations after Fenofibrate treatment. *p <0.05; **p <0.01; ***p <0.001.
15
Figure 3 – Associations between ceramide (Cer) reductions and lipid parameters.
16
Pearson correlation between changes in plasma Cer after treatment and (A) basal plasma Cer,
17
(B) basal plasma sphingomyelin (SM), (C) basal plasma sphingosine-1-phosphate (S1P), and
18
(D) basal plasma secretory acid sphingomyelinase (S-ASM) concentrations.
19
20 21