© Baptiste Colas, 2020
Looking for heterogeneous firms : sources and
implications for financial statement users
Thèse
Baptiste Colas
Doctorat en sciences de l'administration
Philosophiæ doctor (Ph. D.)
Looking for heterogeneous firms: sources and
implications for financial statement users
Thèse
Baptiste Colas
Sous la direction de :
Résumé
Cette thèse s’intéresse à la sélection de comparables dans le contexte de la comptabilité financière. Dans ce contexte, l’analyse de firmes se fait de façon relative, en comparaison avec d’autres firmes semblables — les « comparables ». Ainsi, il est nécessaire de former des groupes homogènes de firmes à ces fins. L’utilisation des classifications d’industries est la méthode privilégiée, car elle permet de grouper les firmes sur des critères objectifs et en lien avec le cœur de l’activité des firmes. Elles présentent l’avantage d’être très largement disponible, et très simples à utiliser. Dans cette thèse l’objectif principal est d’identifier des sources d’hétérogénéité intra-industrie, et d’examiner leurs conséquences à plusieurs niveaux. J’utilise trois approches différentes pour atteindre cet objectif.
Dans un premier temps, l’objectif est de proposer une utilisation plus complète des classifications d’industries. Ainsi, j’utilise exclusivement les classifications d’industries pour identifier une source d’hétérogénéité : les industry classification misfits. La littérature précédente a pour habitude d’utiliser les différentes classifications comme des substituts l’une de l’autre, considérant qu’elles groupent les firmes sur la même dimension d’homogénéité. Ici, je prends une approche différente et considère ces classifications comme des compléments l’une de l’autre, en argumentant qu’elles possèdent le même objectif (former des groupes homogènes de firmes), mais qu’elles le font sur des dimensions différentes de l’homogénéité. Ainsi, en étudiant leur convergence j’identifie les industry
classification misfits par opposition à celles appartenant au cœur de l’industrie (industry core firms). Ultimement, je montre les biais qu’engendre l’inclusion des industry classification misfits dans les groupes de comparables pour l’estimation des modèles d’accruals et la
prédiction des misstatements.
Dans un second temps, l’objectif est d’intégrer l’utilisation des ratios comptables et financiers pour identifier les firmes hétérogènes. Je pars de la classification qui offre la plus grande homogénéité pour développer une mesure continue d’homogénéité intra-industrie. J’utilise les ratios comptables et financiers qui sont régulièrement utilisés pour mesurer l’homogénéité d’un groupe de firmes. Contrairement aux études précédentes qui utilisent individuellement ces ratios, je propose une approche multidimensionnelle à l’homogénéité. Dans une première
étape, je définis les ratios pertinents pour définir chacune des industries, puis j’utilise simultanément ces ratios pour construire ma mesure continue de distance intra-industrie entre chacune des firmes. Ainsi, je présente les firmes étant les plus éloignées du cœur de l’industrie comme des firmes différenciées (differentiated firms). Ensuite, j’étudie les conséquences sur les marchés financiers pour ces firmes. Je montre que les nouvelles d’industries sont incorporées dans les prix des firmes différenciées avec un retard. Aussi, je montre que les analystes couvrent moins ces firmes et commettent plus d’erreurs dans la prédiction des bénéfices de ces firmes. Enfin, je montre que les firmes différenciées souffrent d’une asymétrie de l’information plus importante sur les marchés, ce qui se matérialise par un plus grand écart bid-ask et une action moins liquide.
Enfin, dans un troisième temps, l’objectif est d’utiliser les liens entre les industries pour mieux caractériser les firmes multisegments. Je m’intéresse à une source naturelle d’hétérogénéité intra-industrie — les conglomérats. Par définition, ces firmes opèrent dans plusieurs industries différentes, mais la construction des classifications d’industries restreint leur classification à une industrie. Ceci crée donc naturellement de l’hétérogénéité au sein des industries ce qui amène à les considérer comme complexes, notamment pour les analystes qui se spécialisent par industries. Habituellement, les études précédentes ont considéré que plus une compagnie possède de segments d’affaires différents, plus elle sera complexe. Dans ce chapitre, j’apporte une nuance sur leur complexité en prenant en compte le lien entre les différentes industries dans lesquelles opèrent les conglomérats. Je développe une mesure de distance entre les industries basée sur les ratios financiers. Ainsi, je considère les segments d’affaires comme complexes uniquement ceux qui sont éloignés du cœur d’activité de la firme. Par conséquent, deux conglomérats possédant le même nombre de segments d’affaires peuvent être complexes ou non, dépendamment si leurs activités secondaires sont dans une industrie proche de leur activité première. Ultimement, je montre les conséquences de ces firmes pour les analystes. Mes résultats dévoilent que les analystes ont plus de mal à prédire les bénéfices des conglomérats complexes.
Abstract
This thesis focuses on the selection of peer firms in the context of financial accounting. In this context, the analysis of firms is done cross-sectionally, in comparison with other similar firms – peer firms. Thus, it is necessary to form homogeneous groups of firms for these purposes. Industry classifications represent the most used method because it proposes an objective way to group firms based on their business activities. In addition, they present the advantage of being publicly available and easy to implement. In this thesis, the main objective is to identify sources of intra-industry heterogeneity, and to examine their consequences for several stakeholders. I provide three ways to fulfill this objective.
First, I aim to provide a more complete exploitation of the information provided by industry classifications. Thus, I exclusively use them to identify a source of heterogeneity: industry
classification misfits. Previous literature tends to consider industry classifications as
substitutes for each other, assuming that they group firms on the same dimension of homogeneity. Here, I take a different approach and consider these classifications as complements arguing that they have the same objective (to form homogeneous groups of firms), but that they do it on different dimension of homogeneity. Thus, by studying their convergence I identify firms that are not systematically classified into the same peer group by industry classifications. I refer to them as industry classification misfits as opposed to those belonging to the heart of industry (industry core firms). Ultimately, I show the consequences of the inclusion of industry classification misfits in peer groups for the estimation of accrual models and the prediction of misstatements.
Then, the main objective is to build on fundamental ratios to identify heterogeneous firms. I start from the classification which offers the greatest homogeneity (GICS) to develop a continuous measure of intra-industry homogeneity. I use accounting and financial ratios which are regularly utilized to measure the homogeneity of peer groups. Unlike previous studies which bring these ratios individually, I propose a multidimensional approach to homogeneity. In a first step, I select the relevant ratios that define each industry. These ratios are then used simultaneously to build my continuous measure of intra-industry distance between each firm belonging to the same industry. Ultimately, I present the firms that are
furthest from the industry core as differentiated firms. Then, I study the consequences on financial markets for these firms. I show that industry news is incorporated into differentiated firms stock prices with a delay. Also, I show that analysts are less willing to cover these firms and make more mistakes in forecasting differentiated firms’ earnings. Finally, I show that differentiated firms suffer from asymmetric information on the stock market, which occurs as a larger bid-ask spreads and less liquid stocks.
Finally, I aim to account for the industry relatedness to better characterize multi-segment firms. I focus on a natural source of intra-industry heterogeneity - conglomerates. These firms operate in several different industries through secondary business segments, but the construction of industry classifications restricts their classification to solely one industry. Therefore, it naturally creates heterogeneity within industries which leads to consider them as complex, especially for analysts who specialize in industries. Usually, previous studies have considered that the more business segments a company has, the more complex it will be. In this chapter, I add a nuance to this proxy for complexity by considering the relatedness between the industry membership of the secondary business segments in which conglomerates operate. I develop an inter-industry distance based on financial ratios to consider the relationship between industries. Thus, I regard business segments as complex only those that are unrelated to the conglomerate primary business segment. Therefore, two conglomerates sharing the same number of business segments are not systematically equally complex as it depends on whether their secondary activities are in an industry close to their primary activity. Ultimately, I show the consequences of complex business segments for financial analysts. My results show that conglomerates with complex business segments have harder earnings to predict.
Table des matières
Résumé ... ii
Abstract ... iv
Table des matières ... vi
Liste des figures, tableaux, illustrations ... ix
Liste des abréviations, sigles, acronymes ... x
Remerciements ... xi
Introduction ... 1
1. Literature review on peer selection methods and intra-industry homogeneity ... 9
1.1. Industry classifications ... 9
1.1.1. Definition, structure and preliminary evidence ... 9
1.1.2. Improvements of intra-industry homogeneity using accounting information .... 13
1.2. Direct alternatives to industry classifications ... 17
2. Industry classification misfits ... 20
2.1. Introduction ... 20
2.2. Hypothesis development ... 21
2.2.1. Accruals models and intra-industry homogeneity ... 21
2.2.2. Industry classification misfits ... 22
2.3. Research design ... 23 2.3.1. Construction of MISFIT ... 23 2.3.2. Empirical models... 26 2.3.2.1. Accruals ... 26 2.3.2.2. Misstatements ... 27 2.3.2.3. Return comovement ... 28 2.3.3. Sample construction ... 29 2.4. Results ... 30 2.4.1. Methodology results ... 30 2.4.2. Univariate statistics ... 32 2.4.3. Accruals ... 35 2.4.4. Misstatements ... 37
2.4.5. Return comovement ... 42
2.5. Additional analysis ... 44
2.5.1. Other accruals models ... 44
2.5.2. Alternative definitions of misfit ... 46
2.5.3. Matched sample... 48
2.6. Summary ... 49
3. Differentiated firms ... 52
3.1. Introduction ... 52
3.2. Hypothesis development ... 53
3.2.1. Industry component of returns ... 53
3.2.2. Analysts ... 54
3.2.3. Information asymmetry ... 56
3.3. Research design ... 56
3.3.1. Construction of DIFF ... 56
3.3.1.1. Stage 1: Industry Characteristics ... 57
3.3.1.2. Stage 2: Industry Centroid ... 58
3.3.1.3. Stage 3: Differentiation (distance) Score ... 59
3.3.2. Empirical models... 60
3.3.2.1. Industry components of returns ... 60
3.3.2.2. Analyst tests ... 61
3.3.2.3. Information asymmetry tests ... 62
3.3.3. Sample construction ... 63
3.4. Results ... 64
3.4.1. Descriptive statistics ... 64
3.4.2. Methodology results ... 65
3.4.3. Regression results ... 70
3.4.3.1. Industry component of returns ... 70
3.4.3.2. Analysts ... 71
3.4.3.3. Information Asymmetry ... 74
3.5. Summary ... 75
4.1. Introduction ... 77
4.2. Hypothesis development ... 78
4.3. Research design ... 81
4.3.1. Construction of CPX ... 81
4.3.1.1. First step: Industry relatedness score ... 81
4.3.1.2. Second step: Firm-level measure of complexity ... 82
4.3.2. Empirical models... 83 4.3.3. Sample construction ... 83 4.4. Results ... 85 4.4.1. Methodology results ... 85 4.4.2. Univariate statistics ... 88 4.4.3. Regression analysis ... 91 4.4.3.1. Analyst coverage ... 91
4.4.3.2. Analyst forecast accuracy ... 92
4.4.3.3. Analyst forecast dispersion ... 94
4.5. Summary ... 96
Conclusion ... 98
Bibliography ... 104
Appendix A : Variable definitions ... 111
Appendix B: Excerpt of the GICS structure ... 116
Appendix C: Calculation of DIFF for the fiscal year 2006 for the industry GICS 251010 “Auto Components” ... 118
Appendix D: Calculation of CPX for Johnson & Johnson (gvkey=006266) and BASF (gvkey=017436) for 2014 ... 121
Liste des figures, tableaux, illustrations
Figure 2.1: Distribution of the industry GICS 201060 “Machinery” across SIC2 industries
for the year 2015 ... 25
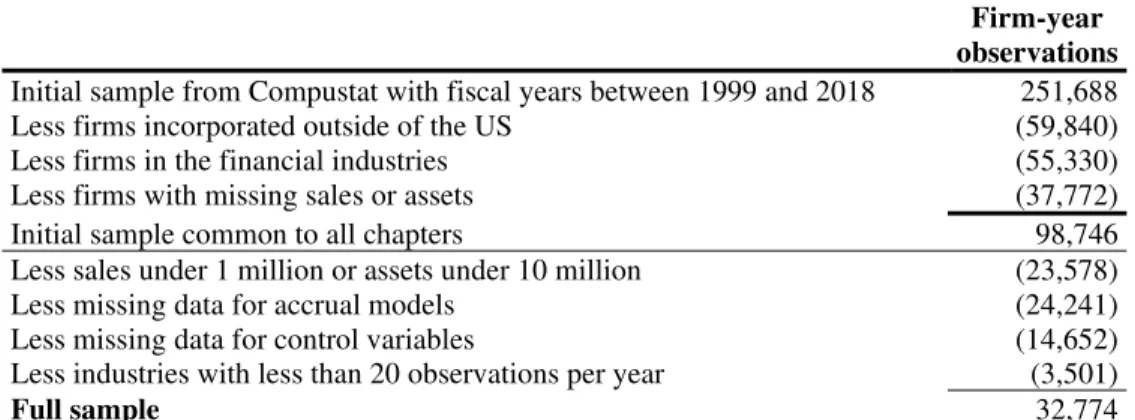
TABLE 2.1: Sample selection ... 30
TABLE 2.2: Industry statistics ... 31
TABLE 2.3: Univariate analysis ... 33
TABLE 2.4: Industry misfits and absolute abnormal accruals ... 36
TABLE 2.5: Industry misfits, accruals and the prediction of misstatements ... 38
TABLE 2.6: Industry misfits and return comovement ... 43
TABLE 2.7: Other accrual models ... 45
TABLE 2.8: Alternative misfit definitions and absolute abnormal accruals ... 47
TABLE 2.9: Matched sample ... 48
TABLE 3.1: Sample selection ... 64
TABLE 3.2: Descriptive statistics ... 65
TABLE 3.3: Industry characteristics: Frequencies of significant coefficients in industry-year regressions ... 68
TABLE 3.4: Industry news incorporation ... 71
TABLE 3.5: Analyst tests ... 72
TABLE 3.6: Information asymmetry test ... 74
TABLE 4.1: Sample selection ... 84
TABLE 4.2: Industry relatedness score ... 86
TABLE 4.3: Descriptive statistics ... 89
TABLE 4.4: Univariate correlations ... 90
TABLE 4.5: Analyst coverage ... 91
TABLE 4.6: Analyst forecast accuracy ... 93
Liste des abréviations, sigles, acronymes
Abbreviations1 Meanings in this thesis
CRSP The Center for Research in Security Prices FASB Financial Accounting Standards Board
FF Fama-French
FTSE Financial Times Stock Exchange GICS Global Industry Classification Scheme IFRS International Financial Reporting Standards MSCI Morgan Stanley Capital International
NAICS North American Industry Classification System NYSE New York Stock Exchange
OMB Office of Management and Budget S&P Standard and Poors
SEC Securities and Exchange Commission
SFAS Statement of Financial Accounting Standards SIC Standard Industrial Classification
Remerciements
Ceux qui me connaissent savent à quel point ma pudeur sentimentale est un trait de caractère que je développe quotidiennement, au grand dam des êtres qui me sont chers. Comme vous le remarquerez dans les paragraphes suivants, ce n’est pas (toujours) de la mauvaise volonté. Bien souvent, si je n’exprime pas mes sentiments, c’est simplement parce que je ne suis pas doué pour le faire. Cependant, il me semble que cette thèse marque la fin d’un chapitre important de ma vie (une scolarité de 30 années, ça se célèbre!). Il me parait quand même indispensable de remercier les personnes qui ont contribué à rendre ce doctorat plus agréable. En voici la liste non exhaustive :
- Carl : je n’aurais pu rêver meilleure relation avec mon directeur de thèse. Tu as toujours su trouver les bonnes réponses à mes questions, me soutenir dans les moments compliqués et trouver les bons mots lorsque ma motivation était en berne. Tu as été indéniablement la clé de la réussite dans ce doctorat.
- Daniel : j’ai découvert la recherche grâce à toi, pendant l’été 2013. En quelque sorte, tu m’as donné le virus de la recherche à ce moment-là, et je t’en serais indéfiniment reconnaissant. Tout au long de ma maitrise et mon doctorat, tu auras été un soutien (moral, académique et financier) clé.
- Jean, Alain : vous avoir sur mon comité de thèse est un immense privilège. Votre rigueur (et dureté parfois!) m’a poussé à me dépasser chaque jour. Mon travail a indéniablement bénéficié de votre bienveillance.
- Maryse : tu auras été en quelque sorte ma « grande sœur académique » tout au long de ce doctorat. Ta rigueur (académique!) m’impressionnera toujours. Pour toujours je me souviendrais de nos échanges, nos questions existentielles, et surtout nos « chialages » communs. Je ne te remercierai jamais assez pour tous les conseils que tu m’as pu me donner tout au long de ce doctorat : sans toi, je n’aurais jamais visité tous ces parcs naturels, campings et autres randonnées. Si un jour tu cherches une (re-)reconversion, je saurais déjà où te trouver!
- À mes collègues et amis de la faculté : Janie, Louis-Philippe, Jérôme, Éliane, Michelle, Marion, Maude, Romain, Isabelle, Stéphanie Julie, Myriam ; à travers les bières partagées, les discussions de couloirs ou de bureau, tous les conseils et discussions informelles qui ont rythmé mes journées à la FSA ont permis mon épanouissement quotidien ; continuez à être les bonnes personnes que vous êtes! - À famille : mes parents, Océane, Jérôme, Orlane, Tom, Léo, Johanna ; votre soutien
m’a transmis une force immense. Le soutien indéfectible accordé tout au long de mes (longues) années d’études aura été la clé de ma réussite. La confiance que vous m’avez toujours accordée m’a permis de traverser les épreuves et embuches qui se sont dressées sur mon chemin. Probablement sans le savoir, vous avez été ma source d’inspiration. L’envie de réussir et de vous rendre fiers de moi m’aura poussé à ne jamais abandonner, même dans les moments les plus compliqués.
Introduction
Financial accounting is a discipline of accounting that relies in part on the existence of accounting norms (standards) issued by standard setters. These “norms” (articulated rules) often arise from accounting practices (implied rules) and exist in order to harmonize them (Zarzeski 1996). In other words, they exist to create a uniform framework through which companies report their financial activities, in order to allow users to reduce the cost of processing financial information. However, this harmonization process is risky because it can also make firms look more (economically) similar to each other than they truly are. By extension, groups of firms could then be perceived as
homogeneous while users of financial statements may prefer financial statements that properly
highlight sources of heterogeneity, because those may be more useful in providing firm-specific information. Therefore, when issuing standards, regulatory bodies must always deal with the trade off between giving more space to allow financial statement preparers to provide discretionary –
heterogenous – information and constraining this space to obtain uniform – homogeneous –
information. This process is complicated by the possibility that stakeholders may have different preferences regarding financial information (e.g. Demski 1973).
In this context, users generally interpret a firm’s financial information by comparing it with a group of firms whose economic activities are assumed to be similar (i.e. peer firms or comparable firms). To ensure objectivity in peer selection, users typically rely on existing industry classification schemes, in which a group is considered homogeneous if all of its firms are in the same industry, and heterogenous if they are not. The whole objective of my thesis is to study the use of industry classifications in financial accounting. I aim to identify sources of industry heterogeneity and to study its consequences for a multiplicity of stakeholders (investors, financial analysts, or researchers).
The use of industry classifications to select peers has a long tradition in financial accounting. Three main classifications are used by both practitioners and researchers: the Standard Industrial Classification (SIC), the North American Industry Classification System (NAICS) and the Global Industry Classification Standard (GICS). The SIC was first issued in 1937 by the Central Statistical Board of the United States and remains used by the Securities and Exchange Commission (SEC) in 2020. The NAICS was initially issued in the US to replace the SIC in 1997 in every
governmental body2, while the GICS has been issued by a private organization (MSCI and S&P)
in 1999. These three classifications are based on a hierarchical structure from broader industries at the higher level to narrow sectors at the bottom. For example, the GICS classification structure uses four levels: the broadest (narrowest) level is referred to as GICS2 (GICS8), where 2 (8) represents the number of numerical digits used to index industries at that level (see Appendix B for an excerpt of the GICS hierarchical structure within two GICS2 industries). Industry classifications have the advantage to offer an objective way to classify firms into homogeneous peer groups. Moreover, they are commonly available in all major public databases (Bloomberg, Compustat, CRSP, etc.) which make their use relatively easy. More precisely, for researchers it enhances the generalization and the replicability of their research. Finally, despite recent challenges from researchers (e.g. Hoberg and Phillips, 2016 ; Lee et al., 2015), the frequent issuance of new classifications by private organizations (e.g. the Industry Classification Benchmark by the FTSE, the Dow Jones Industry Classification System) shows how industry classifications still occupy a central role in the organization of financial markets. The main criticism toward industry classifications is the lack of flexibility toward the constitution of peer groups (Ecker et al. 2013; Hoberg and Phillips 2016). It could result in the creation of
heterogeneous peer groups which is the opposite of their objective. In my thesis, I aim to
investigate how we can adapt and use industry classifications to achieve a better intra-industry homogeneity. Moreover, evidence regarding the consequences of peer groups heterogeneity is relatively scarce. Consequently, the second objective of my thesis is to investigate the implications of heterogeneous firms for financial statement users.
Homogeneity plays a central role in my thesis, even though it is a concept that is hard to distinguish from comparability, which is fundamental to the financial accounting conceptual framework (FASB 1980). Firms reporting under the same set of accounting norms should have comparable financial statements, where comparability is different from uniformity (2018 IFRS Conceptual framework, 2.27). Consequently, two firms experiencing two different economic events should possess comparable financial reports, but not similar ones, enabling financial statements users to compare their disclosures (i.e. earnings, cash flows, accruals, etc.) to make predictions. Since we 2 The NAICS project was also initiated to uniformize industry classifications with other countries in North America
(Canada and Mexico). In the end, the NAICS did replace the SIC in most of the US governmental bodies, except for the SEC.
typically use cross-section comparisons in fundamental analysis to evaluate firms’ performance, comparability is a highly desired attribute to financial statements in every context.
I define homogeneity as a broader concept that includes comparability. I define homogeneity as a multidimensional and contextual construct that aims to form groups of firms that can be analyzed simultaneously. I posit that homogeneity should be seen as a multidimensional and continuous construct. I argue that economic forces (e.g. strategy, industry competition) pushes firms to become heterogeneous to their peers. I posit that when solely using one industry classification as a peer selection method, we miss the point and do not use all the information available to form the
best homogeneous group of firms, a significant issue given the known empirical biases of
inferences drawn from heterogeneous data (e.g. Owens, Wu and Zimmerman 2017). In other words, we typically create groups of firms containing both comparable firms and heterogeneous
firms. However, the identification of heterogeneous firms may be challenging because firms may
or may not explicitly disclose these sources of heterogeneity in financial statements. Consequently, the first objective of my thesis is to empirically identify heterogeneous firms.
I posit that industry classifications and financial statements form publicly available information that could be used to identify heterogeneity and avoid mixing up comparable firms and
heterogeneous firms within a given industry. Despite being subject to many horse races, it is still
an open debate to determine which classification is better suited for accounting (Bhojraj et al. 2003; Hrazdil and Scott 2013) or whether industry classifications are relevant to form peer groups (Lee et al. 2015; Hoberg and Phillips 2016; Ding et al. 2019). Ultimately, I provide a multidimensional view of intra-industry heterogeneity that relies on sources of heterogeneity at both the classification and the firm level. To do so, I develop three research designs that enable to identify different types of heterogeneous firms: industry classification misfits, differentiated firms, and complex conglomerates.
First, by their construction, industry classifications impose the transitivity between firms for peer selection (Hoberg and Phillips 2016). For example, one could argue that firm A might be a competitor of firm B, while firm C is a competitor of firm B but not of firm A. Using industry classifications does not enable this and imposes transitivity. Firms A, B and C will be automatically classified as competitors to each other. Thus, industry classifications impose boundaries to
categorize firms in solely one industry which can potentially increase heterogeneity. Moreover, the construction of classifications imposes an equally weighted relationship between firms– firm A is as much a competitor for firm B than for firm C. Thus, using industry classifications to select peers provides a binary measure of homogeneity – firm A is (or not) a peer of firm X – rather than a continuous one.
Few studies recognize the existence of intra-industry heterogeneity of industry classifications and its consequences. However, they only expose theoretically the effect of intra-industry heterogeneity (Lee et al. 2015; Hoberg and Phillips 2016) or limit their empirics to a specific context (Peterson et al. 2015; Owens et al. 2017; Ding et al. 2019). In my thesis, I aim to provide more evidence regarding the implications of intra-industry heterogeneity for financial markets. Then, for each type of heterogeneous firms, I choose three different settings to test their implications for both researchers and practitioners. For each source of heterogeneity, I choose a context where the relationship between intra-industry heterogeneity and its consequences is the most straightforward3.In this thesis, I review prior literature on peer selection methods and
intra-industry homogeneity (chapter 1), and then I create three new methods to identify heterogenous firms and illustrate their effects in various settings that are common in accounting research (chapters 2 to 4).
In chapter 2, I investigate how multiple industry classifications can be treated as complements rather than substitutes4. I posit that information is lost when a single classification scheme is used
to identify peers because each scheme is based on different business dimensions. For example, GICS is based on a firm's ultimate markets (e.g. consumer discretionary), while SIC is based on the production technology (e.g. manufacturing). I use the frequency of listed firms in every possible GICS-SIC combination to distinguish between clusters of industry core firms and firms in more unusual combinations that I call industry classification misfits.
3 The main idea behind this choice is to have a setting where the results are less likely to be contaminated by correlated
phenomena and to try to rule out as many alternative hypotheses as possible for my results. This is particularly important as two of my chapters (chapter 3 and 4) create proxies based on fundamental ratios which makes it risky to apply them in some contexts (e.g. accrual models).
4 This is typically what is done when trying to identify which one performs better (see for example Bhojraj et al., 2003
First, I test the implications of industry classification misfits for accruals model and misstatements predictions. Industry classification misfits represent firms that share uncertainty regarding their industry membership. Industry peer groups are required for accrual models in order to provide homogeneous groups of firms sharing the same accruals generating patterns. The objective of accrual models is to identify firms that deviates cross-sectionally from their peers to determine whether their earnings are managed. I use this context because the relationship between intra-industry heterogeneity – as proxied by intra-industry classification misfits – and accrual models is direct. Intra-industry homogeneity is an implicit assumption of accrual models, and in this context, I argue that a high uncertainty regarding the industry membership of firms should result in a high uncertainty regarding their (supposedly) shared accruals generating patterns. Thus, industry
classification misfits have a high probability of possessing a different accrual generating pattern
from their industry peers. Ultimately, the outcome of accrual models (i.e. abnormal accruals) is supposedly highly correlated with misstatements. Thus, I test the implications of industry classification misfits for the estimation of accrual models and the use of their outcome to predict misstatements.
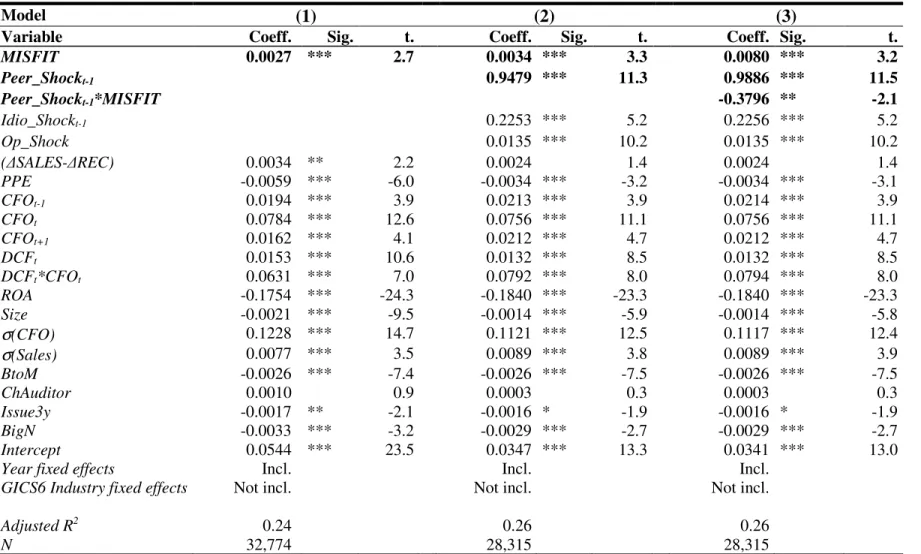
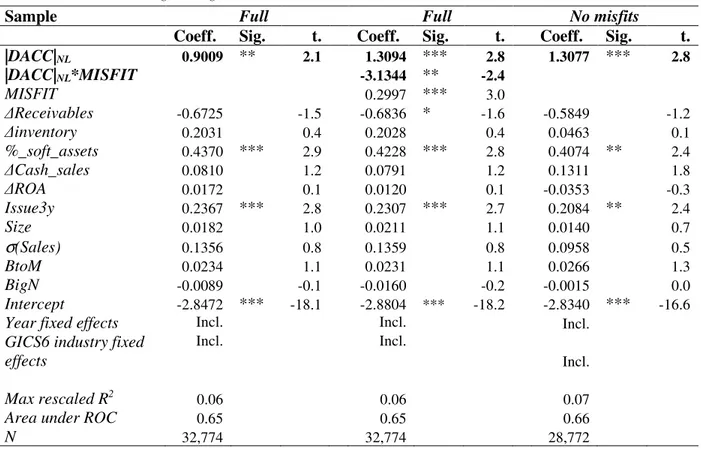
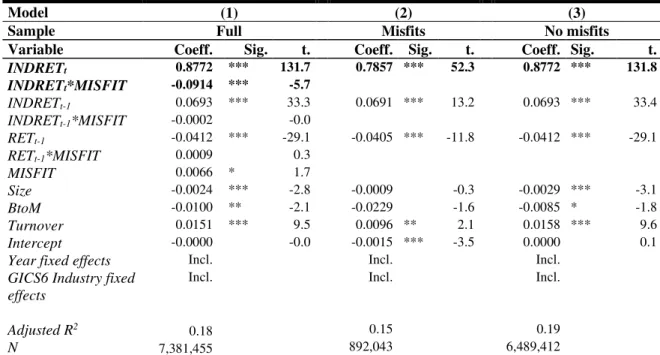
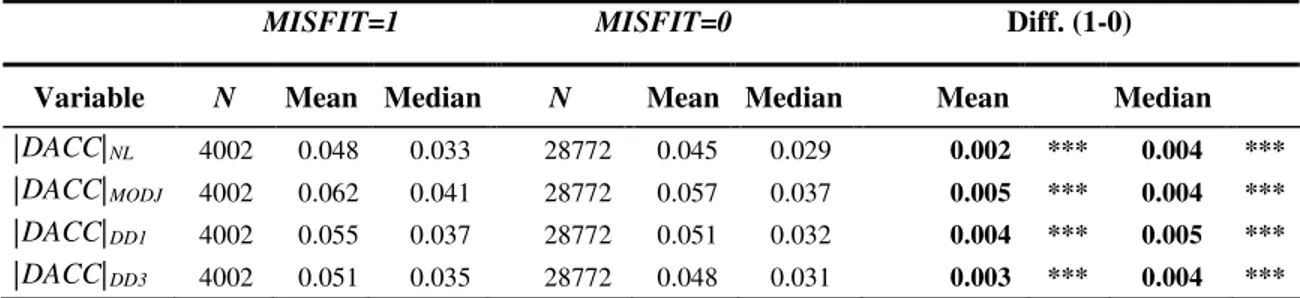
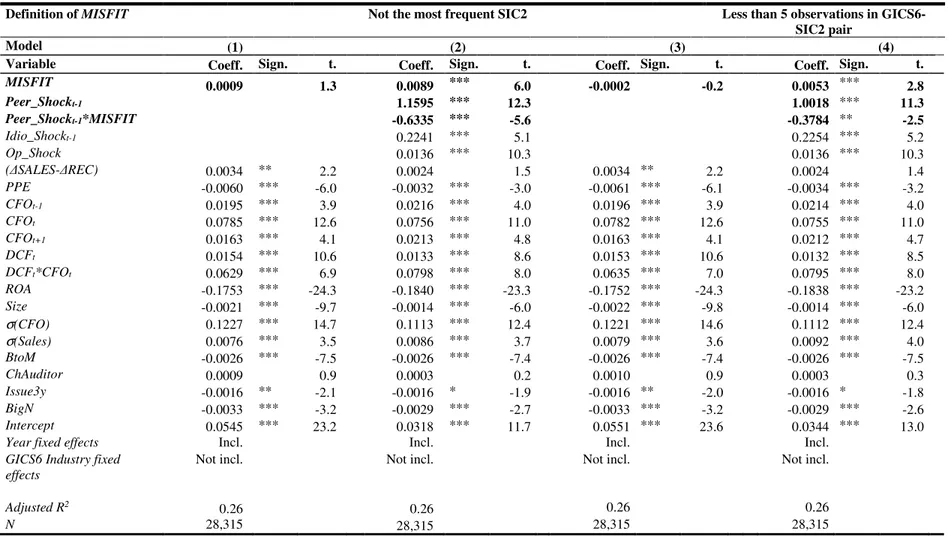
My results show that industry classification misfits have significantly larger absolute abnormal accruals than industry core firms, after controlling for an array of firm characteristics such as size, the book-to-market ratio and the volatility of operating cash flows. This result is consistent with the argument that industry-based accrual prediction models offer a poor fit for industry misfits, and the resulting measurement error yields inflated estimates of absolute abnormal accruals. In addition, I show that abnormal accrual estimates for misfits are less contaminated by shocks experienced by other firms in the peer group (Owens et al. 2017) than estimates for core firms. I also find that absolute abnormal accruals are positively associated with future restatements for core firms but not for misfit firms, which suggests that the measurement error for misfits impairs the usefulness of absolute abnormal accruals as a proxy for financial reporting quality. Finally, I show that misfits’ stock prices are less affected by industry-wide news than core firms, which indicates that market participants seem to identify misfits to some extent.
In chapter 3, I exploit a source of heterogeneity at the firm-level arguing that firms have incentives to voluntarily become heterogeneous to their industry peers in competitive markets. This is usually achieved to obtain a competitive advantage over their competitors and to survive through years. In
addition, industry competition can drive firms out of the market and make them appear dissimilar from their peer group, against their will. In this chapter, I develop a continuous measure of intra-industry heterogeneity to identify differentiated firms (i.e. firms that are heterogeneous to their industry peers5). This measure stems from a three-step methodology. For each industry-year I draw
a multidimensional spatial representation of all the firms in the industry where the dimensions are industry-specific fundamental ratios. First, I empirically determine the dimensions that are relevant for each GICS6 industry-year. This step will provide a list of fundamental ratios that characterize each year. I refer to these ratios as “industry characteristics”. Then, for each industry-year I set a centroid that represents the prototype firm of the industry. In the spatial representation of the industry, the prototype firm has the means of the industry-specific ratios (the “industry characteristics”) as coordinates. Thus, each industry-year has its own number and set of dimensions to characterize the intra-industry heterogeneity. In the third and final step, I calculate the Euclidean distance between the prototype firm and each firm from the industry. I argue that firms farther (closer) from the industry centroid are differentiated firms (industry core firms). In this chapter, I test the implications of differentiation for financial statement users. I argue that differentiated firms should experience more information processing costs due to their lack of benchmarks. First, I examine how differentiated firms incorporate industry news. I argue that differentiated firms represent a type of complicated firms where the industry component of news is more difficult to incorporate in their prices than for core industry firms (Cohen and Lou 2012). Using daily returns, empirical results show that the association between industry news and firm-specific stock returns is smaller for differentiated firms than for industry core firms. In addition, compared to core industry firms, the association between returns and contemporaneous industry news is lower for differentiated firms, but the association between returns and lagged industry news is higher for differentiated firms. I interpret these results as evidence that investors incorporate industry news in a less timely manner for differentiated firms, due to higher information processing costs. Then, I focus on financial analysts. Previous literature highlights the importance of industry specialization for analysts in order to benefit from economies of scale (Piotroski and Roulstone 2004; Kadan et al. 2012). Since differentiated firms represent firms that 5 Contrary to chapter 2 where the heterogeneity could come from a misclassification of the misfit firms, here I take a
different approach. I argue that differentiated firms may be very similar to their industry peers in terms of products (or type of business they pursue more generally) despite being heterogeneous to their industry.
are heterogeneous to their industry peers, I argue that providing forecasts for these firms will be costlier for analysts. Thus, I hypothesize that differentiated firms receive less coverage from analysts. Moreover, I predict that forecasting these firms will be harder due to their lack of benchmarks, resulting in less accurate and more disperse forecasts. Results from empirical tests support these hypotheses. Finally, I show how differentiation increases the information asymmetry on the stock market. Firms benefit from their peer information environment in order to help investors to process information disclosed (Peterson et al. 2015; Shroff et al. 2017). Heterogeneity arising within peer groups leads to a greater information asymmetry. Using two different measures of information asymmetry – bid-ask spread and illiquidity (Amihud 2002) – I provide empirical evidence that differentiated firms experience a greater information asymmetry. Taken together, my results highlight the potentially adverse effects of differentiation on capital market participants. Finally, in chapter 4, I focus on a natural source of intra-industry heterogeneity: conglomerates. Conglomerates are firms owning several business units from different industries. However, through industry classifications these firms are classified in only one industry according to their core business (i.e. the most important business units in terms of sales). Thus, one could argue that all the other secondary business units of the conglomerates represent a source of heterogeneity. Many studies build on this argument and use the number of business units as a natural proxy to measure the operational complexity of multi-segment firms (Hoitash and Hoitash 2018). In this context, operational complexity represents a specific form of heterogeneity. In other words, they consider that, no matter the industry membership of the secondary business units, they always represent a source of heterogeneity. In this chapter, I take a different approach and do not consider all additional segments as heterogeneous. I develop a measure of industry relatedness to assess the incremental complexity of conglomerates’ secondary business units. I differentiate between business segments that add complexity to the conglomerates (i.e. heterogeneity to the peer group) and the ones that are more closely related to their core business (i.e. more homogeneous to their peer group). Overall, in this chapter I study the homogeneity both at the firm-level (i.e. whether conglomerates are homogenous to single-segment firms), and at the industry-level (i.e. how industries are homogeneous to each other).
Then, I focus on a particular group of financial statement users (i.e. financial analysts) to test my measure of complexity. Financial analysts have the reputation of being sophisticated participants
that have the technical skills to understand complex information. Also, previous literature highlights that analysts specialize in industries in order to issue better forecasts (Boni and Womack, 2006 ; Bradley et al., 2017 ; Clement, 1999 ; Kadan et al., 2012). Since complex firms represent companies having business units less related to their primary business in which the analyst is a specialist, I argue that analysts will face higher information processing costs for these firms. Therefore, I hypothesize that complex firms will experience higher (lower) analyst forecast dispersion (accuracy). Results confirm that analysts' forecasts are more dispersed for complex conglomerates. I provide an analysis regarding the analyst coverage of complex conglomerates. Results confirm that analysts do account for the number of business segments since they are less willing to cover multiple-segment firms. However, I show that analysts fail to recognize when multiple-segment firms are composed of complex business segments. Finally, I document a negative association between analysts' forecast accuracy and complexity, suggesting that complex conglomerates earnings are more difficult to predict for financial analysts. However, the effect disappears when the number of business segments is added as a control variable.
The rest of this thesis is organized as follows. First, in chapter 1 I present a literature review on peer-selection methods and intra-industry homogeneity. Then, in chapter 2, 3 and 4 I present the results regarding industry classification misfits, differentiated firms and complex conglomerates respectively. Finally, I draw some concluding remarks in the closing section.
1. Literature review on peer selection methods and
intra-industry homogeneity
1.1. Industry classifications
1.1.1. Definition, structure and preliminary evidence
Initially, the first studies to investigate the importance of industries were trying to distinguish between the idiosyncratic and industry components of firms’ profitability (Schmalensee 1985). In his study, Schmalensee proposes a simple regression model where the dependent variable is the profitability (return on assets) of a company. The independent variables tested are companies and industries fixed effects and a control for firms’ market share in its industry. By comparing the different R² regressions and F-Tests, the author shows that what matters most are the industry fixed effects. This allows him to claim that “industry effects exist and are important, accounting for at least 75 percent of the variance of industry rates of return on assets”. Thus, these fixed effects clearly dominate firm fixed effects and firms’ market share, indicating that industries have a great explanatory power for the profitability of a business. Additionally, the author was able to show that there are strong inter-industry differences in the profitability of firms. Ultimately, he shows that grouping firms by industry seems a good way to obtain homogeneous groups in terms of profitability.
Until the end of the 1990’s, the SIC is dominating the market of industry classifications. It is the only widely available classification despite evidence that it does not seem to provide homogeneous peer groups (Clarke 1989). In his study, Clarke investigates whether the SIC can be used to delineate “economic markets” using three economic variables: sales change, profit rates and stock
price changes. His results highlight that the 1 or 2-digits SIC is useful to create homogeneous
groups of firms. However, the 3 and 4-digits SIC - which is narrower - does not seem to increase the homogeneity of the peer groups, compared to the higher level of this classification (SIC1 or SIC2). Therefore, the author concludes that “the SIC does poorly at delineating economics markets”. This result deserves to be nuanced since the study only covers the SIC 1000 to 3999 industries which limit its generalization to other industries. Also, in empirical studies (e.g. accrual models) the 2-digit SIC is often chosen since it presents an adequate number of firms to alleviate concerns regarding the lack of degrees of freedom. This study shows that the SIC seems capable of forming homogeneous groups of firms at this level of the classification. However, it does not
question the use of the SIC2, but it shows that the SIC as a whole is subject to improvement. Another problem directly related to the SIC is that databases reclassify each firm on criteria specific to their classification methodology. So, a firm can be classified in two different SIC industries according to which database is selected. For example, 38% of firms are classified differently depending on the use of CRSP or Compustat (Guenther and Rosman 1994). It might be an issue from a research standpoint since researchers usually do not disclose the source of the SIC code used (Kahle and Walkling 1996). Kahle and Walking explain that this difference exists because Compustat did not provide historical SIC codes unlike CRSP6. However, they show that
there is still a large disagreement between the two databases even when using historical codes for both. Using a methodology based on simulations, they show that the differences between the two databases can impact on the results. Ultimately, they show the superiority of the Compustat database over the CRSP for the data on SIC codes.
New evidence adds to the criticism toward the use of the SIC and points out that this classification does not adapt to the creation of new product markets (Hoberg and Phillips 2016). Thus, direct alternatives to the SIC have been issued. These emanated both from organizations currently proposing the SIC classification (or advocating its use), from private organizations, or from academic research. So, to consider the evolution of the economy and changes in the structure of industries, in 1997, The US Office of Management and Budget (OMB) created the NAICS intended to replace the SIC in all government bodies. Like the SIC, the NAICS rely on firms’ products and supply chains to classify them. This could be problematic, since two firms sharing the same products and supply chains might not be homogeneous from an accounting perspective. Therefore, the GICS was created by Morgan Stanley Capital International (MSCI) and Standards & Poors (S&P). This new classification takes a financial approach to form homogeneous groups that are based on market perceptions (analysts, investors) and firms’ sources of earnings. Thus, it is more in line with financial logic rather than an industrial economics logic (based on products and outputs). Unsurprisingly, the GICS is widely used by researchers in the financial analysts’ literature or more generally in finance. Studies have shown that this classification is representative of analysts’ choices for the selection of peers (Boni and Womack 2006; Kadan et al. 2012). More precisely, according to these authors, most companies followed by an analyst belongs to the same 6 Compustat later added historical SIC codes to the database for most firms, beginning with the 1987 fiscal year.
GICS6 industry. This confirms that the GICS seems to correspond well to financial analysts’ realities. Conversely, analysts’ peer selection appears to be uncorrelated with the SIC industry membership of firms (Ramnath 2002).
Finally, asset pricing research focused on the impact of industries for the Fama-French 3-factor model (Fama and French 1997). The authors find industry cross-sectional variations in the risk factors. Criticism of the SIC classification is implicit in their study, since they only indicate presenting a new way of classifying firms for: “having a manageable number of distinct industries that cover all NYSE, AMEX and NASDAQ stocks” (p. 156). So, these new industries are a reformulation of the classification where 4-digit SIC codes are reorganized to create new industries.7
In the same way that studies analyze the relevance of the SIC (Kahle and Walkling 1996; Clarke 1989; Guenther and Rosman 1994) researchers have been interested in these new classifications in order to assess their differences and establish a hierarchy. For example, the NAICS seems very useful for accounting research (Krishnan and Press 2003). Krishnan and Press show that differences between the SIC2 and NAICS3 – the level of these classifications commonly used – are very minimal since only the industries “Services” and “Public administration” represent new industries in the NAICS. This confirms that the NAICS has been introduced to provide an update of the SIC more representative of the changing economy. In their study they use accounting ratios to assess the ability of this classification to create homogeneous groups of firms. They analyze four ratios: profitability (return on assets), liquidity (current ratio), solvency (long-term debt / assets) and asset turnover. The variance of these ratios is estimated for each industry of both the NAICS and SIC. Finally, they compare the mean variance of each classification in order to determine which one achieves the best intra-industry homogeneity. Their analysis shows the ability of the NAICS to increase the intra-industry homogeneity for certain industries (manufacturing, transportation, and services). Also, the NAICS has a real impact on the lower level of classification – levels comparable to the SIC3 or SIC4 – which was a concerned before (Clarke 1989). Finally,
7 The most commonly used classification contains 49 industries, usually referred as FF49. Other narrower and broader
reclassifications are available on Kenneth French’s website (
http://mba.tuck.dartmouth.edu/pages/faculty/ken.french/data_library.html). However, they are less exploited because they classify a significant portion of firms into the “uncategorized” industry group. This limits their usefulness.
the authors replicate a previous study. They show that the choice of a classification over another can have an impact on research results.
The emergence of the NAICS and GICS opens up new possibilities for studies using industries to form homogeneous groups of firms. Despite sharing the same objective, they do not seem to be equivalent and some give better results than others where the GICS seems to be the most homogeneous one and is favored in capital market research (Bhojraj et al. 2003; hereafter BLO). In their study, BLO are the first to be interested in industry classifications beyond the SIC and NAICS, integrating the GICS classification and the classification from Fama and French (FF). They are making contributions to both finance and accounting literature since they are evaluating the impact of the choice of a classification for asset pricing and financial analysis. In the same way as Krishnan and Press (2003) are interested in the convergences between the SIC and NAICS, BLO study the concordance between the classifications in a broader way since they take into account four classifications (SIC, GICS, NAICS, FF). In their results (Table 2), they show that the NAICS and FF are very close to the SIC, while the GICS seems less related. For example, only 34% of the firms belonging to the SIC36 industry “Electronic And Other Electrical Equipment And Components, Except Computer Equipment” are classified into the same GICS industry (GICS 452020 “Technology Hardware, Storage & Peripherals”). This means that according to the GICS, 66% of the firms of the SIC36 industry are not classified with the right peer group, resulting in a potential increase in intra-industry heterogeneity. In the end, they show that the degree of correspondence between the SIC and the GICS, NAICS and FF is 56%, 80% and 84%, respectively. For the NAICS and FF, the high degree of correspondence is not surprising since they are built on the same foundations. On the other hand, the result regarding the GICS is more appealing. Even if they rely on different criteria to classify firms, we do not expect such a low degree of correspondence between the classifications. This suggests that despite having the same objective (i.e. form homogeneous peer groups), they do so on different dimensions. Finally, in the rest of their study BLO show that the GICS seems to better explain industry cross-sectional returns, valuation multiples (price-to-book ratio, enterprise value-to-sales, price-to-earnings ratio), financial accounting ratios (return on net operating assets, return on equity, asset turnover, profit margin) and other financial ratios (long-term analyst growth forecasts, one-year ahead realized sales growth). BLO concludes that the GICS is the most homogeneous industry classification and should be used in accounting or finance to select peers. This superiority is mainly explained by the
financial orientation taken by this classification to delimit the industries, while the other classifications are more “product” oriented. Nevertheless, through the interpretation of their results, they assume that the classifications are substitutes for each other. They claim that it is possible to prioritize one classification over the others in any context by choosing the “best” industry classification – the one that offers the best intra-industry homogeneity. However, this assumption is debatable given the foundations on which each of the classifications are based. Even if the GICS provides the best intra-industry homogeneity overall, we note that it is not the case for every dimensions of heterogeneity (leverage for example). Thus, using the GICS might not be the best possible choice in every context. In the same way that there can be several dimensions to “good governance” (Larcker et al. 2007) or to “earnings quality” (Dechow et al. 2010), I think that intra-industry heterogeneity can also articulate around a multi-dimensionality of its proxies given that each of the industry classification was built to meet specific needs and relies on different assumptions.
1.1.2. Improvements of intra-industry homogeneity using accounting information
Researchers propose ways to alleviate concerns regarding the intra-industry heterogeneity of industry classifications using accounting information. For example, the operational cost structure of firms can be used to form homogeneous groups of firms for auditors (Cairney and Young 2006). In this context, the authors are trying to identify homogeneous industries from an auditor standpoint. They argue that the most homogeneous industries are the one where firms share the greatest correlation on their operational cost structure. Ultimately, they want to show that auditors benefit from greater economies of scale when auditing multiple firms belonging to the same
homogeneous industries, resulting in a higher market concentration of audits. They present their
peer selection method as a way of forming economically homogeneous groups of firms since : “the
rates of change in the operating expenses of homogeneous firms are similar and reflect the underlying similarity of operations because concurrent economic conditions have resulted in a similar reported financial impact on these companies”. In other words, they implicitly claim that
their methodology could be used to form peer groups that are economically homogeneous (i.e. homogeneous in every context). Using these approach to peer selection could be problematic since it represents only one dimension of homogeneity that is subject to limitations. For example, firms could experience changes in their cost structure due to organizational or strategic issues inside the
company (Owens et al. 2017). This would make them appear dissimilar to their peers while they may operate on the same market. In addition, this methodology does not seem to suit the new economy (i.e. based on business services, technologies) and seems more adapted to the old manufacturing economy where the relationship between companies’ operations and their cost structure is more straightforward.
Studies looking at firms’ earnings response to economic news – as measured by stock returns – has a long tradition in accounting research (Basu 1997 ; Parrino 1997 ; De Franco et al. 2011). Industries that exhibit a high correlation on their firms’ stock returns are presented as the most
homogeneous ones (Parrino 1997). From an accounting standpoint, two firms are comparable if
their financial reporting system presents the same response to a given economic news (Basu 1997 ; De Franco et al. 2011 ; hereafter “DKV”). In their study, DKV propose a new measure of intra-industry heterogeneity based on their definition of comparability. They assume that economic news impact earnings in a timely manner which is consistent with Basu (1997) for negative news but it seems very unlikely for positive news since the latter usually proxy for earnings surprises or future economic performance. Also, industry news could be integrated differently into firms’ financial reporting systems for many reasons. For example, two firms could experience a similar response in their earnings to two independent economic news, which will make them appear comparable even if the two economic news are unrelated. Also, these two events could have different implications for these firms’ earnings resulting in an increase in intra-industry homogeneity since these firms will not be considered comparable. More generally, using the firm news – stock returns – as a determinant of firms’ earnings in order to form homogeneous group of firms seems risky. It looks hard to isolate clean settings of news where the comparability of firms could be properly assessed. Thus, the relationship between stock markets and financial reporting systems looks too complicated to be directly used to measure the intra-industry homogeneity. Despite being subject to discussions, the comparability measure proposed by DKV opens lots of avenues for research. While DKV present the output-based (i.e. based on earnings) methodology used as a strength of their study, others regard this as weakness and seek alternatives (Peterson et al. 2015). Peterson et al. (2015) present an input-based proxy for comparability relying on firms’ 10-K disclosures. They use textual analysis to measure firms’ accounting consistency based on firms’ accounting policy disclosure similarities. More interestingly, they also propose a new
measure of comparability based on the textual analysis of firms’ business descriptions. For both
consistency and comparability, they provide a cross-sectional and time-series construct. Even if
their primary objective is to extend previous work by DKV, they achieve a different goal and provide evidence regarding another dimension of heterogeneity through their comparability measure. While the study of DKV build on the integration of economic news by financial reporting systems, Peterson et al. (2015) contribute to the literature through a focus on the firms’ textual disclosures.
Companies’ size plays a role in explaining their performances and other outcomes. Most of the empirical studies include companies’ size as a control for firm operational complexity at the firm-level (e.g. Dechow and You (2012)). Thus, size appears as a natural criteria to form homogeneous groups of firms (Albuquerque 2009; Ecker et al. 2013). In the context of accruals, the formation of peer groups based solely on firms’ size seems to perform better than industry classifications (Ecker et al. 2013). For these authors, size looks to be a better criterion to select peers than industry membership: “We consider size because, as we explain in more detail later, it is an intuitively
grounded alternative (to industry membership) indicators of similarity; that is, a group of larger firms is more alike than is a mixed group of larger and smaller firms” (p. 191). They give three
main arguments for the use of size as a unique dimension to form homogeneous groups. First, firms of similar size should experience the same growth rates where the largest firms are those with a lower growth compared to smaller firms. In addition, they argue that the largest firms are also those having the most complex operations (i.e. they likely have more business units) or are the most monitored (higher coverage from analysts, audited by a big 4, presence of institutional investors). Thus, firms of similar size share common characteristics which lead authors to assume that they should share the same accrual-generating pattern. Using simulations, the authors test the ability of accruals models to detect earnings management across various peer selection methods. Peer groups based on the previous year’s total assets (lagged total assets) are those that provide the highest detection rate of earnings management. Conversely, groups based on total assets for the current year do not provide satisfactory results. This is appealing since the two variables used to form peer groups (i.e. lagged total assets and total assets) theoretically represent a similar economic concept (i.e. companies’ size). This means that the relationship between the model estimated and the peer groups formed is more complicated than what is exposed. Overall, it
questions whether the use of size as the unique dimension to form economically homogeneous groups of firms is adequate.
Albuquerque (2009) takes a different approach to account for companies’ size. In her study, size is used as a secondary criterion to determine peer firms within SIC industries. By adding this variable, the author provides a refinement of intra-industry homogeneity through industry classifications. Hence, it considers the intra-industry heterogeneity existing within the SIC2 and SIC3 industries and provide a way to control for it. The use of the size variable seems more appropriate in this context, as it is not used as a substitute for the use of industry classifications. However, this can create problems in estimating empirical models. The addition of a second criterion decreases the number of observations in peer groups which raise concerns regarding the (lack of) degree of freedoms.
Overall, the use of accounting information to increase the intra-industry homogeneity looks interesting at first sight. However, it could give rise to new potential issues. First, when using the accounting information as a substitute for industry classifications, it may offset the economic meaning of peer groups. For example, in Ecker et al. (2013) the authors show how this measure of homogeneity may be of interest in the context of accruals, but it seems dangerous to give it a broader meaning. Also, even if it provides homogeneous groups that allows a better detection of earnings management, the use of lagged total assets as a sole dimension to heterogeneity leads to a reduction in the explanatory power of accruals models, compared to the use of SIC industries. Consequently, the peer selection method proposed contains a limited economic meaning making its usefulness limited outside the context of their study (earnings management detection). Accounting information has generally been used to increase the intra-industry homogeneity in some specific contexts. Though, only one dimension of accounting information – one variable (e.g. size, operating expenses) or a broader concept (e.g. comparability) is provided. Recently, a study from Ding et al. (2019) provides a multi-dimensional approach to peer selection using machine-learning. They use a methodology based on k-medians clustering to constitute groups of homogeneous firms using financial ratios. They want to use their peer selection method to be able to better predict bankruptcy and misstatements. Thus, they choose financial ratios that are related to these topics. Again, despite being innovative through their multidimensional approach, their results are highly contextual. Their peer selection method is unlikely to provide homogeneous
groups firms outside the context of their study. Thus, it lowers its value and reduce its generalization power, although it opens avenues for future research.
1.2. Direct alternatives to industry classifications
Several studies address the weaknesses and limitations of industry classifications, but few direct alternatives have been proposed. The main criticism toward these classifications remains their lack of evolution over time and their rigid hierarchical structure (Hoberg and Phillips 2010; Hoberg and Phillips 2016). In their study Hoberg and Phillips (2010) propose a new peer selection method based on textual analysis. They use cosine similarity as a technique to analyze the business description from 10-K and to evaluate the product similarity between each pair of firms. They calculate a yearly measure of similarity for each pair of firms which give them a very dynamic peer selection method. Moreover, it provides a continuous measure of intra-industry homogeneity for every firm-year. Also, their structure is less rigid than industry classifications since it enables the creation of peer groups of any size. This could be useful for contexts where models are estimated by industry since sample size could be adjusted easily to the number of degrees of freedom required. Thus, it could be useful to accruals models where the use of industry classifications seem questionable (Ecker et al. 2013). Thus, their classification system is based on a scoring that allows the creation of industries of any size, or any minimum scores (i.e. minimum level of intra-industry homogeneity).
Due to its construction orientation, the GICS seems to be the classification that best represents the choices made by analysts for the selection of peer firms (Boni and Womack 2006; Kadan et al. 2012). Before the introduction of the GICS, Ramnath (2002) seeks to understand the spillover effect of firms’ earnings announcements on its industry peers through analysts’ forecasts. However, according to him, the SIC is not representative of the analysts’ peer choices. Thus, the author proposes a new peer selection method. Within each SIC industries, subgroups of firms sharing at least 5 analysts are formed. This methodology is interesting in the context of this study where information spillovers are examined to test the market efficiency hypothesis. However, restrictions on analysts can be problematic in other contexts. Again, quantitative accounting and financial research require large samples for degrees of freedom needs. However, this methodology leads to the creation of very small groups of firms. In addition, the most covered firms by analysts are also the largest in size. A selection bias on size could appear since small firms will be excluded
from the sample since analysts are less willing to follow them. This is even more problematic because of the tension in the use of size as the sole criterion for selecting peers. If we consider that size can be a selection criterion, then the methodology proposed by Ramnath (2002) is problematic because it excludes small firms, when they could simply be included in the same peer group. Conversely, if size is not an exclusive selection criterion, two firms of different sizes can be compared. However, with this methodology, small firms will have little chance of being grouped with larger firms.
Analyst coverage contains information about economic linkage between firms that could be used for peer selection (Ali and Hirshleifer 2020). In their study, Ali and Hirshleifer (2020) use analyst coverage to create a network of firms. They analyze the shared coverage from analysts between two firms as a measure of similarity, which enable them to ultimately form peer groups. Their methodology presents similar advantages that a continuous measure of homogeneity offer identified in other studies (Lee et al. 2015; Hoberg and Phillips 2016). However they suffer from a weakness identified by De Franco et al. (2015). The study by De Franco et al. (2015) shows that analysts may use their discretion to select peers to match their personal incentives. For example, the links maintained with investment banks can force analysts to choose peers that fit their need in terms of evaluation, rather than choosing the most homogeneous firms. From a peer selection perspective, De Franco et al. (2015) identify new limits to the methodology proposed by previous studies using analysts (Ramnath 2002; Ali and Hirshleifer 2020). The authors show that analysts’ peer choices can be biased by factors that are not economically linked to the fundamentals of firms but may be motivated by personal incentives.
Data gathering by users on government platforms (EDGAR) contains information on peer selection (Lee et al. 2015). The authors analyze the sequence of document downloads by users. They argue that investors will sequentially download the reports of firms Y and Z considered as peer firms of firm X to carry out their financial analysis of firm X. For each firm, they create a network of peer firms based on the sequence of download of financial reports. Thus, they create a scoring system to measure the distance between one firm and another. The advantages related to this peer selection method remain similar to those proposed by the study of Hoberg and Phillips (2016): dynamic over time; flexibility in the constitution of industries. However, there are some limitations. First, the methodology relies on access to proprietary data to construct the
classification (EDGAR Log details), which makes its replication almost impossible. Second, there are many doubts that investors do download 10-K reports, especially directly from government platforms like EDGAR (Loughran and McDonald 2017). More generally, little information is available on who actually use this type of platform. For example, if the score is mainly based on downloads from unsophisticated investors it may result in a noisy measurement. Likewise, behavioral finance has shown the existence of a “familiarity” bias where users tend to pay more attention to stocks they know, or which relate to products they can buy. This bias can have the consequence of directing their research of a peer company, without considering the one offering the best economic homogeneity.
2. Industry classification misfits
2.1. Introduction
A large body of archival research in accounting and finance investigates the association between firm-specific characteristics and various outcomes such as performance or financial reporting quality (FRQ). A classical concern is whether measured associations are driven by actual economic phenomena rather than model specification issues, such as correlated omitted variables.
One way to mitigate this concern is to take into account industry membership. A typical approach is to decompose a variable between expected and unexpected components, in which the resulting “unexpected” (abnormal, discretionary) component measures how the firm deviates from the industry norm at a given point in time. A popular example is the prediction of accruals (e.g. Dechow et al., 1995; Kothari et al., 2005), in which the decomposition is generally based on industry-year regressions.8 Intra-industry homogeneity is therefore critical for the validity of
subsequent inferences and some researchers have illustrated the adverse effects of heterogeneity (e.g., Owens et al., 2017).
In this chapter, I argue that differences between industry classification schemes can be exploited to improve peer firm selection and intra-group homogeneity. More precisely, I argue that the leading classification schemes are complements rather than substitutes. I posit that since existing schemes are based on different classification criteria and for different users, relevant information is lost when a single classification is used to identify groups of “similar” firms. To illustrate this argument, I combine information from multiple classifications in order to isolate industry
classification misfits from other firms (i.e., core firms). I then describe how misfits differ from
core firms on various dimensions (e.g., abnormal accruals, return comovement) and provide supplementary analysis to ensure that our results are driven by the misfit effect (i.e., heterogeneity) rather than alternative explanations (e.g., quality, risk).
My misfit identification scheme is simple to implement and replicate. The scheme is based on six-digit GICS (hereafter GICS6) and two-six-digit SIC (SIC2) industry levels. Both are available from 8 Similar approaches have been used to distinguish industry-level from firm-specific information in stock returns (e.g.
Piotroski and Roulstone 2004) or earnings (e.g., Hui, Nelson and Yeung 2016), or to identify firm-specific investments in intangibles (Enache and Srivastava 2018).