Automated defect detection algorithm applied to
shearography in composites
Jean-François Vandenrijt, Marc Georges
Centre Spatial de Liège, University of Liège, Avenue du Pré Aily, B-4031 Angleur, Belgium
1 Introduction
The aeronautic industry makes now largely use of composite material in its prod-ucts. Therefore huge efforts have to be done on their experimental validation of these materials. More specifically these composite materials introduce new type of defects (such as delamination, glue defects…) which need to be detected during the manufacturing and maintenance to prevent failures. Moreover the widespread use of these materials imposes to the future detection instruments to be cheap, ro-bust and easy to manipulate by non-specialists. Shearography is an emerging tech-nique for the detection of defects in the composite material [1,2]. It is cheap, and relatively robust and flexible, but requires special qualification to interpret the de-fect signatures in the interference pattern. Therefore efforts need to be carried out to ease the interpretation of shearographic results for non-specialist of the tech-nique [3]. More specifically, we are looking for techtech-niques to automatically identi-fy defects with shearography by the development of specific algorithms.
2 Development of an automatic defect detection algorithm
Firstly we need to specify what a defect is in the frame of shearography. One common characteristic of defects seen by shearography is that they induce local increase of the fringe density. The fringe density is directly linked to the slope of the phase measured by shearography. A higher fringe density appears when the gradient of the phase is high. Thus, the fringe density can be obtained by measur-ing the gradient of the phase map. For evaluatmeasur-ing the local frmeasur-inge density at every point of the phase map image, we compute the RMS value of the gradient along the horizontal and vertical axis of the phase map. This operation is illustrated in Fig. 2, which represent the gradient of the phase image shown in Fig. 1.
The gradient image contains the addition of the global and the local defor-mations. Only the local deformations are signature of defects we want to detect. For removing the global gradient, we compute the quartic fit of the gradient map
2
and subtract it, as shown in Fig. 3. We can now clearly see the defects present in the phase map show higher gradient values.
A straightforward way to identify them would be to set a threshold value, named Gd. This technique is applied in Fig. 4, where the 4 defects have
success-fully been detected by our algorithm. These defects are shown by drawing a rec-tangle around the areas where the gradient is higher than Gd.
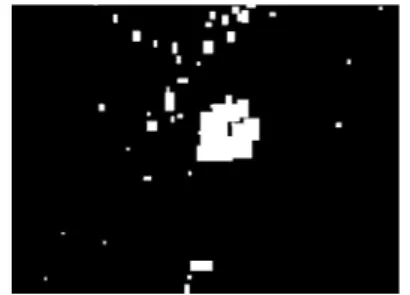
However, for more complex samples, this method proved to be too simplistic. In presence of noise, false positives can occur on small area of high gradient. They can be removed by defining a minimal defect size – for example, an area smaller than the shear distance is very likely to be a false positive. On the other hand, noise can lead to zone with defects to be fractioned in an ensemble of smaller are-as. This is illustrated in Fig. 5 and Fig. 6, where a white rectangle has been gener-ated around areas of values higher than Gd.
To solve this issue, we need to discriminate real defects from false positive ones. Noise produces detected areas of small dimensions. Thus, it is possible to suppress them by removing the boxes smaller than a certain dimension Lmin. We
can also observe that the gradient value drops rapidly in false positive areas. This observation allows us to futher discriminate these zones from real defect by setting a value – we will call Gc – lower than Gd for the dimensions of the defects. This
permits to increase the dimensions of the real positive without increasing a lot the false positive areas. In addition to that, to avoid this operation to suppress
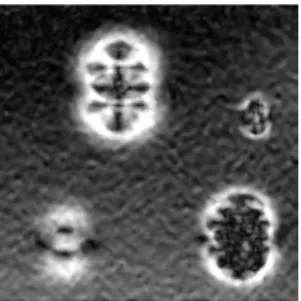
frac-Fig. 1. Phase difference image of a
numerical-ly simulated sample with 4 defects measured by shearography
Fig. 2. Gradient intensity image of the phase
difference image in Fig. 1
Fig. 3. Removal of the global variations of the
3
tioned defects, we first merge the areas in contact one to another or within a few pixels vicinity. Finally, in order to avoid too much noise that could lead to large amount of false positives, we exclude the areas detected where the quality of the interference is too low that a certain threshold. For this, we compute the value of the modulation intensity from the phase-stepped interferograms and set a minimal value. The detection will only be realized within the zones of the phase map where the modulation intensity is high than the threshold. This operation does not neces-sitate heavy computation power; it is therefore easy to give a real-time feedback of the quality of the interference to perform good acquisition, even for non-experts. The result of the ensemble of these operations performed on Fig. 6 is shown in Fig. 7. The final output of the detection algorithm is shown superposed on the phase image in Fig. 8.
After varying the values of Gd, Gc, and Lmin, we have been able to determine a
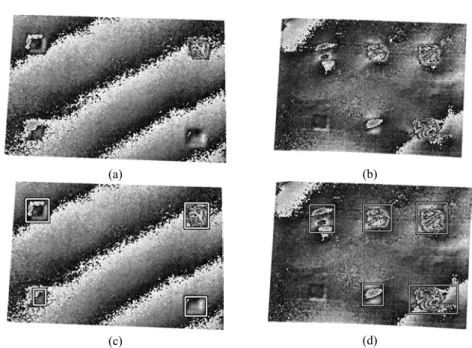
set of optimal values to maximize the efficiency of the detection algorithm for a large variety of test samples. Encouraging results have been obtained. Some re-sults observed in field conditions on aeronautic samples are shown in Fig. 9.
3 Conclusions
We have presented a promising technique to automatically detect defects in
com-Fig. 5. Phase difference image of a more
complex sample measured by shearography
Fig. 6. White box around areas with gradient
values higher than detection threshold.
Fig. 7. Fusion of touching boxes and
suppres-sion of boxes smaller that a defined size
4
posite materials inspected by shearography. The process scans the phase map to localize high local fringe density by computing the gradient and removing the global variations. A set of operations are realized to discriminate real defects from noise. The first results we obtained on thermally loaded composite sample ob-served in industrial conditions show promising results and encourage us to pursue our researches on automatic defect detection.
4 References
1. Steinchen, W (2003) Digital Shearography: Theory and Application of Digital Speckle Pat-tern Shearing, SPIE-InPat-ternational Society for Optical Engineers
2. Kalms, M, Osten, W(2003) Mobile shearography system for the inspection of aircraft and au-tomotive components, Optical Engineering 42, 1188–1196
3. Fantin, A, Willemann, D, Viotti, M, Albertazzi, A (2013) A computational tool to highkight anomalies on shearographic images in optical flaw detection, Proc. SPIE 8788, 8788-20
(a) (b)
(c) (d)
Fig. 9. Phase difference image of two samples (a,b) measured by shearography with thermal