Pépite | Améliorer l'efficacité cognitive des diagrammes UML : Application de la Sémiologie Graphique
165
0
0
Texte intégral
(2) Thèse de Yosser El Ahmar, Université de Lille, 2018. Acknowledgments First of all, I would like to express my sincere gratitude to Xavier LE PALLEC who supervised this thesis. Xavier gave me the opportunity to do this research work and created an ideal context for it. In addition to his support, advice and knowledge he transmitted to me, I would like to thank him for his availability and encouragement. I am also extremely grateful to Sébastien GÉRARD for his wise advice, his pertinent remarks and his scientific rigor. My sincere thanks goes to Kari SYSTÄ and Michel R.V. CHAUDRON who have done me the honor to evaluate my work and to be the referees. I would like to thank them for their constructive comments. I would like to especially thank Michel R. V. CHAUDRON for welcoming me to his laboratory as a visiting student. He gave me the opportunity to acquire knowledge about empirical research. His insightful and timely remarks have had a positive impact on my research. I also thank Monique NOIRHOMME, Sophie DUPUY-CHESSA, Jean-Sébastien SOTTET and Jordi CABOT for having accepted to be part of the jury members and for their interesting comments and challenging questions. The work presented in this thesis has been financed by the CEA and done within the Laboratory for Integration of Systems and Technology (LIST). So thanks again to Sébastien GÉRARD for hosting me in his laboratory. A big thanks is addressed to all my colleagues, members of the LIST and the CARBON teams for the very favorable atmosphere they created around me. In particular: Camille, Fadoua, Sahar, Slim, Michel and Mickaël. A special thanks to all my friends, who recognize themselves, who supported me during the difficult times, especially my dear Narjes. The totality of my gratitude and my thoughts go to my parents Mouhamed and Karima, to my brother Oussema and my sister Ghada. They never stopped encouraging me and giving me support. It is therefore natural that this document is dedicated to them. And, of course, I express my deepest gratitude for Houssem, my husband, who has been able to bear me and to cheer me up with infinite patience during these years. Finally, a big hug to my dear son Iyed who brought light and happiness to my life some weeks before the defense of this thesis. Antony, 01-25-2019. © 2018 Tous droits réservés.. lilliad.univ-lille.fr.
(3) Thèse de Yosser El Ahmar, Université de Lille, 2018. © 2018 Tous droits réservés.. lilliad.univ-lille.fr.
(4) Thèse de Yosser El Ahmar, Université de Lille, 2018. Contents Contents. iii. List of Figures. v. List of Tables. ix. List of Abbreviations 1 Introduction 1.1 Context . . . . . . . 1.2 Problem statement . 1.3 Research questions . 1.4 Contributions . . . . 1.5 Outline of the thesis. x. . . . . .. 1 2 3 5 6 8. . . . . .. 9 10 12 20 22 23. 3 State of the art 3.1 Software engineering . . . . . . . . . . . . . . . . . . . . . . . . . . . . 3.2 The Semiology of Graphics (SoG) . . . . . . . . . . . . . . . . . . . . .. 25 26 37. 2 The 2.1 2.2 2.3 2.4 2.5. . . . . .. . . . . .. visual variables in the Design methodology . . The qualitative study . . The quantitative study . Discussion of the results Conclusion . . . . . . . .. . . . . .. . . . . .. . . . . .. . . . . .. . . . . .. . . . . .. . . . . .. . . . . .. . . . . .. . . . . .. . . . . .. practice of UML . . . . . . . . . . . . . . . . . . . . . . . . . . . . . . . . . . . . . . . . . . . . . . . . . . . . . . .. . . . . .. . . . . .. . . . . .. . . . . .. . . . . .. . . . . .. . . . . .. . . . . .. . . . . .. . . . . .. . . . . .. . . . . .. . . . . .. . . . . .. . . . . .. . . . . .. . . . . .. . . . . .. . . . . .. . . . . .. . . . . .. . . . . .. . . . . .. . . . . .. 4 SoG-UML: Semiological guidelines for the visual enrichment of diagrams 4.1 The UML concrete syntax: an exhaustive classification . . . . . . 4.2 SoG-UML . . . . . . . . . . . . . . . . . . . . . . . . . . . . . . . 4.3 SoG-UML: Color . . . . . . . . . . . . . . . . . . . . . . . . . . . 4.4 SoG-UML: Brightness . . . . . . . . . . . . . . . . . . . . . . . . 4.5 SoG-UML: Size . . . . . . . . . . . . . . . . . . . . . . . . . . . . 4.6 SoG-UML: Grain . . . . . . . . . . . . . . . . . . . . . . . . . . . 4.7 SoG-UML: Orientation . . . . . . . . . . . . . . . . . . . . . . . . 4.8 Superposition of UML nodes . . . . . . . . . . . . . . . . . . . . . 4.9 Combinations of the retinal variables . . . . . . . . . . . . . . . . 4.10 Summary . . . . . . . . . . . . . . . . . . . . . . . . . . . . . . . 4.11 Discussion . . . . . . . . . . . . . . . . . . . . . . . . . . . . . . . 5 Evaluation © 2018 Tous droits réservés.. . . . . .. . . . . .. . . . . .. . . . . .. UML . . . . . . . . . . .. . . . . . . . . . . .. . . . . . . . . . . .. 59 61 64 66 75 80 87 91 95 101 104 105 107. iii. lilliad.univ-lille.fr.
(5) Thèse de Yosser El Ahmar, Université de Lille, 2018. CONTENTS. 5.1 5.2 5.3 5.4 5.5. Lessons learned from a conducted experiment Experiment definition . . . . . . . . . . . . . . Experiment design . . . . . . . . . . . . . . . Color and UML: A quantitative experiment . Summary . . . . . . . . . . . . . . . . . . . .. . . . . .. . . . . .. . . . . .. . . . . .. . . . . .. . . . . .. . . . . .. . . . . .. . . . . .. . . . . .. . . . . .. . . . . .. . . . . .. . . . . .. 110 113 114 116 122. 6 Implementations 123 6.1 FlipLayers . . . . . . . . . . . . . . . . . . . . . . . . . . . . . . . . . . 124 6.2 Interactive keys for UML diagrams . . . . . . . . . . . . . . . . . . . . 128 7 Conclusion 133 7.1 Conclusions . . . . . . . . . . . . . . . . . . . . . . . . . . . . . . . . . 134 7.2 Perspectives . . . . . . . . . . . . . . . . . . . . . . . . . . . . . . . . . 135 Bibliography. 137. Appendix 142 Summary of SoG-UML guidelines . . . . . . . . . . . . . . . . . . . . . . . . 142. © 2018 Tous droits réservés.. iv. lilliad.univ-lille.fr.
(6) Thèse de Yosser El Ahmar, Université de Lille, 2018. List of Figures 1.1 1.2 1.3. . . . . . . . . . . . . . . distribution . . . . . . .. . . . . . . . . . . of tasks . . . . . . . . . . . . .. . . . . . . . .. . . . . . . . .. . . . . . . . .. . . . . . . . .. . . . . . . . .. 2 4 5. Communications with non-familiars with UML . . . . . . UML diagrams used in practice . . . . . . . . . . . . . . Utility of colors in practice . . . . . . . . . . . . . . . . . The need for keys in practice . . . . . . . . . . . . . . . . The need for the visual variables in practice . . . . . . . Analysis of the visual variations in the models repository. Different implementations of color to UML elements . . . The use of keys/legends in UML . . . . . . . . . . . . . .. . . . . . . . .. 14 15 18 19 19 20 21 22. 3.1 3.2 3.3 3.4 3.5 3.6 3.7 3.8 3.9 3.10 3.11 3.12 3.13 3.14 3.15 3.16 3.17 3.18 3.19 3.20. The three types of graphical representations . . . . . . . . . . . . . . . An UML class diagram: A network or a map . . . . . . . . . . . . . . . Points, lines and zones of the SoG. . . . . . . . . . . . . . . . . . . . . Visual variables . . . . . . . . . . . . . . . . . . . . . . . . . . . . . . . Continuous and dashed lines: a grain variation . . . . . . . . . . . . . . Selective perception with colors . . . . . . . . . . . . . . . . . . . . . . Associative perception of shape . . . . . . . . . . . . . . . . . . . . . . Dissociative perception of the size . . . . . . . . . . . . . . . . . . . . . Ordered perception of the size and the brightness . . . . . . . . . . . . Non ordered perception of colors. . . . . . . . . . . . . . . . . . . . . . Quantitative perception of the size . . . . . . . . . . . . . . . . . . . . Empty activity diagram: A default grain variation . . . . . . . . . . . . Selective perception of colors in an empty activity diagram . . . . . . . The map of France. . . . . . . . . . . . . . . . . . . . . . . . . . . . . . The brightness to express the population density. . . . . . . . . . . . . A map with a title and keys. . . . . . . . . . . . . . . . . . . . . . . . . Effective keys by Genon et al. [23] . . . . . . . . . . . . . . . . . . . . . The notion of effective categories of the retinal variables: brightness. . . Saturated colors do not have the same value of brightness. . . . . . . . Colors of the spectrum in different brightness. Saturated colors are marked by a white circle. . . . . . . . . . . . . . . . . . . . . . . . . . . Three effective categories of brightness. . . . . . . . . . . . . . . . . . . Four effective categories of brightness. . . . . . . . . . . . . . . . . . . . Effective categories of brightness. . . . . . . . . . . . . . . . . . . . . . Effective categories of orientation for lines and points. . . . . . . . . . . Different implementations of the size retinal variable to an UML class. .. 38 39 39 41 43 44 44 45 45 45 46 47 47 49 49 50 51 52 52. v. . . . . . . . .. . . . . . . . . using . . . .. 2.1 2.2 2.3 2.4 2.5 2.6 2.7 2.8. 3.21 3.22 3.23 3.24 3.25 © 2018 Tous droits réservés.. The visual variables . . . . . . . . . . . . . Class diagram of an e-learning platform . . Class diagram of an e-learning platform: stereotypes . . . . . . . . . . . . . . . . . .. 53 54 54 54 55 56 lilliad.univ-lille.fr.
(7) Thèse de Yosser El Ahmar, Université de Lille, 2018. LIST OF FIGURES. 3.26 Color: different possible implementations on an UML class . . . . . . . 3.27 Color: taking into account the embedding relationships . . . . . . . . .. 56 57. 4.1 4.2 4.3 4.4. 62 63 64. 4.5 4.6 4.7 4.8 4.9 4.10 4.11 4.12 4.13 4.14 4.15 4.16 4.17 4.18 4.19 4.20 4.21 4.22 4.23 4.24 4.25 4.26 4.27 4.28 4.29 4.30 4.31 4.32 4.33 4.34 4.35. © 2018 Tous droits réservés.. Cartography of the UML graphic nodes and the used visual variables. . Cartography of UML graphic edges and the used visual variables. . . . The identified graphic elements. . . . . . . . . . . . . . . . . . . . . . . The class diagram of the Internet Banking System created by its developers. . . . . . . . . . . . . . . . . . . . . . . . . . . . . . . . . . . . . The possible implementations of the color retinal variable on an UML class. . . . . . . . . . . . . . . . . . . . . . . . . . . . . . . . . . . . . . Colors and the borders, separation lines and text thinness. . . . . . . . Impact of the line thickness on the selectivity of colors. . . . . . . . . . Coloring the UML node’s name compartment. . . . . . . . . . . . . . . Implementations of colors which might alter the UML primary notation. Effective implementation of the color retinal variable on an UML class. Effective implementations of the color retinal variable to 4 different UML nodes. . . . . . . . . . . . . . . . . . . . . . . . . . . . . . . . . . . . . IBS class diagram: Medium level of the background color’s brightness. . RGB and HSB codes of the colors used in Figure 4.12. . . . . . . . . . RGB and HSB codes of the colors used in Figure 4.15. . . . . . . . . . IBS class diagram: High level of the background color’s brightness. . . Unreadability of the text labels in a dark background color of an UML node. . . . . . . . . . . . . . . . . . . . . . . . . . . . . . . . . . . . . . IBS class diagram: Low level of the background color’s brightness. . . . RGB and HSB codes of the colors used in Figure 4.17. . . . . . . . . . The same background color for UML nodes and icons. . . . . . . . . . . Different background colors for UML nodes and icons. . . . . . . . . . . Effective implementation of an icon in a white UML node. . . . . . . . White background color of icons in all levels of brightness of the main UML node’s background color. . . . . . . . . . . . . . . . . . . . . . . . Effective implementation of icons in colored UML nodes. . . . . . . . . Effective implementation of a port in a white ported and white contained UML node. . . . . . . . . . . . . . . . . . . . . . . . . . . . . . . . . . Effective implementation of a port colored and white contained ported UML node. . . . . . . . . . . . . . . . . . . . . . . . . . . . . . . . . . Effective implementation of a port in a white container. . . . . . . . . . Effective implementation of a port in a colored ported UML node and contained in a colored container. . . . . . . . . . . . . . . . . . . . . . . Effective implementation of a port in a white ported UML node and contained in a colored container. . . . . . . . . . . . . . . . . . . . . . . Possible implementations of the brightness retinal variable on an UML class. . . . . . . . . . . . . . . . . . . . . . . . . . . . . . . . . . . . . . Brightness and borders, separation lines and text thinness. . . . . . . . Applying the brightness to the UML node’s name compartment. . . . . Implementations of brightness which can alter the UML primary notation Applying the brightness to only background . . . . . . . . . . . . . . . Effective implementation of the brightness to different UML nodes . . . Text labels should not have different levels of brightness. . . . . . . . .. vi. 65 67 67 68 68 69 69 69 70 70 70 71 71 72 72 73 73 73 73 74 75 75 75 75 75 76 77 77 77 78 78 79. lilliad.univ-lille.fr.
(8) Thèse de Yosser El Ahmar, Université de Lille, 2018. LIST OF FIGURES. 4.36 The effective implementation of the brightness retinal variable in the IBS class diagram. . . . . . . . . . . . . . . . . . . . . . . . . . . . . . 79 4.37 Possible implementations of the size retinal variable in a UML class. . . 81 4.38 Size variation on the area of UML nodes. . . . . . . . . . . . . . . . . . 82 4.39 A size variation on the IBS class diagram. . . . . . . . . . . . . . . . . 82 4.40 A size variation of the borders and/or separation lines on an UML class. 83 4.41 A size variation of only the text of an UML class. . . . . . . . . . . . . 83 4.42 The effective implementation of the size retinal variable to a UML node. 83 4.43 Effective implementations of the size retinal variable to four UML nodes. 84 4.44 The effective implementation of the size retinal variable in the IBS class diagram. . . . . . . . . . . . . . . . . . . . . . . . . . . . . . . . . . . . 84 4.45 varying the size of only the separation lines and borders. . . . . . . . . 84 4.46 Varying the only the size of the text of an UML class. . . . . . . . . . . 85 4.47 Varying the size of the border and the text. . . . . . . . . . . . . . . . 85 4.48 Effective implementation of the size retinal variable, in case the area of the corresponding UML node cannot vary. . . . . . . . . . . . . . . . . 85 4.49 Effective implementation of the size retinal variable on the IBS class diagram. . . . . . . . . . . . . . . . . . . . . . . . . . . . . . . . . . . . 86 4.50 Effective implementation of the size retinal variables on icons. . . . . . 86 4.51 Possible implementations of the grain visual variable to an UML class. 88 4.52 Applying the grain to the border lines of a UML class will alter the UML primary notation. . . . . . . . . . . . . . . . . . . . . . . . . . . . . . . 88 4.53 Three examples of possible textures. . . . . . . . . . . . . . . . . . . . 89 4.54 Null grain and the readability of text. . . . . . . . . . . . . . . . . . . . 89 4.55 Grain and brightness. . . . . . . . . . . . . . . . . . . . . . . . . . . . . 89 4.56 The effective implementation of the grain retinal variable on the IBS class diagrams. . . . . . . . . . . . . . . . . . . . . . . . . . . . . . . . 90 4.57 Effective implementations on other UML nodes. . . . . . . . . . . . . . 90 4.58 The effective implementation of the grain (here different textures) retinal variable and icons. . . . . . . . . . . . . . . . . . . . . . . . . . . . . . 91 4.59 Varying the orientation of the contained text of an UML node. . . . . . 92 4.60 No phenomena of multiple parallel spots. . . . . . . . . . . . . . . . . . 92 4.61 Varying the orientation of the text and the lines of separation. . . . . . 93 4.62 No phenomena of multiple linear spots. . . . . . . . . . . . . . . . . . . 93 4.63 Changing the orientation of the whole UML node is problematic for UML nodes having non-linear aspect. . . . . . . . . . . . . . . . . . . . 93 4.64 Varying the orientation of UML nodes having a linear aspect. . . . . . 94 4.65 Varying the orientation of a constant texture. . . . . . . . . . . . . . . 94 4.66 Example of a UML classes with a brightness variation and contained in grained package. . . . . . . . . . . . . . . . . . . . . . . . . . . . . . . 95 4.67 An example of a combination between the size and the color retinal variables. . . . . . . . . . . . . . . . . . . . . . . . . . . . . . . . . . . 102 4.68 Redundant combination of colors and grain in the IBS class diagram. . 103 4.69 Size and brightness to reinforce the quantitative perception in the IBS class diagram. . . . . . . . . . . . . . . . . . . . . . . . . . . . . . . . . 104 5.1 5.2. © 2018 Tous droits réservés.. Scope of the empirical study. . . . . . . . . . . . . . . . . . . . . . . . . 109 Experiment about the size variation on UML sequence diagrams: An example of a question. . . . . . . . . . . . . . . . . . . . . . . . . . . . 111. vii. lilliad.univ-lille.fr.
(9) Thèse de Yosser El Ahmar, Université de Lille, 2018. LIST OF FIGURES. 5.3 5.4 5.5 5.6 5.7 5.8 5.9. Reading the question via the web application. Response time collection. . . . . . . . . . . . . Experiments: the web application . . . . . . . Answer correctness per implementation. . . . Box-plot: the results of the study. . . . . . . . Post experiment: Participants opinions . . . . Post experiment: Participants opinions. . . . .. . . . . . . .. . . . . . . .. . . . . . . .. . . . . . . .. . . . . . . .. . . . . . . .. . . . . . . .. . . . . . . .. . . . . . . .. . . . . . . .. . . . . . . .. . . . . . . .. . . . . . . .. . . . . . . .. 112 112 117 119 120 121 122. 6.1 6.2. The graphical layer mechanism . . . . . . . . . . . . . . . . . . . . . . 125 Using FlipLayers to express the project project progress in the IBS use case diagram. . . . . . . . . . . . . . . . . . . . . . . . . . . . . . . . . 127 6.3 A layers stack: Project progress criteria. . . . . . . . . . . . . . . . . . 127 6.4 The visibility property of FlipLayers . . . . . . . . . . . . . . . . . . . 127 6.5 Visual annotation process using the interactive keys. . . . . . . . . . . 129 6.6 The interactive keys proposition for an ordered tag: Project progression. 130 6.7 The interactive keys proposition for a selective tag: Distribution of tasks. 130 6.8 Assistance to the effective retinal variable use. . . . . . . . . . . . . . . 130 6.9 The interactive keys as captions or legends. . . . . . . . . . . . . . . . . 131 6.10 The interactive keys as captions or legends: two tags. . . . . . . . . . . 131. © 2018 Tous droits réservés.. viii. lilliad.univ-lille.fr.
(10) Thèse de Yosser El Ahmar, Université de Lille, 2018. List of Tables 3.1 3.2 3.3 3.4 3.5 3.6 3.7. Evaluation of three UML diagrams with the cognitive dimensions framework. ⊕ mark designates a positive point, indicates a negative point. Positioning of the work of this thesis in relation to the CDs and the PoNs frameworks. . . . . . . . . . . . . . . . . . . . . . . . . . . . . . . Example of data for visual encoding. . . . . . . . . . . . . . . . . . . . Organization levels of information properties in UML. . . . . . . . . . . Organization levels of the retinal variables. . . . . . . . . . . . . . . . . Capacity of the retinal variables in the selective perception. . . . . . . . The population density per city in France in 2009 . . . . . . . . . . . .. 29 36 38 41 46 48 48. 4.1. The used rules from the SoG to generate our guidelines about colors in UML. . . . . . . . . . . . . . . . . . . . . . . . . . . . . . . . . . . . . 66 4.2 The used rules from the SoG to generate our guidelines about the brightness in UML. . . . . . . . . . . . . . . . . . . . . . . . . . . . . . . . . 75 4.3 The used rules from the SoG to generate our guidelines about the size variation in UML. . . . . . . . . . . . . . . . . . . . . . . . . . . . . . . 80 4.4 The used rules from the SoG to generate our guidelines about the grain in UML. . . . . . . . . . . . . . . . . . . . . . . . . . . . . . . . . . . . 87 4.5 The used rules from the SoG to generate our guidelines about the orientation variation in UML. . . . . . . . . . . . . . . . . . . . . . . . . . 91 4.6 The used rules from the SoG to generate our guidelines about the superposition of the retinal variables in UML. . . . . . . . . . . . . . . . 95 4.7 Containment relationship between UML nodes and colors. . . . . . . . 96 4.8 Containment relationship between UML nodes and sizes. . . . . . . . . 98 4.9 Containment relationship between UML nodes and brightness. . . . . . 99 4.10 Containment relationship between UML nodes and grain. . . . . . . . . 100 4.11 The used rules from the SoG to generate our guidelines about the combinations of the retinal variables in UML. . . . . . . . . . . . . . . . . . 101 5.1 5.2 5.3. © 2018 Tous droits réservés.. Hypothesis . . . . . . . . . . . . . . . . . . . . . . . . . . . . . . . . . . 111 Hypothesis . . . . . . . . . . . . . . . . . . . . . . . . . . . . . . . . . . 114 Questions of the study and the size of the related diagrams. . . . . . . 118. ix. lilliad.univ-lille.fr.
(11) Thèse de Yosser El Ahmar, Université de Lille, 2018. List of Abbreviations CDs Cognitive Dimensions PoNs Physics of Notations SoG Semiology of Graphics UML Unified Modeling Language. © 2018 Tous droits réservés.. x. lilliad.univ-lille.fr.
(12) Thèse de Yosser El Ahmar, Université de Lille, 2018. Chapter 1 Introduction Contents. © 2018 Tous droits réservés.. 1.1. Context . . . . . . . . . . . . . . . . . . . . . . . . . . . . . .. 2. 1.2. Problem statement . . . . . . . . . . . . . . . . . . . . . . .. 3. 1.3. Research questions. . . . . . . . . . . . . . . . . . . . . . . .. 5. 1.4. Contributions . . . . . . . . . . . . . . . . . . . . . . . . . . .. 6. 1.5. Outline of the thesis . . . . . . . . . . . . . . . . . . . . . . .. 8. 1. lilliad.univ-lille.fr.
(13) Thèse de Yosser El Ahmar, Université de Lille, 2018. 1.1. CONTEXT. 1.1. Context. Graphical representations are a key element in software engineering. If textual representations are efficient for linear reasoning, graphical ones score higher to show links among a set of elements [31]. But, the effective use of such visual representations requires to deeply understand how they work. According to Jaques Bertin [10], graphical representations have three functions. The first one is: saving information. It consists of drawing an inventory to save all information describing a particular situation or elements constituting a system (already existing or future one). Therefore, the reader maintains a sort of memory in which she/he can navigate to find relevant information for her/his task. This type of inventory may for sure serve to communicate information between two or more than two stakeholders. In fact, if the author assumes that some information is more relevant for the task that the receivers have to accomplish, she/he can highlight it (e.g., by increasing the volume of the sound of an audio representation or by increasing the size of a spot in a graphical representation). Communication is the second elementary function of a representation. The third function is the treatment of information. Some tasks like the optimization of a system or the determination of the behaviour of a kind of customers need to infer information. By organizing in different manners the information contained in a representation, readers may perceive (accidentally or not) correlations that might form new knowledge that is valuable for their activity [38]. The reorganization task represents a way to help humans to treat information. The techniques of visualization of information that are mostly employed nowadays in Big Data / Business Intelligence have proven the effectiveness of the graphical representation for many years in that objective. For these three functions, the graphical system has a major benefit compared to linear systems like the audio system or the textual one: it allows readers to rapidly identify links between the represented elements [31]. But it also has the capacity to instantly present multiple properties of an information with each displayed spot or mark: via its position1 and via its visual aspect (color, shape, size, orientation, grain and brightness). Each one of these means of visual variation allows to indicate different values for a particular property. X and Y axis, color, shape, size, orientation, grain and brightness are called visual variables. The visual variables except the X and Y planar axis are called retinal variables [10]. They are all depicted in Figure 1.1. Retinal variables. Planar variables. Size. Brightness. Texture/Grain. Vertical Position. Color. Orientation. Shape. Horizontal Position. Figure 1.1: The visual variables. The importance of the visual variables comes from their significance in the depth perception [10]. Experimental psychology defines the perception in a third dimension 1. in correspondence with the information in the plan (X or Y can indicate, each one, a value for a particular property) © 2018 Tous droits réservés.. 2. lilliad.univ-lille.fr.
(14) Thèse de Yosser El Ahmar, Université de Lille, 2018. 1.2. PROBLEM STATEMENT. as the result of multiple facts. First, the binocular vision (i.e., using two eyes) in a limit of six meters. Second, the apparent movement of an object when the reader moves. Third, the decrease of the size of a known object. Fourth, the decrease of the brightness of a known contrast. Fifth, the reduction of the grain of a known texture. Sixth, changing the known color of an object. Finally, the deformation of the shape and orientation of a known object. All the previously mentioned variations except from the two first ones are available to graphic authors to put information in a third dimension. The retinal variables are relatively rapidly perceived because the reader’s eye can detect their variation without moving the visual brush, the signals which are received on the retina are sufficient. In fact, the retinal variables are pre-attentively treated (without a conscious attention) by an automatic, very fast, and mostly parallel dedicated system: the visual system. Then, the retinal variables that captured the attention of the reader are cognitively processed by accessing to the short term memory and/or the long term memory. The short term memory has a very limited capacity and duration. It reflects the current attention of the reader. The cognitive processing in the long term memory has an unlimited capacity and duration but is very slow and sequential. Thus, the effective use of the retinal variables helps reducing the cognitive load of the human readers by shifting some of the cognitive work to the visual system. The massive use of schemes or diagrams in software engineering (95 % of practitioners [21]) is then understandable regarding the added value of the visual representations. Of course, the need of effectiveness when creating this kind of systems has been and remains a real academic and industrial problematic (see Diagrams and VL/HCC conferences or the Journal of Visual Languages and Computing). To enable object visual modeling tool interoperability, the Unified Modeling Language (UML) standard has taken inspiration from existing works concerning software modeling and has formed during the two last decades a good compromise between human readability and interoperability. UML became the de-facto visual modeling language for visualizing, specifying, constructing and documenting software intensive systems. For that reason, UML is in the focus of this thesis. Practitioners have noted several important benefits in using UML including: having a shareable common representation of the system to be built [13], the ability to mitigate the growing complexity of software by working at higher levels of abstraction and having more effective communication [18]. From a practitioner’s point of view, communication seems to be the most common benefit expected from modeling [18] and is ranked first among the important attributes of software models [21]. In addition, UML diagrams are frequently used in support of maintenance tasks, to assist in navigating and understanding the system [18].. 1.2. Problem statement. Concerning the areas of improvement in UML, we note the possible difficulty to describe contextual information (essentially relies on the saving of information function). Examples of contextual information can be the reasons why a diagram was written, its most important or central element(s) or the reason of this significance. More specifically, UML does not specify effective ways to visually express extra-information on a diagram. These extra-information is not limited to contextual ones and can also be the will to highlight the recurring use of a pattern (e.g., Model, View and Controller). © 2018 Tous droits réservés.. 3. lilliad.univ-lille.fr.
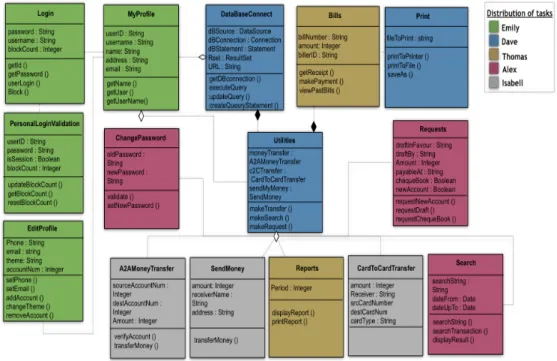
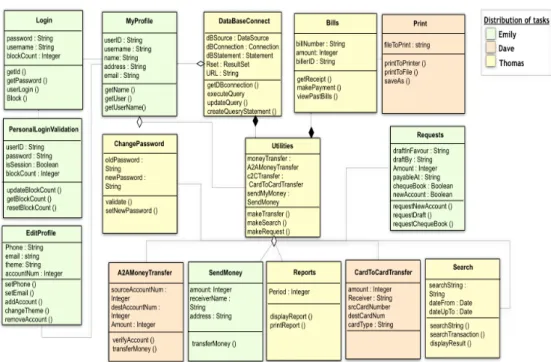
(15) Thèse de Yosser El Ahmar, Université de Lille, 2018. 1.2. PROBLEM STATEMENT. Furthermore, surveys about UML use in practice showed its unsuitability, sometimes, as a communication vehicle of a project (communication function) [21]. This is mainly due to differences of stakeholders levels of experience in UML. They might be familiar with it (e.g., software developer) or not (e.g., clients). Let us illustrate these facts via an example of a class diagram. It is shown in Figure 1.2 below. It describes the structure of an e-learning platform. Three types of users can log in to the platform (i.e., Trainer, Trainee and the Administrator). They can register to a training session, do the activities and use the means of communication which are available (i.e., Video-conference, Messages, Chat and forums). User. VideoConf. Communication idCommunication. idUser. idConf. addUser(). call(). Message Trainer grade. Trainee. Activity. Administrator. idActivity. idAdmin. level. content sendMessage(). displayActivity(). Chat Registration Training. Session. idRegistration. idSession(). register(). connect(). content write(). idTraining choiceFormation(). Forum subject participate(). Figure 1.2: Class diagram of an e-learning platform. We assume that a project manager uses the class diagram to discuss the progress of the development of the e-learning platform with the client. For that, he can use the diagram in Figure 1.2 without modifications. But, he adapts his speech to describe the actual state of progress. He might say: "All the classes concerning the users were implemented, but the administration of the platform part is not yet implemented. We started implementing the video-conference mean of communication. The chat, the messages and the forum options are not yet implemented. The registration to a particular session is already implemented and we begun implementing the activities management part". In such case, the client might not be able to keep track of the discussion and to have an overview about the progress of the project. He might wonder: What is the percentage of the project’s progress? What remains to do? Can we estimate the delivery time?. The project manager can also use the profiling mechanism [4] and annotate each class by a stereotype named by the corresponding state of progress, as illustrated in Figure 1.3 below. He can also add text within UML comments. Such usages are recommended by [34], however they might not represent the best solutions. In fact, textual representations processing is sequential and serial compared to visual © 2018 Tous droits réservés.. 4. lilliad.univ-lille.fr.
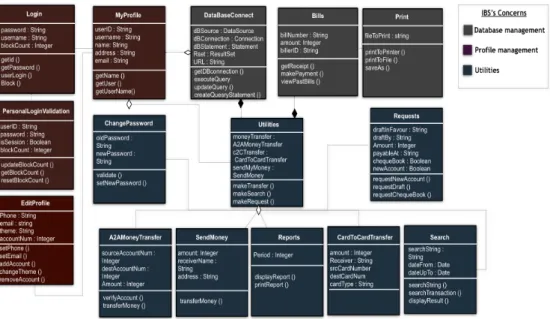
(16) Thèse de Yosser El Ahmar, Université de Lille, 2018. 1.3. RESEARCH QUESTIONS. representations processing which is parallel as previously explained. <<. Implemented>>. <<. User. In progress>>. <<. Communication. idUser. idConf. idCommunication. addUser(). call(). <<. <<. Implemented>>. <<. Trainer grade. Implemented>>. Trainee. <<. <<. To implement>>. To implement>>. Message. In progress>>. Activity. Administrator. content. idActivity. idAdmin. level. In progress>>. VideoConf. sendMessage() displayActivity() <<. To implement>>. Chat << <<. Implemented>>. Training. Implemented>>. Registration. <<. Implemented>>. content. Session. idRegistration. idSession(). register(). connect(). write(). idTraining choiceFormation(). <<. To implement>>. Forum subject participate(). Figure 1.3: Class diagram of an e-learning platform: distribution of tasks using stereotypes. A legitimate question arises at this level: how to improve or upgrade the effectiveness of UML to address these facts? In software engineering, there are two major conceptual frameworks that deal with the cognitive effectiveness 2 of visual notations in software engineering (i.e., including UML): the Cognitive Dimensions (CDs) framework [25] and the Physics of Notations (PoNs) framework [34]. The CDs framework is an evaluation technique for programming environments 3 . It captures a discussion support about cognitively relevant aspects of structure of programming environments. However, it is considered as only an evaluation framework, providing guidelines to enhance the cognitive effectiveness in each CD is out of its scope. The PoNs framework consists of a scientific framework to create new cognitively effective visual notations and to evaluate existing ones. It explores the power of the visual system to improve the cognitive effectiveness in some dimensions of the CDs framework. The author of the PoNs has structured a scientific basis for visual notations in software engineering. Nevertheless, the author has synthesized research theories which led to some incompleteness in some principles. Designers of visual notations cannot use them directly [42].. 1.3. Research questions. In the context of UML, changing its specification (i.e., its concrete and/or abstract syntax) to address the aforementioned facts does not represent the best and the only 2. The cognitive effectiveness denotes the speed, ease, and accuracy with which a representation can be processed by the human mind. 3 Visual notations like UML and associated tools © 2018 Tous droits réservés.. 5. lilliad.univ-lille.fr.
(17) Thèse de Yosser El Ahmar, Université de Lille, 2018. 1.4. CONTRIBUTIONS. solution. In fact, if we refer to the CDs framework, we can state for UML that the OMG [4] has precisely and exhaustively specified its primary notation and its semantics. But, it does not specify anything about the secondary notation dimension [25] which refers to the free use and change of the visual variables that are not employed in the UML primary notation (i.e., color, size, brightness, orientation and grain). There is no rule governing the way in which the visual variables of the secondary notation can be used. This leaves a big freedom and a possible mean to make UML more effective in saving, communicating and treating information especially by taking advantage of the visual variables. These latter are particularly powerful in reducing the cognitive work required to read and understand the rational/information conveyed by the diagrams and to navigate between them [34]. In that context, the following question arises 4 : RQ: How to improve the effectiveness of UML diagrams via an advanced usage of their secondary notation visual variables?. 1.4. Contributions. Addressing this question represents the main research axis of this thesis. The present work is considered as a continuity of T.R. Green work regarding the CDs framework and Moody’s work regarding the PoNs framework. The main characteristic of this thesis is to explore the rules defined by the Semiology of Graphics (SoG) [10] in the UML context/ work setting. The SoG is one of the main references in cartography. It has been for a long time adopted in the visualization of information works, in software visualization [30] and in HCI, particularly in the work of Yuri Engelhart with one of the authors of the cognitive dimensions [11]. In software engineering, it has been referenced by Moody in the PoNs framework and in the works of Conversy [14]. The exploration of the visual variables in UML requires understanding of; (i) Details about the situations of the use of UML in practice. (ii) Details about the actual state of practice in using (or not) the visual variables in UML. If numerous empirical studies treat the first scope by investigating the use of UML in practice, less researches investigate the use of the visual variables. They mainly focus on the position visual variable to find effective layouts [45] [40] [37] with sometimes studies about colors [46]. In order to fill this gap, we contribute an exploratory empirical study which consists of both qualitative study via in-depth semi-structured interviews with practitioners of UML and quantitative study via the analysis of the use of the visual variables in + 3500 UML diagrams. Among other results, both studies showed out a recurrent non effective use of the visual variables in UML (e.g., no keys). They also revealed an existing need to effectiveness in the use of the visual variables in UML including: the need to the subtlety of the visual variations and the importance of the usability of modeling tools in terms of rapidity, effectiveness and dynamism. This contribution has been published in the Human Factors in Modeling workshop at the MODELS conference in 2017 [20]. In order to improve the effectiveness of UML in the situations of its use in practice (i.e., captured in the previous empirical study), we present two additional contributions in this thesis. First, we define a scientific framework describing guidelines for the 4. © 2018 Tous droits réservés.. This is the general research question of this thesis. It is revisited and refined later on page 57.. 6. lilliad.univ-lille.fr.
(18) Thèse de Yosser El Ahmar, Université de Lille, 2018. 1.4. CONTRIBUTIONS. visual enrichment of UML diagrams based on the SoG. It begins with synthesizing the rules related to each visual variable from the SoG. At that stage, we observed that the SoG generally deals with elementary marks (e.g., only one geometric or symbolic shape) and not with composed ones which are massively used in UML. So, we proceed to a kind of empirical classification of the elementary UML graphic components. This aims at drawing an exhaustive list of them and to specify the way in which they are bound together. This allows us to carefully adapt the SoG principles to UML. The result is a list of sixty-one modeling guidelines in order to effectively exploit the UML secondary notation except layouts. In fact, although the position visual variable (i.e., layout) is under modeler’s control, it is not treated by SoG-UML. We deem that there exist many research works in the literature that deal with layouts like [45] [40] [37]. In addition, animations are not in the scope of this thesis. The guidelines of SoG-UML concern the effective implementation of each retinal variable in the UML graphic components which are contained in a white background. They concern the border, text, background, ports and icons. Then, the guidelines treat the possible containment of UML graphic components having different categories of the retinal variables (e.g., a green class contained in a dark package). Finally, SoG-UML treats the combination of retinal variables on UML nodes. It relies on the design and action theory5 [26]. To validate the guidelines of SoG-UML, we contribute a validated design methodology of an empirical study having an experiment as strategy of inquiry. The design methodology has been executed with the attendees of the Human Factors in Modeling workshop in 2016 and published in [19]. But, it failed because of problems that we explain in Chapter 5. We list the lessons learned from it to help succeeding the next experiments in the field of this thesis. Then, we detail the experiment that we have conducted and which succeeded to give statistically significant results. It involved ninety-five participants. It shows that the effective use of color helped the participants to find the correct answer in a relatively short period of time compared to the use of text via stereotypes. It validates three guidelines of SoG-UML. The design methodology of this experiment serves to validate the other guidelines of SoG-UML which becomes then a testable theory [26]. The next contribution is a proof of concept tool integrated in the Papyrus environment [24]. First, it consists of an implementation of the classical mechanism of graphical layers found in existing image editors (e.g., gimp) named FlipLayers. The retinal variables and the layers mechanism have been coupled together which aims at enhancing the communication value of UML diagrams. Controlling the visibility of a group of UML nodes together allows managing the complexity 6 of big UML diagrams [34]. It also allows a better cognitive integration7 of the different views of an UML model. This contribution has been published in the MODELS main conference in 2015 [8]. Second, we provide a prototype of an interactive keys to relatively rapidly decorate UML diagrams using the retinal variables. The interactive keys aims at satisfying some of the recommendations which have been mentioned by the UML practitioners in our previous empirical study. 5. A design and action theory is meant to give explicit prescriptions for constructing an artifact The ability of a visual notation to represent information without overloading the human mind. 7 the cognitive demands on the reader to mentally integrate information from different diagrams and keep track of where they are. 6. © 2018 Tous droits réservés.. 7. lilliad.univ-lille.fr.
(19) Thèse de Yosser El Ahmar, Université de Lille, 2018. 1.5. OUTLINE OF THE THESIS. 1.5. Outline of the thesis. This thesis is structured as follows: Chapter 2: The visual variables in the practice of UML presents how software designers use the visual variables in their daily practice of UML. For that, we refer to the results of the empirical study that we have conducted as a first contribution of this thesis [20]. Chapter 3: State of the art proves how the CDs framework represents just an evaluation framework of programming environments. Then, it illustrates how the PoNs Framework principles are incomplete and cannot be directly used by visual notations designers. In a second part, as we propose to refer to the SoG to enhance the cognitive effectiveness of UML, we present a first refinement layer of the SoG in the context of UML. For that, the basic theories of the SoG are exposed with a parallel positioning in regards to UML. It shows that the SoG does not deal with complex graphic elements like UML nodes (e.g., shapes that might contain text, headings, compartments, ports and icons). Chapter 4: SoG-UML: Semiological guidelines for the visual enrichment of UML diagrams defines the framework which structures the effective use of each retinal variable in UML, by managing the graphic complexity of the UML concrete syntax. The main objective of SoG-UML is to enhance the cognitive effectiveness of UML diagrams by taking advantage of the retinal variables. Chapter 5: Evaluation establishes a validated design methodology of experiments in order to assess the effective use of the retinal variables in UML. It makes of SoG-UML a testable theory. For that, it presents the lessons learned from a conducted but failed experiment [19]. Then, it defines the design methodology of an experiment which has been executed and succeeded to give statistically significant results. Chapter 6: Implementations presents how the SoG-UML guidelines might be integrated to modeling tools. For that, it describes the prototypes of tools which have been developed in the Papyrus environment [8]. Chapter 7: Conclusion and perspectives summarizes the contributions of the thesis and exposes its perspectives.. © 2018 Tous droits réservés.. 8. lilliad.univ-lille.fr.
(20) Thèse de Yosser El Ahmar, Université de Lille, 2018. Chapter 2 The visual variables in the practice of UML Contents 2.1. 2.2. Design methodology . . . . . . . . . . . . . . . . . . . . . . . 2.1.1. Qualitative and quantitative methods . . . . . . . . . . . . . 10. 2.1.2. Interpretation of results . . . . . . . . . . . . . . . . . . . . . 11. 2.1.3. Data collection procedures . . . . . . . . . . . . . . . . . . . . 11. The qualitative study . . . . . . . . . . . . . . . . . . . . . . 2.2.1. 2.3. 12. Analysis . . . . . . . . . . . . . . . . . . . . . . . . . . . . . . 13. The quantitative study . . . . . . . . . . . . . . . . . . . . . 2.3.1. © 2018 Tous droits réservés.. 10. 20. Analysis . . . . . . . . . . . . . . . . . . . . . . . . . . . . . . 21. 2.4. Discussion of the results . . . . . . . . . . . . . . . . . . . .. 22. 2.5. Conclusion. 23. . . . . . . . . . . . . . . . . . . . . . . . . . . . .. 9. lilliad.univ-lille.fr.
(21) Thèse de Yosser El Ahmar, Université de Lille, 2018. 2.1. DESIGN METHODOLOGY. Studying the utility of the visual variables in UML requires a deep exploration of the actual state of practice of both UML and the visual variables. On one hand, there is a huge effort in the literature investigating UML in practice. For example, [13][21][21][16] mainly address the purposes, the costs and benefits and the ways of using UML in practice. But, they do not mention enough details about the situations when practitioners need to visualize information and the kinds of information needed within each situation. On the other hand, few works concentrate on the use of the visual variables in UML. The majority of the existing researches focus on finding the effective layouts (i.e., the position visual variable) based on diagram comprehension and user preferences [45] [40] [37]. Some studies focus on colors like [9] and [46]. All of these works are controlled experiments so they do not report on the practices of UML users and their opinions about the visual variables. There is no qualitative research in this area. We conducted then an empirical study [20] in order to fill this gap. It is described in this Chapter.. 2.1. Design methodology. The purpose of the study is to create more and better understanding about the situations of the UML use in practice. A situation refers to the activities, the stakeholders who are involved in each activity, the information that they need to visualize, the practices of UML users in employing UML and the purposes of such usage. In the captured situations, the study aims at discovering the need for the visual variables in practice. If such need exists, we want to gain a great understanding about the kinds of visual annotation that UML practitioners perform, the purposes and the ways to do so. As a triangulation method, we analyzed the use of the visual variables in + 3500 diagrams related to open source projects in ub [27][3]. The theoretical perspective of the study is to help us exploring the benefits of the visual system as a mean of resolving problems that the study might reveal. Obtained results can also help us studying the usefulness of the visual variables in enhancing the effectiveness of UML in the captured situations. Finally, they might help tool vendors enhancing the usability of their tools by making more ergonomic visual automation. The study takes a deliberately broad interpretation of results from both methods, as it is meant to be exploratory.. 2.1.1. Qualitative and quantitative methods. We used a selective range of research techniques to gather data for our study. We used both qualitative study via in-depth semi structured interviews and quantitative study via the analysis of UML models related to open source projects in GitHub [3]. Such use of a variety of types of data helps us ensure a better coverage and a greater understanding about our following two research questions: RQ1 What are the situations when practitioners use UML, particularly which information do they need to visualize in each situation? RQ2 How and when do the practitioners use the visual variables in the previous situations? The qualitative in-depth interviews with eight experts and practitioners of UML helps us to gain understanding about the use of UML and the use of the visual variables. © 2018 Tous droits réservés.. 10. lilliad.univ-lille.fr.
(22) Thèse de Yosser El Ahmar, Université de Lille, 2018. 2.1. DESIGN METHODOLOGY. in practice. They allow us to understand the relationships between both kinds of use. More precisely, they let us find out the information that the practitioners need to visualize and the ways of using the visual variables (if so) to make them more visible. The analysis of the UML models related to open source projects provides us with quantitative data, particularly, about the use of the visual variables. It mainly answers the second research question by allowing us to draw conclusions about the amount of the visual variables use in a sample of + 3500 UML diagrams. This also enables us to judge the effectiveness (or not) of such usages based on existing theories, the SoG in this thesis [10]. This study is conducted in order to help us to achieve our goal in exploring the high performances of the visual variables in UML.. 2.1.2. Interpretation of results. We need to be particularly careful about how we analyze the results of our study and the conclusions that will be drawn. In fact, the first intent of this work is to create better understanding about the use of UML and the use of the visual variables in practice. It is not meant to verify hypothesis or generalize findings. It mainly serves as an exploratory study to help ongoing researches around UML. The analysis of our interview data has been carried out using the ‘grounded theory’ which is defined as a qualitative strategy in which the researcher derives a general abstract theory of a process action or interaction grounded in the views of participants in a study [41]. For that, we began by manually transcribing the interviews from audio to textual form. We read throughout the data and identified themes and descriptions. We tried to interrelate them using the grounded theory approach then we interpreted the results. The analysis of the UML models related to open source projects involved some basic enumerations and simple statistical calculations to get overall sense about the use of the visual variables in UML. The major effort was spent on the manual classification of the different diagrams based on the different usages (or not) of each visual variable. That helped us reporting on the state of practices of UML modelers in using the visual variables. You can find a replication package of the study in [6].. 2.1.3. Data collection procedures. Qualitative empirical study: In depth semi-structured interviews We conducted a series of semi-structured in-depth interviews with eight participants (six from industry and two researchers). Seven interviews have been carried out by phone and one was a face to face interview. As the first intent of the present work is to understand in depth the use of UML in practice, we were particularly interested by practitioners of UML. They come from a variety of backgrounds and with a range of expertise in UML. The interviews lasted approximately 30-60 minutes and began with a brief announcement of the goal of the study. We also introduced the fact that interviews would be anonymous and asked permission to record them. Then, we asked participants about their current position and level of experience with modeling using UML. We continued with questions about the situations of their use of UML to answer our first research question. That included the purposes of using UML, the activities done with UML diagrams, the employed diagrams, the reasons of using a particular © 2018 Tous droits réservés.. 11. lilliad.univ-lille.fr.
(23) Thèse de Yosser El Ahmar, Université de Lille, 2018. 2.2. THE QUALITATIVE STUDY. diagram, the sought information and the ways of using UML in a project from the beginning until the final steps. Then, we asked questions about their current use (or not) of the visual variables in practice. That concerned the identification of the utility of the visual variables in practice, the most used visual variables and the ways of their use. As for any semi-structured interviews, we have identified a number of topics that had to be covered in each interview. We also strongly encouraged participants to explain the details of their claims by pointing out that the minor detail is very important for our study. All the interviews have been conducted in a discussion mode where the interviewer followed the logic and the reasoning of the participants. Finally, the interviews were recorded and transcribed with the permission of the participants. Quantitative empirical study: Analysis of real UML models We manually analyzed how the visual variables were employed in + 3500 UML models related to open source projects in GitHub [3] [27]. Most of these diagrams are class diagrams, exactly 3328 class diagrams, 392 are sequence diagrams (The models repository is already biased towards structural (class) models [3]). That aims at gathering quantitative data that might reinforce the interviews results. To that end, we first began by identifying the visual variables that we would study, notably: the size, brightness, color, texture and orientation. Then, we manually classified the UML diagrams based on the visual variables they contain (In case of two or more visual variables, we created a new dedicated folder). For each visual variable (i.e., for each folder), we classified the diagrams according to the kind of its implementation to UML elements. In fact, we observed that each visual variable might be differently applied to them: on the border, text, background, edges, heads and/or compartments. We also differentiated significant visual variables variations and non significant ones. A visual variation is considered as significant if there are different categories of this latter in a same diagram (e.g., blue, green, red are different categories of the color visual variable). They mean that authors of the corresponding diagrams wanted to express an information using a particular visual variation. Such kind of variations is very important for our study. We will further concentrate on their analysis to understand in depth their use and answer our second research question. Non significant variation refers to the use of a single category of a visual variable (e.g., all the classes are yellow).. 2.2. The qualitative study. We have identified interviewees by searching practitioners who regularly use UML. We asked all our contacts in order to identify industrial practitioners who might be willing to be interviewed. We have first done an announcement on mailing lists containing potential practitioners of UML: Papyrus tool developers and users community. We have received two answers to that announcement. The first one has been discarded because the corresponding profile did not match with our target population. The second one was retained because he had the adequate target profile: practitioner and UML expert. Then, we sent direct mails to industrial experienced practitioners in the MDE community. We asked them to participate in our study or ask other potential people who might be interested and interesting for our study. We contacted eleven people, among them six accepted our request, one person suggested another one who he deemed more interesting for our study and who was retained, two people did not answer to our mails and finally two indirect contacts did not accept to participate in our study because © 2018 Tous droits réservés.. 12. lilliad.univ-lille.fr.
(24) Thèse de Yosser El Ahmar, Université de Lille, 2018. 2.2. THE QUALITATIVE STUDY. they were not experts and practitioners of UML. Below, it is an extract of an e-mail sent to the participants: “. . . .we are conducting an empirical study which aims at understanding in depth the use of UML in practice. As a result, adequate solutions can be provided to enhance the effectiveness of UML in real situations. In that context, we are searching for UML practitioners for a 30 minutes to one hour interview. If you have some time to discuss, please send me an e-mail to: [email protected]... I would like to emphasize that the collected data will be anonymous. . . .” In total, we carried out eight interviews with eight participants who are all experts and practitioners of UML. Roles of the interviewees range from1 the requirement manager (1), software architect (1), software designer (2), consultants (1), software engineers (1) and researchers (2). They work on different domains: transportation, aerospace engineering and defense, avionics, telecommunication, E-commerce, insurance and banking. Five hours and a half of interviews were recorded and manually transcribed.. 2.2.1. Analysis. Situations of the use of UML in practice Purposes of the use of UML The results of the qualitative study revealed that communication is ranked first among the usages of UML in practice. The eight participants have confirmed their use of UML diagrams as a communication vehicle. Communications might be held internally within the project teams or with costumers. This finding is also confirmed by the empirical studies that exist in this field like [21][18]. The next paragraph further focuses on our results about UML use in communications. The second purpose of using UML is code generation. This finding is contradictory with previous empirical studies [16] where code generation generally appears in the last ranges. However, that seems logic in our case because most of our interviewees are MDE approaches practitioners. They use models from early design steps until maintenance tasks. The third purpose of using UML is to draw the participant’s own understanding, in an informal way where UML diagrams are considered as a “map of the system”. That might be done using a pen and paper or on a white board. In such kind of use, participants do not care about the conformity of their diagrams to the UML standard. Their goal mainly concerns the comprehension of the system to be built and its conformity to the clients needs. Finally, UML diagrams are less employed for model execution and model analysis. UML and communications We asked our practitioners about their practices of using UML diagrams for communications. We distinguished two types of audiences: people who are familiar with UML (e.g., technical team) and non-familiar with UML (e.g. customers). We found out that none of our practitioners modify (i.e., contextualize) their diagrams for communications with people who are familiar with UML. They argue that all the stakeholders already know and understand the language. However, when it is about discussing with customers, they react differently (Figure 2.1). Most of the practitioners do not modify their diagrams but try to adapt their speech to the audience. Below, you will find two claims from our practitioners: “. . . We kind of read the diagram to them then we say our interpretation and they just hear what we say and they agree or not with that. . . ” (Transcript 3) 1. © 2018 Tous droits réservés.. The number in brackets refers to the number of participants having the corresponding role.. 13. lilliad.univ-lille.fr.
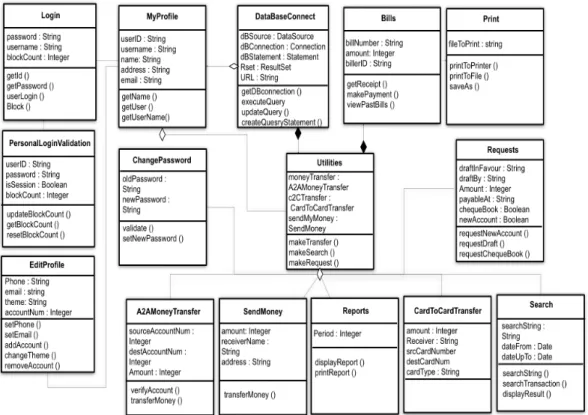
(25) Thèse de Yosser El Ahmar, Université de Lille, 2018. 2.2. THE QUALITATIVE STUDY. Don’t use UML Include textual info Adapt the speech Filter info. 1. 1,5. 2. 2,5. 3. Figure 2.1: Communications with non-familiars with UML. “I didn’t ask him to learn all of UML but like for the class diagram I would explain the class you know what the class is, the attributes and relationships that takes only a few minutes and then... the subject matter he is really familiar when he sees that these boxes as you know class called solution or column or pump and types of things that are easier to work with...” (Transcript 4) Other interviewees would prefer to filter some information from their diagrams to keep only those interesting for their communications. To that end, they omit technical details that don’t really matter to their customers. They try to keep diagrams simple to better communicate. “. . . we actually try to simplify as much as possible in our ... UML model because they aren’t UML experts so we try to filter out all. . . We try not to overload our diagrams with labels everywhere that non UML experts will not understand” (Transcript 7) Finally, one practitioner prefers not to use UML when discussing with people who are non familiar with UML. Generally, all our practitioners were aware of the unsuitability of UML for all types of communications. They try to find different manners to facilitate such use. Rare of the practitioners has mentioned the recurrent use of the visual variables to adapt the diagrams to communications. This fact is mainly due to problems with tools (see Section 6). Used UML diagrams Interviews showed that class diagrams and sequence diagrams are the most used in practice (Figure 2.2 below). Different reasons are given to justify the choice of such particular diagrams. A software engineer argues that the class diagram is the most expressive notation in UML for modeling data. A software designer uses the class diagram to have a design of the database. A software architect pointed out that the class diagram is used to divide the work among the different teams which are involved in a same project. Class diagrams are also employed to draw the business entities of the systems and to represent the functional relationships between these latter. Concerning the sequence diagrams, they are mainly used to define the interaction between the classes and interactions between users and the solution (i,e., the common definition of a sequence diagram). Sequence diagrams are also used in the definition of the white box part of a solution and to realize specific use cases. The use case diagrams and the state machines diagrams are ranked second among the most used UML diagrams in practice. The purpose of creating use case diagrams is to enumerate the functions to develop and to specify actors and the interactions between them. Eventually, this refers to the definition itself of a use case diagram. The © 2018 Tous droits réservés.. 14. lilliad.univ-lille.fr.
(26) Thèse de Yosser El Ahmar, Université de Lille, 2018. 2.2. THE QUALITATIVE STUDY. Interaction Components Interface Structure Activities State machines Use cases Sequence Class 1. 2. 3. 4. 5. Figure 2.2: UML diagrams used in practice. requirement manager justifies his use of the use case diagrams by the fact that such use is recommended by the safety requirement standard. Use cases are also used to drive the software engineer thinking and they will be part of the documentation. State machines are mostly used to design the behavior of the systems to be built or as an executable model. Activity and structure diagrams are the fourth most used diagrams by our practitioners. Activity diagrams are mostly seen as an elaboration of the use cases and a representation of the systems features. They are also used for the business process modeling and as a communication vehicle with customers. Then, on the last position, come the interface, component and interaction diagrams. These findings are coherent with previous empirical studies led in this area [16][18]. Pattern of UML use in practice We asked the interviewees to describe in detail their practices in using UML to build a system or a project. We analyzed the answers to this question and were able to identify a pattern of the use of UML by our interviewees. All of our practitioners begin with gathering the requirements from the customer. This might be done in a textual form or via a modeling session. “The three people working on the project for example, we interview users who want the system and we understand from them what the requirements are, then we translate these requirements. It is like we have a modeling session, we sit with them the three of us and we interview that, what do you imagine blablabla. And then we capture the use cases and we start populating a use case diagram...” (Transcript 3) At this level, the models serve as a support of communication with the customer and within the technical team members. This step allows our participants to draw the big picture of the systems to be built. One interviewee mentioned the advantages of representing the system in a visual form instead of text. “Drawing the system instead of writing is a good tool to communicate and share mind viewpoint. The vision goes more quickly, we can decide more quickly about the architecture, the architecting stuff.” (Transcript 6) Then, participants move to an understanding session where they review and check the requirements of the customer to ensure that they fit with their customer’s needs. “We want to represent the system as it is and we want to understand the needs may be to understand the way to go to the system to be. So we used different diagrams offered, provided by UML to draw the big picture of the – context to deeply understand what is the need.” (Transcript 6) To that end, they might need to go back to the customer and review the requirements in another modeling session. Once ensured that their models match well with the re© 2018 Tous droits réservés.. 15. lilliad.univ-lille.fr.
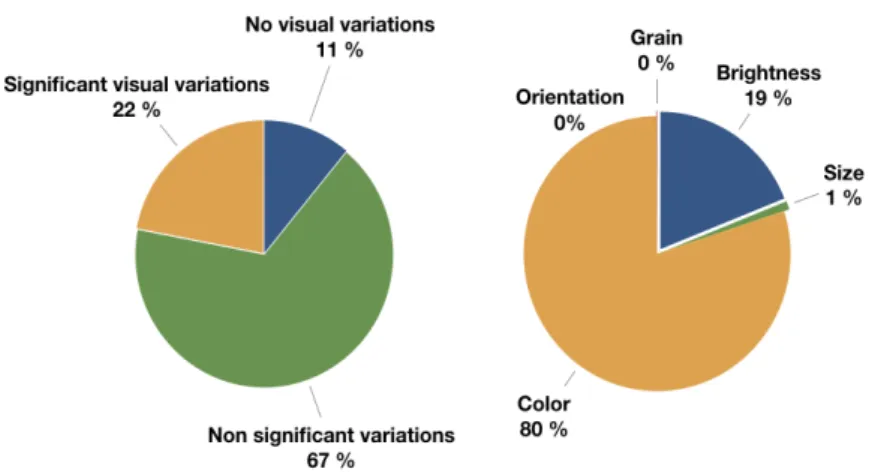
(27) Thèse de Yosser El Ahmar, Université de Lille, 2018. 2.2. THE QUALITATIVE STUDY. quirements of the customer, they split the work among the people who are involved in that project. To that end, UML might be employed as a discussion vehicle via the class and the use case diagrams. Finally, each participant continue to use UML for her/his particular needs: model simulation and execution where the models represent the code. They might generate code from them or continue coding the system and keep the created models in the documentation. In all cases, the models will populate the documentation which describes each project or system. To these ends, most of our practitioners use a modeling tool in their practice. One interviewee pointed out that the use of a modeling tool depends on his needs. If it is about gaining his own understanding of the system, he settles for a pen and paper. Otherwise, if it is about automation, he does use a modeling tool. Searched information We asked our practitioners about information they need to visualize in practice. We distinguish two types of information. The first one refers to the semantic information (i.e., what is modeled in a diagram). Below are examples of semantic information mentioned by our interviewees: • Input and output statements for the requirements: the interviewee who mentioned this semantic information is a requirement manager. In her/his practice, she/he begins first by gathering the requirements from the customer. Second, she/he reviews the requirements and draws the use case and the state machine diagrams to build her/his own understanding. Then, she/he reviews the requirements. For that, she/he needs to check if the input requirements that are given by the customer correspond to the output requirements that are represented in the use case and the state machine diagrams. • The communication between the objects in a sequence diagram: the UML practitioner visually navigates in her/his sequence diagram to see the messages that are exchanged between the objects of her/his system. Such visualization helps her/him understanding the logic of those communications. • The concerns of each subsystem: the UML practitioner wants to see the functionalities of each group of elements in her/his UML diagrams. For example, a subsystem of an e-learning platform concern the users management and another one concerns the database management. • The calls of functions between the diagrams of a model: the UML practitioner needs to visualize the relationships between different views of an UML model. For example, she/he navigates between an UML class and its behaviour in the state machine diagram. • The interactions of a practitioner’s own system with the other subsystems: the UML practitioner needs to see the communication of his subsystem with the other practitioners subsystems. Such visualization helps her/him updating her/his subsystem when a new interaction to it is created or updated. • References for specific signals or events in the model: the UML practitioner needs to find the elements that reference other ones in her/his UML diagrams. Second, we find what we call extra-semantic information. It consists in non-semantic information but which can be extracted from an UML model. Examples of extrasemantic information are: © 2018 Tous droits réservés.. 16. lilliad.univ-lille.fr.
(28) Thèse de Yosser El Ahmar, Université de Lille, 2018. 2.2. THE QUALITATIVE STUDY. • Level of implementation of the classes: the UML practitioner needs to see the classes that are already implemented, those that are in progress and finally the classes that are not yet implemented. • Bugs in the model in the case of model execution: before executing her/his UML diagram, the UML practitioner checks his diagram through model validation. As a result, she/he can visualize the existing bugs (e.g., with red markers) and fix them. We observe that practitioners need to visualize information on their diagrams. Before going to the documentation, UML diagrams are subjects of many visualizations where practitioners need to search for important information to accomplish their tasks. If we link this finding to the previous results about the purposes of using UML in practice, most of the searched information belong to the “drawing of understanding” purpose: The practitioners visually navigate in their diagrams to find accurate information to build the mental map of their systems or projects. The visual variables in practice This subsection analyzes the answers of the practitioners about the second research question: the use of the visual variables in practice. We first begun by asking our interviewees about details of their use (or not) of color in practice. Then, we asked them about their alternative means in case they have color-blind people in their teams. It allowed us to introduce our question about the use of the other visual variables (i.e., size, brightness, texture/grain, orientation). We presented a brief presentation of each visual variable if necessary. Color We asked our practitioners about their need for colors in practice and about examples of information they needed to highlight using them. Again, we distinguish two types of information: semantic information and extra-semantic information. Only two semantic information were mentioned by one single practitioner: • Important features like inheritance • Elements which have the same semantic like interfaces Most of the interviewees used color to highlight extra-semantic information. The progress of the implementation of classes has been mentioned by three practitioners. They want to visualize the progress of the development of their classes directly on the diagrams. Examples of extra-information are mentioned below: • Role in the design (criticality, parts of patterns (especially MVC), parts of layers, levels of security). • Status in development (progress in implementation, testing, execution). • Distribution of tasks between the stakeholders (ownership of each class). Besides, one practitioner mentioned that color must not be used to highlight semantic information. He argues that the diagram should be understood without coloring because colors might disappear in case of black and white printing. “We have discussed and said that we should avoid coloring. At least if the colors have © 2018 Tous droits réservés.. 17. lilliad.univ-lille.fr.
(29) Thèse de Yosser El Ahmar, Université de Lille, 2018. 2.2. THE QUALITATIVE STUDY. a specific semantic I mean you should be able to understand the diagram without the colors we can’t put any semantic meaning into the colors because if you lose the colors when you print into black and white printers I mean it is pretty fundamental to still have the same semantic of the diagram”. (Transcript 5) Furthermore, we observe that most of the examples of the highlighted information using color are “selective” information: Practitioners want to highlight UML nodes belonging to a same group (e.g., MVC elements, elements that have the same semantics) together. They may occasionally use colors for “ordered” information (e.g., progress of implementation, important features).. No. Yes but problems with tools. Yes 1. 1,5. 2. 2,5. 3. Figure 2.3: Utility of colors in practice. Utility of colors in practice We asked our practitioners if the previously mentioned use of color has been helpful. We found out that most of them agree on the added value of colors and that their use was helpful in practice. Figure 2.3 details the answers of the participants 2 . Three interviewees totally agree on the utility of colors in practice. The same number of interviewees confirm that colors are helpful in practice but there are problems with modeling tools that hamper such use. Besides, they express their need for an automatic and efficient tool and propose some recommendations that will be discussed in Section 6. One interviewee stresses on the fact that colors are helpful but only for communications. The use of color In the case of the use of colors, we wanted to understand how practitioners do chose them. We found out that only two practitioners use some internal conventions of their companies. Below are examples of conventions used within two different companies: “Non-tested functions: Blue; safety functions: yellow. . . ” (Transcript 1) “To communicate the green means we have it, yellow means in progress, red means we –“ (Transcript 3) The majority of interviewees do not have internal conventions, they follow their own tastes. “In my domain which are in general embedded systems we can use blue for that software functional related, I use orange for everything that software platform related to framework system, drivers, etc and red for everything that is material, hardware related.” (Transcript 7) “I avoid red because red means mistake and green is nice because it means correct.” 2. © 2018 Tous droits réservés.. With one missing answer.. 18. lilliad.univ-lille.fr.
Figure


+7
Documents relatifs