HAL Id: inserm-00194347
https://www.hal.inserm.fr/inserm-00194347
Submitted on 6 Dec 2007
HAL is a multi-disciplinary open access
archive for the deposit and dissemination of
sci-entific research documents, whether they are
pub-lished or not. The documents may come from
teaching and research institutions in France or
abroad, or from public or private research centers.
L’archive ouverte pluridisciplinaire HAL, est
destinée au dépôt et à la diffusion de documents
scientifiques de niveau recherche, publiés ou non,
émanant des établissements d’enseignement et de
recherche français ou étrangers, des laboratoires
publics ou privés.
An automated myocardial segmentation in cardiac MRI.
Racha El Berbari, Isabelle Bloch, Alban Redheuil, Elsa Angelini, Elie
Mousseaux, Frédérique Frouin, Alain Herment
To cite this version:
Racha El Berbari, Isabelle Bloch, Alban Redheuil, Elsa Angelini, Elie Mousseaux, et al.. An
auto-mated myocardial segmentation in cardiac MRI.. Conference proceedings : .. Annual International
Conference of the IEEE Engineering in Medicine and Biology Society. IEEE Engineering in Medicine
and Biology Society. Annual Conference, Institute of Electrical and Electronics Engineers (IEEE),
2007, 1, pp.4508-11. �10.1109/IEMBS.2007.4353341�. �inserm-00194347�
An automated myocardial segmentation in cardiac MRI
R. El Berbari, I. Bloch, A. Redheuil, E. Angelini, E. Mousseaux, F. Frouin and A. Herment
Abstract— In this paper we present an automatic approach
to segment Cardiac Magnetic Resonance (CMR) images. A preprocessing step that consists in filtering the image using connected operators (area opening and closing filters) is applied in order to homogenize the cavity and solve the problems due to the papillary muscles. Thereby the GVF snake algorithm is applied with one point clicked in the cavity as initialization and an optimized tuning of parameters for the endocardial contour extraction. The epicardial border is then obtained using the endocardium as initialization. The performance of the proposed method was assessed by experimentation on thirty-nine CMR images. A high agreement between manual and automatic contours was obtained with correlation scores of 0.96 for the endocardium and 0.90 for the epicardium. Overlapping percentage, mean and maximum distances between the two contours show a good performance of the method.
I. INTRODUCTION
Over the last decade, cardiovascular diseases are the leading cause of death in the world. Many techniques are available to diagnose heart diseases. CT, Nuclear Medicine, Ultrasound and MRI are the most common cardiac imaging techniques. The main advantage of MRI compared to other techniques is its ability to study in only one examination the contraction and the viability through first-pass perfusion and delayed enhancement. Thanks to its precision, MR has proven its superiority over nuclear methods particularly in the detection of sub endocardial necrosis. Moreover it is non-invasive with an excellent spatial resolution of the contraction data, and an increasing time resolution thanks to the recent advent of fast imaging sequences.
Consequently, CMR image analysis has become an active field of research. To help with the diagnosis of cardiovascular pathologies, physicians are interested in identifying the heart chambers, the endocardium and epicardium, and measuring ejection fraction and wall thickening properties over the cardiac cycle. An inevitable step before pursuing any kind of quantitative or functional analysis is the segmentation of cardiac structures. Challenges in segmenting cardiac Mag-netic Resonance (CMR) images are multiple. First, It is not easy to define the endocardium simply as the boundary between the myocardium and the blood pool, because of
R. El Berbari is with INSERM U678, UPMC, F-75013 Paris France and GET, ENST TSI Department, CNRS UMR 5141, F-75013 Paris France [email protected] Tel: (+33) 153828423 Fax: (+33) 153828448
I. Bloch and E. Angelini are with GET, ENST TSI Department, CNRS UMR 5141, F-75013 Paris France
A. Redheuil and E. Mousseaux are with APHP, HEGP Department of Cardiovascular Radiology, F-75015 Paris France and INSERM U678 UPMC, F-75013 Paris France
F. Frouin and A. Herment are with INSERM U678, UPMC, F-75013 Paris France
wrong contours that can be induced by the heterogeneities in the cavity. Moreover, the presence of papillary muscles should not be ignored, the endocardial segmentation should include them into the cavity. Secondly, the epicardium is even more difficult to be detected because of poor edge information in the image between the myocardium and the surrounding anatomical structures such as the liver. Finally, if the heart is surrounded by fat, the edge signal between the fat and the lungs is much stronger than the desired edge between the myocardium and the fat.
In an earlier work [1], our group explored the idea of segmenting cine images with high contrast between cavity and myocardium, and used the results on DE images for myocardial infarct transmurality quantification. Encouraging results obtained in this feasibility study constitute a motiva-tion to pursue this idea and improve the segmentamotiva-tion step making it more robust and automatic. In [2], the endocardial delineation step was improved in order to overcome problems with papillary muscles and poor homogeneity of the cavity due to blood flow. In this paper the segmentation process is extended to the epicardial border.
A long history of publications on the segmentation of cardiac MR images exists. The method proposed in [3] was able to delineate the borders of the myocardium using non-rigid registration in polar coordinates and to propagate a manual segmentation of a single phase through the dynamic sequence. Some methods use a clustering technique [4] based on grey levels to detect the endocardial border. However including the papillary muscles within the endocardial delin-eation remains a limitation for methods depending on grey level or gradient information. Although techniques using prior knowledge learned from images models to segment the left ventricle [5], as well as simultaneously the left and right ventricles [6] seem to be promising, results obtained by these techniques depend on the model that need manual tracing to be constructed. Moreover the important variation of size and shape of a pathological myocardium represents a challenge of the model construction. Deformable models have also been widely used for segmenting cardiac images [7], [8], [9], [10], [11]. Active contour models have been quite successful for segmenting the myocardium boundaries using CMR images. They still suffer from problems associated with weak gradients between the myocardium and adjacent anatomic structures such as papillary muscles and liver and are sensitive to initialization [12].
In this paper, a new automated approach for myocardial segmentation on CMR acquired with fast imaging employing steady state acquisition (FIESTA) sequences is presented, and evaluated by comparison with manual tracing for clinical
Proceedings of the 29th Annual International Conference of the IEEE EMBS
Cité Internationale, Lyon, France August 23-26, 2007.
use.
II. METHOD
A. Data acquisition
The CMR datasets were acquired at the European Hospital Georges Pompidou (HEGP), in the cardiovascular section, service of radiology. All studies were performed with the same 1.5-T MRI system (Signa LX, General Electric Medical Systems, Waukesha, WI, USA), using ECG gating with fiberoptic leads and a thoracic phased-array surface coil for radiofrequency signal detection. Thirteen subjects were studied; for each patient, three FIESTA short axis slices were selected at the basal, middle and apical levels of the left ventricle with the following parameters: flip angle 40◦, TE 2
ms, TR 5 ms, slice thickness 8 mm, time resolution 60 ms.
B. Image Preprocessing
Endocardial delineation encounters a primordial difficulty due to problems with papillary muscles and the poor homo-geneity of the cavity. In a first step, a cavity surface including the papillary muscles is sought, to be then used to extract the epicardial contour. A preprocessing consists in filtering the original image using alternately opening and area-closing filters in order to include the papillary muscles into the cavity and to homogenize it. The goal of such filtering is to produce an image that consists mostly of flat and large regions. Connected operators like area opening and closing are useful in such cases. The area opening of an image I, with scale parameter λ, is defined as the image containing connected components of I with area larger than λ. The area closing is defined by duality. An algorithm developed by Meijster and Wilkinson is used to implement these filters on CMR images. The filtering algorithm is detailed in [13]. Applied on CMR images, regions constituting the papillary muscles corresponding to sets of low grey level are merged completely with the blood cavity zone corresponding to a higher grey level set.
C. Endocardial Delineation
Pre-filtering the original image is performed with different values of λ varying from 100 to 600 for apical level slices, and from 500 to 1500 for the two middle and basal slices. A series of approximate contours segmenting the whole cavity including papillary muscles is obtained for each λ value by applying the GVF snake algorithm [14] on an edge map obtained by applying the Canny edge detector on the filtered image and one point clicked into the cavity as the snake initialization. Five parameters control the deformation process of the snake: α and β, that control respectively the elasticity of the contour and its rigidity, κp and κ that are
weights of a pressure force P orthogonal to the contour and a Gradient Vector Flow force, respectively, and µgvf that is
the regularization parameter of the GVF. The whole set of images was processed using the same values of the snake parameters [2]. A high value of the rigidity parameter β at this first step can guarantee a rigid contour.
Fig. 1. Plot of the ratio Riin function of λ.
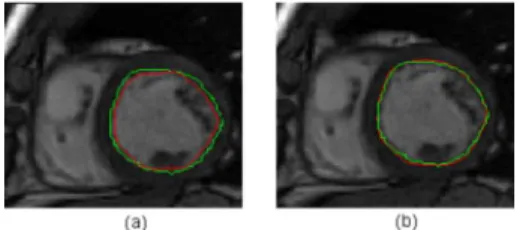
Fig. 2. Left: superposition of the first approximate contour (red) and the manual contour (green). Right: the final segmentation (red) and the manual one (green).
For each value of λ, a ratio Ri between the area delimited
by the resulting segmentation and λ is calculated.
The optimal value of λ, providing the optimal contour including papillary muscles is chosen so as to have Ri
minimum (Figure 1). We should note that this minimum is always close to 1, which means that the segmentation result approximately corresponds to one of the flat zones of the filtered image. This constraint enables an automatic setting of λ which is adapted to the individual patient’s morphology. This first segmentation is close to the true contour, but frequently it is interior to it with a distance up to two or three pixels. So it is used to initialize a second snake with an edge map obtained by multiplying the gradient of the original image by a mask keeping only information between the first obtained contour and its dilation of three pixels. In this step, lower values of β, κpand µgvf are used, allowing
to adjust the contour and encroach on small details of the cavity’s boundary referring to the gradient information in the image to segment. Figure 2 depicts the superposition of the manual contour (green) with the obtained contour (red) for the two steps.
D. Epicardial Delineation
The left-ventricle cavity is now detected for each slice. In order to detect the epicardial contour, a gradient profile on the filtered image is computed. The center of the cavity obtained above is detected automatically as the barycenter of the left ventricle area and then used to draw an horizontal half line toward the right ventricle through the ventricular septum. According to the orientation of the processed images, this
Fig. 3. Approximation of the myocardium thickness. (a) Gradient of the filtered image, (b) gradient profile of the filtered image.
horizontal half line is sufficient to approximate the myocar-dial thickness (Figure 3a). The gradient profile along this half line is computed on the filtered image (Figure 3b). The myocardial thickness is calculated as the distance between the two maximum peaks from the LV center. An approximate epicardial radius Depi is estimated as:
Depi= Dc+ T hm (1)
where Depi (respectively Dc) is the distance from the cavity
center and the epicardium (respectively the endocardium) through the half line drawn above.
As the geometric form of the epicardium is not exactly a circle, and it is not separated by strong edges from the anatomical structures surrounding it, it will be difficult to recover it using exactly Depi. The epicardial contour will
be sought in the region of distance D from the cavity center, tolerating some more pixels d beyond Depi, as in
the equation below:
D = Depi+ d (2)
An edge map is computed by applying a mask on the gradient of the original image keeping only information between the endocardial border and its dilation of T hm+ d pixels. The
GVF snake algorithm is then applied using this edge map with the endocardial contour as snake initialization.
III. RESULTS
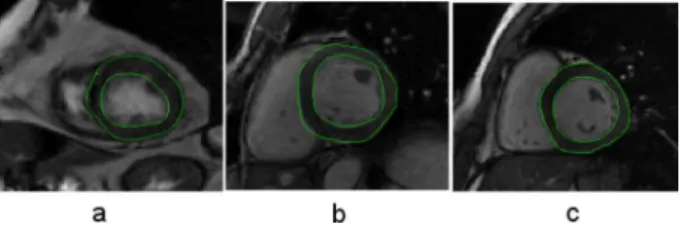
This method was tested on a total of thirty nine FIESTA images taken at the end-diastolic (ED) phase of the cardiac cycle. The segmentation illustrated in Figure 4 shows good visual results. In order to validate the resulting segmentation, the agreement between manual and automatic data analysis was assessed on epicardial and endocardial contours, as reported in Table I, based on overlap percentage, maximum and mean distances between the two contours. In general an over-estimation was obtained for the epicardial segmentation, which can be explained by two points: first the contrast between the fat surrounding the heart and the lungs is much
overlap percentage dist max dist mean Epicardium 87.4% ± 7 3.4 ± 1.2 1.3 ± 0.7 Endocardium 90.7% ± 5 2 ± 0.7 0.6 ± 0.3
TABLE I
AGREEMENT BETWEEN MANUAL AND AUTOMATIC SEGMENTATIONS FOR BOTH ENDOCARDIAL AND EPICARDIAL BORDERS
Fig. 4. Results of the automatic segmentation shown for (a) apical level, (b) median level and (c) basal level slices.
stronger than the desired edge between the myocardium and the fat, secondly there are almost no edges between the myocardium and the liver. Linear regression analysis was also performed on both manual and automatic epicar-dial surfaces as shown in Figure 5 to visualize the error distribution. Good correlation scores were obtained when comparing the automatic segmentation to the manual tracing for both the epicardium (R2= 0.899) and the endocardium (R2 = 0.964). Results obtained on the epicardium are not as good as the endocardium results. Errors are mainly due to the lack of edges surrounding the myocardium and to the low area measures in the presence of very thin myocardial walls. This is the case for the outlier point on the regression plot of the epicardium. It corresponds to an apical slice of a dilated myocardiopathy where the myocardium is very thin and the LV cavity is widely expanded.
Fig. 5. Linear regression analysis on endocardial (R2 = 0.964) and
IV. DISCUSSION AND CONCLUSION In this paper, a 2D segmentation approach for myocardial surface detection on CMR images is described. The general-ization to 3D data is theoretically simple using a 3D version of the algorithms, but should deal with anisotropic volumes and the grey level variation between different level slices, due to blood flow, problems of breathing and trough- plane motion [5]. Therefore processing 2D multilevel data seems more appropriate for clinical applications where the standard heart model of 17 segments is used. Being robust to papillary muscles and inhomogeneities within the cavity, this approach delineates completely the endocardial surface including the papillary muscles, and then extracts the epicardial surface. For the endocardial delineation, area opening and closing filters were used to merge zones corresponding to papillary muscles into the cavity. Setting the morphological parameter
λ was done automatically in such a way that it is adapted
to the individual patient’s morphology. Applying the GVF snake algorithm to the filtered images provided a rough contour in the first step that was refined in the second one according to the gradient information of the original image. An accurate segmentation of the cavity including the papillary muscles was thus obtained. An important issue with the segmentation concerns the parameters setting. In the endocardial segmentation process, snake parameters were optimized and fixed at the same values for all processed images. Setting the initialization was simply done by clicking one point inside the cavity, getting through the susceptibility of snake to initialization. The epicardial delineation consists of two steps, the approximation of a research zone and the segmentation using the GVF algorithm. A myocardial thickness is first estimated by computing the profile of a half line going from the cavity center, obtained automatically as the barycenter of the endocardial area toward the right ventricle on the gradient of the filtered image. The research zone is then represented by the dilation of the endocardium of a distance that takes into account the endocardial ra-dius, the estimated myocardial thickness and a tolerance distance beyond the epicardium. Facing the difficulty of segmenting the epicardium due to the lack of edges between the myocardium and surrounding anatomical structures, the tolerance distance allows gathering more gradient informa-tion around the myocardial border. Once the search zone is obtained, the GVF algorithm is applied using a masked edge map and the endocardial contour as initialization. For this step, parameters are optimized as α = 1 , β = 40, κ = 1.8,
κp= 0.4 and µgvf = 0.1 for apical slices and µgvf = 0.4 for
mid-ventricle and basal slices. The mask parameter d, that controls at which distance from the endocardium gradient information is exploited, is set to d = 3 for all the analyzed images. However, for some slices, this parameter needs to be modified. It should be noted that adapting d is easy and not tedious for a clinician unlike tuning the snake parameters. For the evaluation, similarity area measures and distances between the resulting segmentation and the manual tracing were computed for both endocardium and epicardium. The
evaluation parameters show that segmenting the epicardial border is more difficult then the endocardial border due to the lack of gradient information between the myocardium and surrounding structures. Moreover the edges between the fat and the lungs is much stronger than the desired edge between the myocardium and the fat.
For future work, a first idea will be to extend this approach as it seems simple to use to segment the right ventricle, where preliminary tests have shown encouraging results. This segmentation could be used to verify the epicardial delineation and detect errors such as overlap between the two segmentations. Then an important step will be to apply this approach on a larger data set containing FIESTA and Delayed Enhancement (DE) images for each patient. Segmentation will be done on FIESTA images, and projected on DE images for myocardial infarction quantification.
REFERENCES
[1] El Berbari, R., Kachenoura, N., Redheuil, A., Bloch, I., Mousseaux, E., Frouin, F.: ”Using cine MR images to evaluate myocardial infarct transmurality on delayed enhancement images”. IEEE International
Symposium on Biomedical Imaging: From Nano to Macro, 2006 pp
145-148.
[2] El Berbari, R., Bloch, I., Redheuil, A., Angelini E., Mousseaux, E., Frouin, F., Herment A.: ”Automated Segmentation of the Left Ventricle including Papillary Muscles in Cardiac Magnetic Resonance Images”.
FIMH LNCS, vol 4466, 2007 pp 453-462.
[3] Noble, NMI., Hill, DLG., Breeuwer, M., Schnabel, J., Hawkes, D., Gerritsen, FA., Razavi, R.: ”Myocardial delineation via registration in a polar coordinate system”. MICCAI LNCS, vol. 2488, 2002 pp 651-658. [4] Lynch, M., Ghita, O., Whelam, PF.: ”Automatic segmentation of the left ventricle cavity and myocardium in MRI data”. Comput Biol Med, vol:36, 2006 pp 389-407.
[5] Kauss, MR., Berg, JV., Niessen, W., Pekar, V.: ”Automated segmenta-tion of the left ventricle in cardiac MRI”. MICCAI, LNCS, vol. 2878, 2003 pp 432-439.
[6] Makela, T., Pham, QC., Clarysse, P., Nenonen, J., Lotjonen, J., Sipila, O., Hanninen, H., Lauerma, K., Knuuti, J., Katila, T., Magnin, IE.:”A 3D model based registration approach for the PET, MR and MCG cardiac data fusion”. Med Imag Ana, vol. 7, 2003 pp 377-389.
[7] Pluempitiwiriyawej, C., Moura, JM., Fellow, Wu, YJ., Ho, C.: ”STACS: new active contour scheme for cardiac MR image segmentation”. IEEE
Trans Med Imag, vol. 24, 2005 pp 593-603.
[8] Graves, MJ., Berry, E., Eng, AA., Westhead, M., Black, RT., Beacock, DJ., Kelly, S., Niemi, P.: ”A multicenter validation of an active contour-based left ventricular analysis technique”. J Magn Reson Imaging, vol. 12, 2000 pp 232-239.
[9] Garcia de Pablo, MM., Malpica, N., Ledesma-Carbayo, MJ., Jim´enez-Borreguero, LJ., Santos, A.: ”Semi automatic estimation and visualiza-tion of left ventricle volumes in cardiac MRI”. Computers in Cardiology, vol. 32, 2005 pp 399-402.
[10] Tanki, N., Murase, K., Kumashiro, M., Momoi, R., Yang, X., Tabuchi, T., Nagayama M., Watanabe Y.: ”Quantification of left ventricular volumes from cardiac cine MRI using active contour model combined with gradient vector flow”. Magn Reson Med Sci, vol. 4, 2005 pp 191-196.
[11] Jolly, MP.: ”Automatic segmentation of the left ventricle in cardiac MRI and CT images”. Int J Comput Vis, vol. 70, 2006 pp 151-163. [12] Santarelli, M.F., Positano, V., Michelassi, C., Lombardi, M., Landini,
L.: ”Automated cardiac MR image segmentation: theory and measure-ment evaluation”. Med Eng Phy, vol. 25, 2003 pp 149-159.
[13] Meijster, A., Wilkinson, MHF.: ”A comparison of algorithms for connected Set Openings and Closings”. IEEE Trans Patt Anal Mach
Intell, vol. 24, 2002 pp 484-494.
[14] Xu, C., Prince, JL.: ”Snakes, Shapes, and Gradient Vector Flow”. IEEE
Trans Med Imag, vol. 7, 1998 pp 359-369.