This is an author-deposited version published in : http://oatao.univ-toulouse.fr/ Eprints ID : 7939
To link to this article : DOI: 10.1108/03321641211209807 URL : http://dx.doi.org/10.1108/03321641211209807
O
pen
A
rchive
T
OULOUSE
A
rchive
O
uverte (
OATAO
)
OATAO is an open access repository that collects the work of Toulouse researchers and makes it freely available over the web where possible.
To cite this version :
Jaafar, Amine and Sareni, Bruno and Roboam, Xavier Clustering analysis of railway driving missions with niching. (2012) COMPEL: The International Journal for Computation and Mathematics in Electrical and Electronic Engineering, vol. 31 (n° 3). pp. 920-931. ISSN 0332-1649
Any correspondence concerning this service should be sent to the repository administrator: staff-oatao@listes.diff.inp-toulouse.fr!
Clustering analysis of railway
driving missions with niching
Amine Jaafar, Bruno Sareni and Xavier Roboam
LAPLACE UMR CNRS-INPT-UPS, Universite´ de Toulouse, Toulouse, France
Abstract
Purpose – A wide number of applications requires classifying or grouping data into a set of categories or clusters. The most popular clustering techniques to achieve this objective are K-means clustering and hierarchical clustering. However, both of these methods necessitate the a priori setting of the cluster number. The purpose of this paper is to present a clustering method based on the use of a niching genetic algorithm to overcome this problem.
Design/methodology/approach – The proposed approach aims at finding the best compromise between the inter-cluster distance maximization and the intra-cluster distance minimization through the silhouette index optimization. It is capable of investigating in parallel multiple cluster configurations without requiring any assumption about the cluster number.
Findings – The effectiveness of the proposed approach is demonstrated on 2D benchmarks with non-overlapping and overlapping clusters.
Originality/value – The proposed approach is also applied to the clustering analysis of railway driving profiles in the context of hybrid supply design. Such a method can help designers to identify different system configurations in compliance with the corresponding clusters: it may guide suppliers towards “market segmentation”, not only fulfilling economic constraints but also technical design objectives.
Keywords Genetic algorithms, Cluster analysis, Data management, Clustering, K-means, Silhouette index, Niching genetic algorithms, Railway locomotive, Driving missions Paper type Research paper
1. Introduction
Generally, system design methods are strongly coupled with “environmental variables” as wind or solar irradiation, respectively, for wind and photovoltaic systems and with driving mission parameters for embedded and transportation applications. More particularly, the design of a hybrid electrical locomotive requires taking into account at a system level couplings between architecture, sizing, energy management strategy and environment (Akli et al., 2009). For such devices, the system environment is associated with specific power driving profiles that have to be provided by all energy sources. These profiles contain a wide number of features related to the system sizing, efficiency and lifetime which can be represented by specific indicators (e.g. maximal and average mission powers, statistical indices associated with the mission power distribution...). Integrating these indicators in the design process is not straightforward because of the important number of driving missions than can be imposed to the locomotive. Note that the same issue applies for other transportation applications, especially for electric and hybrid vehicles. For this purpose, cluster analysis methods can be useful in order to find the most “representative” driving missions among the set of accessible data. Such methods can help designers to identify different system configurations in compliance with the corresponding clusters: it may guide suppliers towards “market segmentation” not only fulfilling economic constraints but also technical design objectives. In this
paper, a clustering method based on a niching genetic algorithm (GA) is presented for data partitioning. Instead of K-means clustering methods (Xu and Wunsch, 2005) which require the a priori setting of the number of clusters for minimizing a similarity metrics (typically the sum of the distance of the points from their cluster centroids), the proposed algorithm aims at simultaneously finding the appropriate number of clusters and the correct classification of the dataset. It consists in optimizing a partition criterion (e.g. the silhouette index) which emphasizes the compactness of intra-cluster and the isolation of inter-cluster. Because of the multimodality feature of data clustering, the use of niching GAs (Sareni and Kra¨henbu¨hl, 1998) is recommended to avoid premature convergence. The remainder of the paper is organized as follows. Section 2 describes in more details the niching GA used for data clustering problems. This algorithm is then applied in Section 3 to datasets with non-overlapping or overlapping clusters and in Section 4 to the analysis of railway driving profiles. Conclusions are finally presented in the last section. 2. Clustering with niching GAs
2.1 Individual representation
Most of genetic-based clustering methods use binary string or real parameters encoding, representing the membership or permutation between data objects ( Jain et al., 1999). Nevertheless, this representation is not suitable for large datasets due to the excessive length of the chromosomes. A most effective solution consists in directly encoding the cluster centroids into the chromosome (Maulik and Bandyopadhyay, 2000). The dataset partitioning is carried out according to the encoded clusters. Moreover, in order to investigate configurations with varying clusters, the number of clusters should also be added as a gene to the chromosome. Then, two different encoding strategies can be adopted for integrating the cluster centroid positions (Figure 1):
(1) Variable-length chromosome encoding. After the initialization of the gene associated with the number of clusters, the chromosome can be constructed by adding random variables representing the corresponding cluster positions. This encoding leads to individuals with variable-length chromosomes (according to the cluster number) and requires implementing specific crossover operators capable of recombining such chromosome configurations.
(2) Fixed-length chromosome encoding. The other alternative consists in using the same chromosome size for all individuals in the population. The chromosome length is set according to the maximum number of clusters. The upper bound of the number of clusters is generallypffiffiffin(Pal and Bezdek, 1995) where n denotes the number of elements in the dataset. With this strategy when the number of clusters determined by the first gene is lower than the maximum number of clusters, some genes can be considered as “recessive”. They are not used in the individual decoding but participate to crossover and mutation operations. It should be noted that all genes including the number of clusters undergo these genetic operations. Because of its simplicity, this strategy has been preferred to the variable-length chromosome encoding. Moreover, the use of recessive genes in association with niching operators increases population diversity, particularly the exploration of clustering configurations with variable number of clusters.
2.2 Data partitioning
Considering a particular individual obtained from the initialization step or resulting from genetic operators, each element of the dataset is assigned to the nearest cluster centroid located in the corresponding chromosome. After this step, some clusters represented by their centroids in the individual chromosome may be empty (i.e. no element in the dataset has been assigned to those clusters). In this case, the current number of clusters in the dataset is lower than the value of the associated gene in the individual chromosome. A repairing operator can be applied in order to modify the chromosome features according to the dataset assignment. This operator consists in replacing the gene value associated with the cluster number in the chromosome with the current cluster number in the dataset. Moreover, centroid positions related to empty clusters are shifted at the end of the chromosome.
2.3 Fitness computation: silhouette width calculation
The individual fitness is then obtained using a partition criterion which aims at emphasizing the compactness of intra-cluster and the isolation of inter-cluster. Such optimization criterion leads to an optimal tradeoff between the inter-cluster distance maximization and the intra-cluster distance minimization and consequently the correct Figure 1.
Chromosome encoding depending on the number of clusters Nbr of clusters 1st cluster position 2nd cluster position 3rd cluster position 2 3 (a) Nbr of clusters 1st cluster position 2nd cluster position 3rd cluster position 4th cluster position n cmax cluster position 2 … … … … 3 …
“Dominant” genes “Recessive” genes
… …
(b)
Notes: (a) Variable-length chromosome encoding; (b) fixed-length
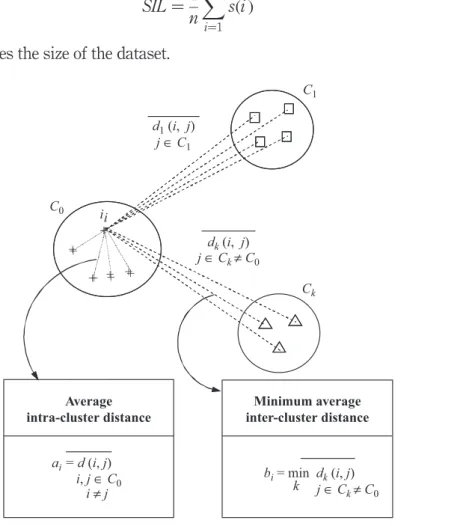
classification of the dataset. Many partition criteria measuring the quality of the clusters can be found in Bolshakova and Azuaje (2003), Milligan and Cooper (1985) and Sheng et al. (2005). Most popular are the Davies-Bouldin index, the Calinski and Harabasz criterion and Dunn’s functions. In this study, the use of the silhouette measure (Rousseeuw, 1987) has been chosen for quantifying the individual fitness. The silhouette method assigns to each element i of the dataset a quality index s(i ) known as the silhouette width and defined as:
sði Þ ¼ bi2 ai maxðbi; aiÞ
ð1Þ where aiis the average distance between i and all other elements in the cluster to which
i belongs and bi denotes the minimum average distance between i and the elements belonging to another cluster (Figure 2).
When a s(i ) is close to 1, it indicates that the element i is well clustered (i.e. assigned to the appropriate cluster). If s(i ) is about 0, it suggests that the elements i could also be assigned to a neighboring cluster. Finally, when s(i ) is close to 21, we can conclude that this element has been misclassified. The overall average silhouette width SIL used for representing the individual fitness, is the average of s(i ) over all elements i of the dataset:
SIL¼ 1 n X n i¼1 sði Þ ð2Þ
where n denotes the size of the dataset.
Figure 2. Illustration of aiand bi coefficients in the silhouette width computation + + + + i + C0 C1 Ck dk(i, j) j ∈ Ck≠ C0 d1(i, j) j ∈ C1 i ≠ j i, j ∈ C0 ai = d (i, j) k Average intra-cluster distance j ∈ Ck≠ C0 bi= min dk(i, j) Minimum average inter-cluster distance + + + + i +
2.4 Restricted tournament selection with self-adaptive recombination
Because of the multimodality feature of data clustering, the use of a niching GA (Sareni and Kra¨henbu¨hl, 1998) is recommended to avoid premature convergence. In this work, we employ the restricted tournament selection (RTS) (Harik, 1995). RTS adapts standard tournament selection for multimodal optimization. It initially selects two elements from the population to undergo crossover and mutation. After recombination, a random sample of individuals is taken from the population as in standard crowding. Each offspring competes with the closest sample element. The winners are inserted in the population. This procedure is repeated N/2 times, N denoting the population size. Our RTS-based clustering algorithm uses a self-adaptive recombination scheme (Nguyen-Huu et al., 2008) based on vSBX, PNX and BLX crossovers.
2.5 K-means hybridization
K-means (MacQueen, 1967) is the best known squared error-based clustering algorithm. It aims at minimizing mean square error (MSE) defined as the sum of squared Euclidean distances between the dataset elements and the cluster centroids. Let xibet the set of n elements, ncthe number of clusters and mkthe centroid of cluster Ck, the MSE can be expressed as:
MSE¼ 1 n X nc k¼1xi[Ck X xi2 mk k k2 ð3Þ
K-means randomly initializes nc cluster centroids inside the hypervolume containing
the dataset. After this initialization step each element of the dataset is assigned to the nearest cluster centroid. Then, cluster centroids are recomputed according to the current partition. The procedure is repeated until convergence.
In order to accelerate the convergence speed of the RTS-based clustering algorithm, it is recommended to use one K-means iteration for all individuals created from genetic operators (Sheng et al., 2005). This can be done by assigning each data elements to the nearest cluster centroid in the corresponding chromosome. After this partition step, cluster centroids are recomputed and updated in the chromosome. It should be noted that the repairing operator is eventually applied at this step to remove empty clusters. 3. Experiments on benchmark datasets
Three 2D-clustering benchmarks are used in order to assess the effectiveness of the proposed algorithm. The characteristics of the corresponding datasets are summarized in Table I. The first benchmark S0 is composed of 200 elements distributed in 12
unequally spaced and non-overlapping clusters (Figure 3(a)). The density of these clusters is non-uniform varying from 4 in the smallest cluster to 36 in the biggest. The two following benchmarks (S1 and S2) are taken from Fra¨nti and Virmajoki (2006).
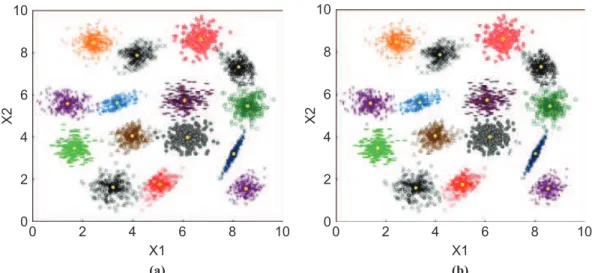
They consist in datasets containing 5,000 elements and 15 clusters with different degrees of overlapping (Figures 4(a) and 5(a)). The density and the space distribution of these clusters are quasi-uniform.
The niching GA with a population size of 100 is applied for maximizing the silhouette index relative to each benchmark datasets. Results obtained from a typical run on the S0dataset are shown in Figure 3. The silhouette index (Figure 3(b)) and the number of clusters (Figure 3(c)) are shown according to the number of generations.
It can be seen from this figure that the RTS-based clustering quickly indentifies the right number of clusters and the correct data partitioning. Figures 4 and 5 show the RTS results on S1and S2datasets, using the same population size and 300 generations.
For each figure, we compare the initial dataset and the corresponding partitioning with that obtained from the RTS run. Cluster centroids are indicated by full circles. In both Dataset
No. of data
No. of
clusters Cluster sizes
Type of data
Overall average silhouette width S0 200 12 Non-uniform, varying from 4 to 36
{4, 4, 7, 10, 11, 13, 14, 15, 23, 29, 34, 36}
Non-overlapping
0.9488
S1 5,000 15 Quasi-uniform, varying from 300
to 350 {350, 350, 350, 349, 347, 342, 341, 338, 334, 326, 325, 318, 316, 314, 300}
Overlapping 0.8750
S2 5,000 15 Quasi-uniform, varying from 300
to 350 {350, 350, 350, 350, 346, 345, 340 334, 333, 329, 321, 320, 317, 315, 300} Overlapping 0.7747 Table I. 2D benchmark datasets for clustering applications Figure 3. RTS-based clustering results on the S0dataset
0 500 1,000 1,500 0 200 400 600 800 1,000 X1 X2 0 50 100 150 200 0.949 0.948 0.9485 0.9475 Generations Silhouette inde x (a) (b) 0 50 100 150 200 0 2 4 6 8 10 12 14 Generations
Notes: (a) Initial dataset with 12 clusters; (b) silhouette index; (c) number of clusters
Number of
c
luster
s
cases, a good solution is found by the RTS. It should be noted that the exact partitioning of the datasets cannot be determined by the algorithm due to the cluster assignment strategy which does not allow overlapping cluster configurations. Nevertheless, cluster centroids are accurately identified and the number of misclassified only equals 0.9 percent for the S1 dataset and 3 percent for the
S2 dataset. It should be noted that the computation time essentially depends on the
problem complexity (i.e. the number of elements in the dataset) and on the number of clusters in the dataset. The global CPU time for solving each problem on a standard PC (Core Duo 2 GHz) with the chosen set of control parameters (i.e. 100 individuals and 300 generations) is about 10 min for the S0dataset and 75 h for S1and S2 datasets.
Figure 5. RTS-based clustering results on the S2 10 8 6 4 2 0 0 2 4 6 8 10 X1 0 2 4 6 8 10 X1 X2 10 8 6 4 2 0 X2 (a) (b)
Notes: (a) Initial dataset with 15 clusters; (b) partitioning resulting from a typical RTS run
Figure 4.
RTS-based clustering results on the S1dataset
(a) 10 8 6 4 2 0 0 2 4 6 8 10 X1 0 2 4 6 8 10 X1 X2 10 8 6 4 2 0 X2 (b)
4. Clustering analysis of railway driving profiles 4.1 Design of hybrid supplies for electrical locomotives
The design of hybrid power sources for electrical locomotives requires the knowledge of driving “missions” (e.g. load power demand during driving cycles) for sizing the system elements (Akli et al., 2009). For these particular electrical architectures, a possible energy management strategy consists in providing the average part of the load power by a primary energy source (Ehsani et al., 1999; Akli et al., 2007) (Figure 6). The rest of the power (i.e. the fluctuant part) is devoted to a storage system (i.e. the auxiliary source). With this particular power dispatching, the size of the main supply essentially depends on the average load power Pavdefined as:
Pav¼ 1 DT Z DT 0 PloadðtÞ dt ð4Þ
where DT denotes the mission duration and Ploadrepresents the load power required
by the mission.
On the other hand, the size of the storage device can be characterized in terms of power, according to the maximal power imposed to this auxiliary supply, i.e. Pmax – Pavwhere Pmaxrepresents the maximal load power during the mission. It also depends
on the maximum energy quantity Eutransferred to the storage device. This energy can
be computed as: Eu ¼ t[½0;DT max ðEsðtÞÞ 2 t[½0;DT min ðEsðtÞÞ ð5Þ Figure 6. Typical architecture of hybrid locomotive with storage and associated energy management strategy Time 0 Dynamic Power Time 0 = + Load Power Time 0 Average Power Main Supply (Primary Energy Source)
Auxiliary Supply (Storage Device) Load Power (Driving Mission) AC or DC DC DC DC
where the storage energy level Esis defined as follows:
EsðtÞ ¼ 2
Z t
0 ðP
loadðtÞ 2 PavÞ dt ð6Þ
It can be seen from the previous equations that the global sizing of the hybrid electrical architecture is related to the three following factors: Pmax, Pavand Eucomputed with
regard to the driving mission. Nevertheless, integrating these factors in the sizing process of the hybrid supply is not straightforward because of the important number of heterogeneous driving missions that can be imposed to the locomotive. Therefore, both sources (main supply and storage) are generally sized considering the most critical values of these indicators extracted from a set of driving missions. However, this approach may lead to the oversizing of the sources, especially when a “critical” mission significantly differs from the others. The use of clustering analysis can be interesting in order to identify the most representative missions (i.e. the cluster centroids). This can help designers in the investigation of tradeoffs between the mission fulfillment and the power source sizing.
4.2 Clustering analysis of a set of railway driving profiles
A second benchmark consisting of a set of 105 railway driving missions is used for illustrating the interest of clustering analysis in the context of hybrid system design. This set is composed of three subsets of missions devoted to three different railway systems: the BB 63000 locomotive, the BB 460000 locomotive and the auxiliary supply for TGV. All missions, represented by the load power demand as a function of time, are characterized according to the triplet of sizing indicators mentioned in the previous section. The size and the centroid of each subset are given in Table II.
All missions are represented versus the sizing indicators in Figure 7(a). The centroid of each subset is also indicated with a black mark. In Figure 7(b), the classification of the missions obtained from the RTS run after 500 generations is plotted. The characteristics of the clusters found by the niching GA are also given in Table III for comparison.
It can be seen that the niching GA is capable of finding the correct partitioning of data by identifying three distinct clusters. The difference between both partitioning is only of 12 percent (i.e. 13 missions over 105). Note that the set of 105 missions based on three different subsets of application (BB 63000, BB 460000 and TGV Aux) may present some similarities in terms of power/energy sizing indicators so that clustering missions issued from different subsets may be energetically coherent: thus obtaining some differences between reference and RTS-based clustering is not necessarily due the niching GA convergence. All data are globally well classified except elements located in the region covered by the three subsets. In this particular region of low power and energy, all missions can be performed by the three hybrid supplies.
Number of railway driving missions Cluster centroids (Pmax[kW], Pav[kW], Eu[kWh]) BB 63000 15 (455, 91, 24) BB 460000 27 (711, 35, 50) TGV Aux 63 (189, 80, 13) Table II.
Set of 105 railway driving missions composed of three subsets associated with three different hybrid supplies
Therefore, the assignment by the RTS of elements to the closest and most densely populated cluster (i.e. the cluster corresponding to Aux TGV driving missions) is not surprising. This also explains the greater deviation of the cluster centroid relative to BB 63000 data. This cluster is more sensitive to partitioning errors because of its small size. On the other hand, both other cluster centroid positions are relatively unchanged by the RTS partitioning due to their bigger size. These results also show the relevance of the proposed triplet for clustering analysis in the context of hybrid supply design. 5. Conclusions
In this paper a niching GA based on RTS has been presented for clustering of system environmental variables. It uses a particular chromosome encoding allowing the variation of the number and positions of the cluster centroids related to the dataset. With this representation and the use of the silhouette partition criterion as objective function, the algorithm aims at finding a good tradeoff between the inter-cluster distance maximization and the intra-cluster distance minimization. Such strategy simultaneously allows the determination of the correct number of clusters as well as the good partitioning of the elements in the dataset. The effectiveness of the proposed RTS-based clustering algorithm has been demonstrated on 2D benchmarks with different levels of difficulty. Finally, on the basis of the proposed method, the interest of clustering analysis of driving missions in the context of hybrid supply design has been illustrated. For that purpose, a set of 105 railway driving missions composed of three subsets associated with three distinct supply systems has been chosen as benchmark. Each driving mission has been characterized in the design variable space by a triplet of sizing indicators. Results have shown that the RTS-based clustering is capable of identifying the three distinct supply systems (i.e. the initial clusters). Such approach based on clustering analysis can guide designers to identify most representative missions and help them to understand whether it is better to design one system devoted to a whole set of driving missions or multiple systems related to different subsets. Even if it has been presented in the particular case of railway driving missions,
Figure 7. Set of 105 railway driving missions composed of three subsets relative to three supply systems
0 200 400 600 8001,000 0 50 100 150 2000 50 100 150 200 250 Pmax (kW) Pav (kW ) Eu (kWh) AuxTGV BB63,000 BB460,000 0 200 400 600 8001,000 0 50 100 150 2000 50 100 150 200 250 Pmax (k W) Pav (kW ) Eu (kWh) 1st cluster 2nd cluster 3rd cluster
Notes: (a) Initial set of railway driving missions; (b) classification of all missions with the
niching GA
Cluster size Cluster centroids (Pmax[kW], Pav[kW], Eu[kWh])
First cluster 6 (553, 141, 53) Second cluster 23 (762, 37, 56) Third cluster 76 (225, 75, 13) Table III. Characteristics of the clusters found by RTS
it can be applicable for any embedded systems as for electric or hybrid vehicle driving missions. More generally, clustering analysis should be useful for classifying any system environmental variables as wind or solar irradiation for renewable energy systems.
References
Akli, C.R., Roboam, X., Sareni, B. and Jeunesse, A. (2007), “Energy management and sizing of a hybrid locomotive”, paper presented at 12th European Conference on Power Electronics and Applications (EPE’2007), Aalborg, Denmark, 3-5 September.
Akli, C.R., Sareni, B., Roboam, X. and Jeunesse, A. (2009), “Integrated optimal design of a hybrid locomotive with multiobjective genetic algorithms”, International Journal of Applied Electromagnetics and Mechanics, Vol. 4 Nos 3/4.
Bolshakova, N. and Azuaje, F. (2003), “Cluster validation techniques for genome expression data”, Signal Processing, Vol. 83 No. 4, pp. 825-33.
Ehsani, M., Gao, Y. and Butler, K. (1999), “Application of electrically peaking hybrid (ELPH) propulsion system to a full-size passenger car with simulated design verification”, IEEE Transactions on Vehicular Technology, Vol. 48 No. 6, pp. 1779-87.
Fra¨nti, P. and Virmajoki, O. (2006), “Iterative shrinking method for clustering problems”, Pattern Recognition, Vol. 39 No. 5, pp. 761-5.
Harik, G. (1995), “Finding multimodal solutions using restricted tournament selection”, Proceedings of the Sixth International Conference on Genetic Algorithms, Morgan Kaufmann, San Francisco, CA, pp. 24-31.
Jain, A.K., Murty, M.N. and Flynn, P.J. (1999), “Data clustering: a review”, ACM Computing Surveys, Vol. 31 No. 3, pp. 264-323.
MacQueen, J. (1967), “Some methods for classification and analysis of multivariate observations”, Proceedings 5th Berkeley Symp. on Mathematical Statistics and Probability, University of California Press, Berkeley, CA, pp. 281-97.
Maulik, U. and Bandyopadhyay, S. (2000), “Genetic algorithm-based clustering technique”, Pattern Recognition, Vol. 33, pp. 1455-65.
Milligan, G. and Cooper, M. (1985), “An examination of procedures for determining the number of clusters in a data set”, Psychometrika, Vol. 50, pp. 159-79.
Nguyen-Huu, H., Sareni, B., Wurtz, F., Retie`re, N. and Roboam, X. (2008), “Comparison of self-adaptive evolutionary algorithms for multimodal optimization”, 10th International Workshop on Optimization and Inverse Problems in Electromagnetism (OIPE’2008), Ilmenau, Germany, pp. 54-5.
Pal, N.R. and Bezdek, J.C. (1995), “On cluster validity for the fuzzy c-means model”, IEEE Transactions Fuzzy Systems, Vol. 3 No. 3, pp. 370-9.
Rousseeuw, P.J. (1987), “Silhouettes: a graphical aid to the interpretation and validation of cluster analysis”, Journal of Computational and Mathematics, Vol. 20, pp. 53-65.
Sareni, B. and Kra¨henbu¨hl, L. (1998), “Fitness sharing and niching methods revisited”, IEEE Transactions on Evolutionary Computation, Vol. 2 No. 3, pp. 97-106.
Sheng, W., Swift, S., Zhang, L. and Liu, X. (2005), “A weighted sum validity function for clustering with a hybrid niching genetic algorithm”, IEEE Transactions on Systems, Man, and Cybernetics-Part B: Cybernetics, Vol. 35 No. 6, pp. 1156-67.
Xu, R. and Wunsch, D.C. II (2005), “Survey of clustering algorithms”, IEEE Transactions on Neural Networks, Vol. 16 No. 3, pp. 645-78.
About the authors
Amine Jaafar received his Engineering Degree in Electrical Engineering from the Ecole Nationale d’Inge´nieurs de Monastir (Tunisia) in 2007. He is currently a PhD student at the Institut National Polytechnique de Toulouse in the LAPLACE laboratory.
Bruno Sareni is Associate Professor in Electrical Engineering and Control Systems at the Institut National Polytechnique de Toulouse. He is also a researcher at the LAPLACE laboratory. His research activities are related to the integrated optimal design of electrical systems using artificial evolution algorithms. Bruno Sareni is the corresponding author and can be contacted at: sareni@laplace.univ-tlse.fr
Xavier Roboam is CNRS full-time researcher at LAPLACE laboratory (Institut National Polytechnique de Toulouse). Since 1998, he has been the Head of the team “GENESYS” whose objective is to develop design methodologies specifically oriented toward multi-field systems design for applications such as electrical embedded systems and renewable energy systems.