Pépite | Etude expérimental sur la formation des suies dans des flammes laminaires prémélangées d’hydrocarbure d’intérêt automobile et aéronautique : accent sur le processus de nucléation des particules de suie
241
0
0
Texte intégral
(2) Thèse de Christopher Betrancourt, Lille 1, 2017. © 2017 Tous droits réservés.. lilliad.univ-lille.fr.
(3) Thèse de Christopher Betrancourt, Lille 1, 2017. REMERCIEMENTS. Cette page est généralement empreinte de sentimentalisme. Celle-ci sera simple et directe. Mes premiers remerciements vont à Pascale Desgroux et Xavier Mercier pour avoir dirigé ces travaux de thèse. Pascale sans toi cette thèse n’aurait pas été aussi enrichissante et passionnante. Merci ! Je remercie les différents membres du jury pour avoir accepté d’évaluer ce travail de thèse qui s’est déroulé au laboratoire PC2A dont Laurent Gasnot est le directeur. Je remercie également Nathalie Lamoureux, Abderrahman El Bakali, Alessandro Faccinetto et Denis Petitprez qui ont été impliqués dans ce travail respectivement pour la thermométrie, la chromatographie et la granulométrie. Un grand merci au staff PC2A: Olivier Hombert, Béatrice Lecrenier, Sylvie Gosselin et Valérie Vilain. Je remercie aussi les membres du laboratoire qui ont montré un vrai intérêt pour mon travail (en plus des précédemment cités): Eric Therssen, Cornelia Irimiea et Laure Pillier. Et parce qu’une thèse n’est pas qu’un simple travail (voilà un peu de sentimentalisme) on y rencontre des gens qui deviennent de vrais amis et que je tiens à citer ici : Emmanuel Assaf, Patrice Hubert, Damien Aubagnac, Florent Kravtchenko, Samantha Seng, Junteng Wu et Marame Sylla.. © 2017 Tous droits réservés.. lilliad.univ-lille.fr.
(4) Thèse de Christopher Betrancourt, Lille 1, 2017. © 2017 Tous droits réservés.. lilliad.univ-lille.fr.
(5) Thèse de Christopher Betrancourt, Lille 1, 2017. CONTENTS. CONTENTS. Remerciements ...................................................................................................................................... 3 CONTENTS ........................................................................................................................................... 5 Nomenclature ....................................................................................................................................... 11 Introduction ......................................................................................................................................... 17 Chapter1: Soot formation processes .................................................................................................. 21 Introduction ........................................................................................................................................... 21 I.. II.. What is soot? ............................................................................................................................. 21 I.1. Definition .............................................................................................................................. 21. I.2. Soot morphologies................................................................................................................. 22 Soot formation processes........................................................................................................... 25. II.1. Gas phase........................................................................................................................... 27. II.1.1. Fuel decomposition ............................................................................................... 27. II.1.2. First rings formation .............................................................................................. 28. II.1.3. PAHs formation and growth reactions .................................................................. 29. II.2. Solid phase ........................................................................................................................ 30. II.2.1. The nucleation: soot particle inception.................................................................. 30. II.2.2. Soot particle surface reactions: growth and oxidation........................................... 31. II.2.3. Soot particle coagulation ....................................................................................... 31. II.2.4. Soot particle agglomeration ................................................................................... 32. III. Knowledge on just nucleated soot particles .............................................................................. 32 III.1. Theoretical studies ............................................................................................................. 32. III.2. Mass spectroscopy studies................................................................................................. 35. III.3. Particles size distribution function .................................................................................... 38. III.4. Spectroscopic studies ........................................................................................................ 41. III.4.1. Transparent nascent particles ................................................................................ 42. III.4.2. Incandescent nascent soot particles and nucleation flames ................................... 44. 5 © 2017 Tous droits réservés.. lilliad.univ-lille.fr.
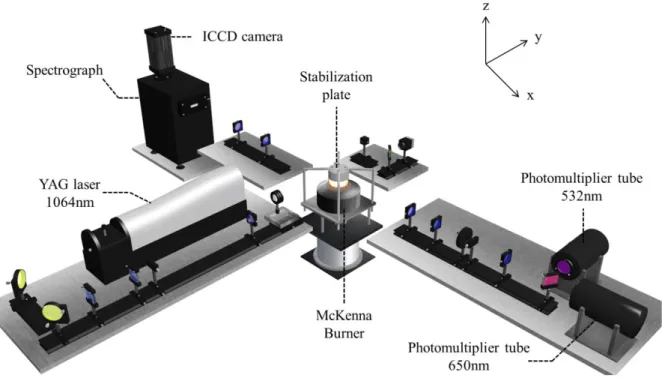
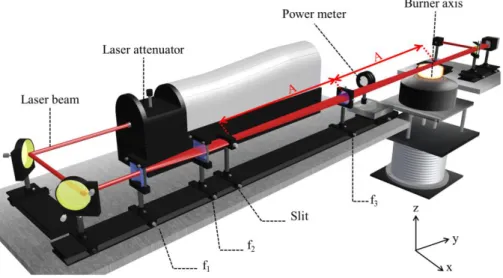
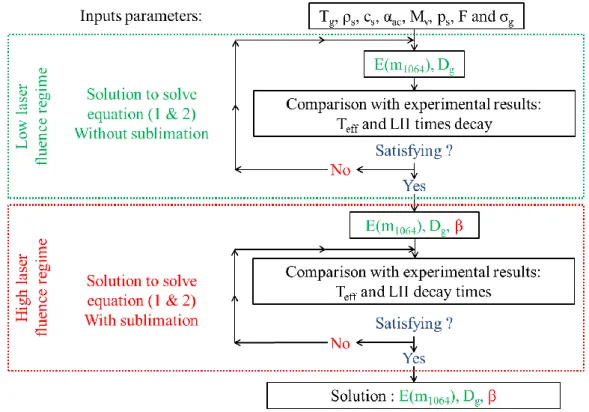
(6) Thèse de Christopher Betrancourt, Lille 1, 2017. CONTENTS Chapter 2: Identification of the just nucleated soot particles in premixed sooting and nucleation flames .................................................................................................................................................... 51 Introduction ........................................................................................................................................... 51 I.. Identification by Laser induced Incandescence ......................................................................... 51 I.1. LII: Fundamental understanding ........................................................................................... 52 I.1.1. I.2. LII processes.................................................................................................................. 52. I.1.1.1. Internal energy term .............................................................................................. 53. I.1.1.2. Absorption term ..................................................................................................... 54. I.1.1.3. Conduction term .................................................................................................... 54. I.1.1.4. Sublimation term ................................................................................................... 55. I.1.1.5. Radiative and other losses terms ........................................................................... 56. I.1.2. Laser induced incandescence signal expressions .......................................................... 56. I.1.3. LII signal decay rate ...................................................................................................... 59. I.1.4. Effective soot temperature measurements ..................................................................... 60. I.1.4.1. Two-color LII ........................................................................................................ 61. I.1.4.2. Spectrally-resolved technique ............................................................................... 62. LII experimental setup........................................................................................................... 64 I.2.1. Burner and flames conditions ........................................................................................ 64. I.2.2. Time- and spectrally-resolved LII set-up ...................................................................... 66. I.2.2.1. Excitation system................................................................................................... 66. I.2.2.2. Collection system .................................................................................................. 67. I.2.2.2.1 Time-resolved 2C-LII system .......................................................................... 67 I.2.2.2.2 Spectrally-resolved LII system ......................................................................... 69 I.3. I.4. TIRE-LII modelling .............................................................................................................. 69 I.3.1. LII model ....................................................................................................................... 70. I.3.2. Input parameters ............................................................................................................ 71. I.3.3. Solving procedure.......................................................................................................... 72. Results and discussion: LII measurements and TIRE-LII modeling ..................................... 73 I.4.1. Experimental characterization of nucleation and sooting flames using LII .................. 73. 6 © 2017 Tous droits réservés.. lilliad.univ-lille.fr.
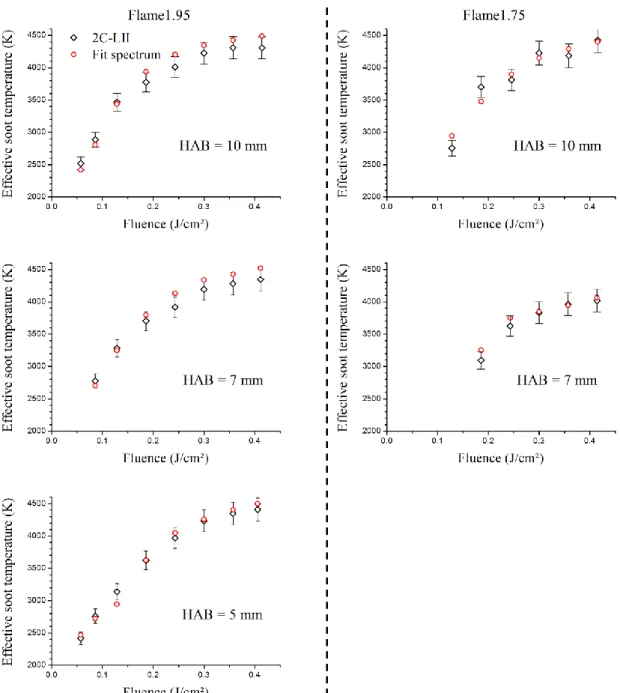
(7) Thèse de Christopher Betrancourt, Lille 1, 2017. CONTENTS I.4.1.1. Time-resolved LII signal and fluence curves ........................................................ 74. I.4.1.2. Spectrally-resolved LII measurements and effective soot temperature ................. 77. I.4.1.3. Experimental comparison between just nucleated soot particles in the nucleation. flame and incipient soot in the early soot formation region of the sooting flame ................. 81 Determination of E(m1064), β and PSDF by TIRE-LII modeling in nucleation and. I.4.2. sooting flames............................................................................................................................ 82. II.. I.4.2.1. Modelled effective soot temperature and fluence curves ...................................... 83. I.4.2.2. Soot particle size distribution from TIRE-LII modelling ...................................... 84. Identification by Helium Ion Microscopy ................................................................................. 86 II.1. Sampling set-up ................................................................................................................. 87. II.2. HIM images analysis for PSDF measurements ................................................................. 88. III. Identification by SMPS ............................................................................................................. 90 III.1. Extraction system .............................................................................................................. 91. III.1.1. Soot extraction ....................................................................................................... 91. III.1.2. Dilution ratio calibration ....................................................................................... 93. III.2. Granulometer – Particle sizer analyzer.............................................................................. 95. III.2.1. Scanning Mobility Particle Sizer systems ............................................................. 95. III.2.1.1 SMPS working principle ....................................................................................... 95 III.2.1.2 2 nm-SMPS set-up ................................................................................................ 97 III.2.2. Correction of PSDF measurements ....................................................................... 98. III.2.2.1 Impact of the dilution ratio .................................................................................... 98 III.2.2.2 Diffusion losses correction .................................................................................... 99 III.2.2.3 Impact of the Mobility diameter correction......................................................... 102 IV. Results and discussion: comparison of particles size distributions by LII-HIM-SMPS.......... 104 IV.1. Flame1.95 ........................................................................................................................ 105. IV.2. Flame1.75 ........................................................................................................................ 107. IV.3. Sensitivity comparison between LII and SMPS techniques ............................................ 110. Conclusion chapter 2 ........................................................................................................................... 112 Chapter 3: Soot volume fraction profiles in n-butane premixed flames by combining LII and CRDE.................................................................................................................................................. 115 7 © 2017 Tous droits réservés.. lilliad.univ-lille.fr.
(8) Thèse de Christopher Betrancourt, Lille 1, 2017. CONTENTS Introduction ......................................................................................................................................... 115 I.. Optical soot properties............................................................................................................. 115 I.1. Soot-light interaction: basic concepts .................................................................................. 115. I.2. Soot absorption function in literature: E(mλ) ...................................................................... 118 I.2.1. Method of determination of optical soot properties .................................................... 118. I.2.2. Evolution of E(mλ) with soot maturity and λabs ........................................................... 122. I.3. II.. I.2.2.1. Variation of E(mλ) with absorption wavelength .................................................. 122. I.2.2.2. Variation of E(mλ) with the soot maturity at 1064 nm ........................................ 123. I.2.2.3. Variation of E(mλ) with soot maturity and wavelength ....................................... 124. In-situ approximation of the E(mλ) ratio as a function of HAB at 1064 nm ....................... 127 I.3.1. Principle....................................................................................................................... 127. I.3.2. Application .................................................................................................................. 127. I.3.3. Comparison of E(m1064) as a function of HAB for different flames ............................ 130. Soot volume fraction profiles by combining LII and CRDE................................................... 132 II.1. LII profiles....................................................................................................................... 133. II.2. Extinction measurements by CRDE ................................................................................ 134. II.2.1. Principle and experimental set-up ....................................................................... 134. II.2.2. CRDE measurement in premixed n-butane flame at HAB = 10 mm .................. 136. II.3. Calibration of LII signal methodology ............................................................................ 137. II.4. Comparison of LII and CRDE measurements ................................................................. 139. II.4.1. Case 1: E(mλem) is not dependent of the wavelength for a given soot in the range. [532-1064 nm] ......................................................................................................................... 140 II.4.2 II.5. Case 2: E(mλem) is dependent on wavelength and of soot maturity ..................... 141. Validation of the wavelength dependence of E(m) with soot maturity ........................... 143. II.5.1. Comparison of the fv profiles measured by LII and CRDE using the previous. conclusion on the wavelength dependence of E(m) with soot maturity .................................. 143 II.5.2. Effect of the wavelength dependence of E(m) with the soot maturity ................ 145. Conclusion chapter 3 ........................................................................................................................... 149 Chapter 4: Experimental measurements for chemical structure analysis in premixed flames.. 151 Motivations: target fuels and flames ................................................................................................... 151 8 © 2017 Tous droits réservés.. lilliad.univ-lille.fr.
(9) Thèse de Christopher Betrancourt, Lille 1, 2017. CONTENTS I.. II.. Chemical flame structure analysis by gas chromatography .................................................... 154 I.1. Target species ...................................................................................................................... 154. I.2. Experimental set-up for chemical flame structure analysis ................................................. 156 I.2.1. Generator of n-propylbenzene vapor ........................................................................... 156. I.2.2. Online gas chromatography set-up .............................................................................. 158. I.2.2.1. Probing system .................................................................................................... 159. I.2.2.2. Gas chromatography system................................................................................ 160. I.2.2.3. Identification and quantification.......................................................................... 161. Gas temperature measurements by multiline NO-LIF thermometry ....................................... 162 II.1. Background on laser induced fluorescence thermometry ................................................ 163. II.1.1. LIF principle: simple model at two levels ........................................................... 163. II.1.1.1. Rate equation ....................................................................................................... 164. II.1.1.2. Regimes of fluorescence...................................................................................... 165. II.1.1.3. LIF signal in the linear regime of fluorescence ................................................... 166. II.1.2. LIF thermometry technique ................................................................................. 167. II.1.2.1. The multi-line Boltzmann plot ............................................................................ 168. II.1.2.2. Simulated excitation spectrum method................................................................ 169. II.1.2.3. Measurement procedure ...................................................................................... 171. II.1.2.4. Choice of the tracer ............................................................................................. 172. II.2. Thermometry experimental set-up .................................................................................. 172. II.3. Temperature measurements ............................................................................................. 174. II.3.1. Experimental approach ........................................................................................ 174. II.3.2. Computational approach ...................................................................................... 177. III. Results and discussion: impact of equivalence ratio and fuel composition on gas phase and soot profiles ............................................................................................................................................. 180 III.1. Impact of equivalence ratio on soot formation ................................................................ 181. III.1.1. Impact of equivalence ratio on gaseous flame structure ...................................... 182. III.1.2. Impact of equivalence ratio on soot volume fraction .......................................... 185. III.2. Impact of the substitution of 20% of n-butane in volume by n- propylbenzene ............. 187. 9 © 2017 Tous droits réservés.. lilliad.univ-lille.fr.
(10) Thèse de Christopher Betrancourt, Lille 1, 2017. CONTENTS III.2.1. Impact on gaseous flame structure ...................................................................... 187. III.2.2. Impact on soot formation process........................................................................ 189. Conclusion chapter 4 ........................................................................................................................... 192 Conclusion and perspectives............................................................................................................. 195 References .......................................................................................................................................... 199 Annex A: Determination of the uncertainties ................................................................................. 219 I.. CRDE measurements .............................................................................................................. 219. II.. Uncertainty on relative soot volume fraction measurement determined by LII ...................... 220. Annex B: 1D LII imaging: radial LII profile .................................................................................. 221 I.. 1D LII imaging experimental set-up ....................................................................................... 221. II.. Radial LII measurements......................................................................................................... 222. Annex C: Compilation of mole fraction profiles ............................................................................ 225 I.. Comparison of mole fraction profiles of species measured in premixed flames as a function of. the equivalence. ............................................................................................................................... 226. II.. I.1. In n-butane premixed flames ............................................................................................... 226. I.2. In mixture of n-butane and n-propylbenzene premixed flames ........................................... 228 Comparison of mole fraction profiles of species measured in premixed flames at iso-richness. as a function of the fuel. .................................................................................................................. 231 II.1. At Φ = 1.95 ...................................................................................................................... 232. II.2. At Φ = 1.75 ...................................................................................................................... 235. Résumé ............................................................................................................................................... 239 Abstract .............................................................................................................................................. 241. 10 © 2017 Tous droits réservés.. lilliad.univ-lille.fr.
(11) Thèse de Christopher Betrancourt, Lille 1, 2017. Nomenclature. NOMENCLATURE. AC-LII: Auto-compensating LII AFM: Atomic force microscopy Ai: Peak integration. -. Aj’j”: Einstein coefficient spontaneous emission. (s-1). BC: Black carbon. -. Bj’j”: Einstein coefficient stimulated emission. (m3.J-1.s-2). Bj”j’: Einstein coefficient absorption. (m3.J-1.s-2). CARS: Coherent anti-Stokes Raman scattering c: Speed of the light CEM: Controlled evaporation and mixing system CN: Cetane number CPC: Condensation Particle Counter CRDE: Cavity ring-down extinction. (m.s-1) -. cs: Soot specific heat. (J.(g.K)-1). Df: Fractal dimension. -. DMA: Differential Mobility Analyzer. -. Dp: Particle diameter. (nm). E: Photon energy. (eV). E(mλ): Absorption function. -. 11 © 2017 Tous droits réservés.. lilliad.univ-lille.fr.
(12) Thèse de Christopher Betrancourt, Lille 1, 2017. Nomenclature EC: Elemental carbon Eg: Optical band gap. (eV). En”,v”,j”: rovibronic energy. (m-1). F(mλ): Scattering function. -. F: Laser fluence. (J.m-2). fb: Boltzmann factor. -. fv: Soot volume fraction. -. GC: Gas chromatography. -. h: the Planck constant HAB: height above burner HACA: Hydrogen-Abstraction Carbon-Addition HIM: Helium-ion microscope HRTEM: High-resolution transmission electron microscopy Ibb(λi,T): Monochromatic emittance IR: Infrared. (J.s) (W.m-2) -. j: Rotational number. -. Kabs: Absorption coefficient. -. kb: Boltzmann constant. (J.K-1). Kext: Extinction coefficient. -. kf: Dimensional prefactor. -. Ksca: Scattering coefficient. -. 12 © 2017 Tous droits réservés.. lilliad.univ-lille.fr.
(13) Thèse de Christopher Betrancourt, Lille 1, 2017. Nomenclature kλ: Imaginary part of the refractive index LD-PI-TOF-MS : Laser desorption, Phoyon Ionization and Time-Of-Flight Mass Spectrometry. -. -. LIF: Laser induced fluorescence. -. LII: Laser induced incandescence. -. LMMS: Laser microprobe mass spectrometry. M: Primary particle mass. MAC: Methyl addition/cyclization MBMS: Molecular beam mass spectrometer. -. (g). -. mg: Ambient gas molecule mass. -. Mv: Mean molecular weight of the sublimated species. (g.mol-1). mλ: Refractive index. -. nCNC: Nano Condensation Nucleus Counter NOC: Nanoparticles of organic carbon Np: Number of primary particle nPb: n-propylbenzene. -. Nvj: Population at vibrational level v and rotational j. -. nλ : Real part of the refractive index. -. OC: Organic or volatile carbon p(Dp): Distribution function of the primary soot particle diameter. -. 13 © 2017 Tous droits réservés.. lilliad.univ-lille.fr.
(14) Thèse de Christopher Betrancourt, Lille 1, 2017. Nomenclature p(Np): Distribution function of the aggregate size. -. PAC Phenyl addition/cyclization. -. PAH Poly aromatic hydrocarbon. -. pg: Ambient pressure. (atm). Pinj i Injection pressure. -. PSDF : Particle size distribution function pv: Sublimation pressure. (atm). q(t): Normalized laser power temporal profile. -. Qabs: Absorption efficiency. -. Qe: Electronic partition function. -. Qem: Emissivity efficiency. -. Qj´j´´: Quenching rate. (s-1). Qr: Rotation partition function. -. Qv: Vibrational partition function. -. REMPI Resonant multiphoton ionization. -. 𝑞̇ 𝑎𝑏𝑠 : Absorption rate. (W.s-1). 𝑞̇ 𝑐𝑜𝑛𝑑𝑢𝑐𝑡𝑖𝑜𝑛 : Conduction rate. (W.s-1). 𝑞̇ 𝑠𝑢𝑏𝑙𝑖𝑚𝑎𝑡𝑖𝑜𝑛 : Sublimation rate. (W.s-1). 𝑞̇ 𝑟𝑎𝑑𝑖𝑎𝑡𝑖𝑜𝑛 : Thermal radiation rate RET Rotational energy transfer Rg Radius of gyration. (W.s-1) -. 14 © 2017 Tous droits réservés.. lilliad.univ-lille.fr.
(15) Thèse de Christopher Betrancourt, Lille 1, 2017. Nomenclature Ru: The universal gas constant. (J.(mol.K)-1). SANS: small angle neutron scattering. -. SAXS: small angle X-ray scattering. -. SEM: Scanning electron microscopy SG: Surface growth Si: Sensitivity coefficient SLII (λi, T(t)): LII signal: Power emitted SMPS : Scanning mobility particle sizer T: Soot temperature. (W) (K). TC: Total carbon numbers. -. Teff: Effective soot temperature. (K). TEM: Transmission electron microscopy TEW-LII: Two-excitation wavelength LII. -. Tg: Local gas temperature. (K). TSI: Threshold sooting index. -. u: Unified atomic mass unit UV: Ultra violet Uν: Spectral laser density 𝑈̇𝑖𝑛𝑡𝑒𝑟𝑛𝑎𝑙 : The rate of change of the energy stored by the particle v: Vibrational number VET: Vibration energy transfer. (J.s.m-3) (W.s-1) -. 15 © 2017 Tous droits réservés.. lilliad.univ-lille.fr.
(16) Thèse de Christopher Betrancourt, Lille 1, 2017. Nomenclature x: Size parameter Xi: Mole fraction of the species α: Proportion of active sites on soot surface. -. αac: Thermal accommodation coefficient. -. αd: Dispersion coefficient. -. β: Effective sublimation coefficient. -. η: Collision efficiency parameter. -. γ*: Averaged specific heat ratio ΔHv: Enthalpy of formation of the sublimed carbon species. (J.mol-1). η: Quantum yield. -. λ: Wavelength. -. λabs: Absorption wavelength. -. λem: Emission wavelength. -. ρs: Soot density. (g.cm-3). τp: Pumping time. (s). Φ: Equivalence ratio. -. 16 © 2017 Tous droits réservés.. lilliad.univ-lille.fr.
(17) Thèse de Christopher Betrancourt, Lille 1, 2017. Introduction. INTRODUCTION. Soot particles are formed during the combustion of hydrocarbon/air mixtures in domestic and industrial burners and most combustion devices related to transport. Particles emissions of vehicles are restricted by emission standards which have significant variations depending on the country. They are regulated for Diesel engines, spark-ignition engines and gas turbines. They will concern not only the soot mass emission, but also the number of particles and finally the number of the smallest ones. To ensure a better emission monitoring the use of portable emission measurement systems (PEMS) mounted onboard vehicles will be generalized. To date, the legislation focuses on solid particles larger than 23 nm in diameter [1] mainly because of the current limitations of the commercial granulometers. But, thanks to the availability of new powerful commercial instruments, legislation is expected to be more stringent. Indeed several studies [2] have revealed that an important part of solid particles in the modern gasoline vehicle exhaust can be below this particle size limit. Particulate filters equip Diesel engines, but their efficiency related to ultrafine particles is mostly unknown. Thus there is still a strong interest in reducing soot emission at the source for engines because this would allow improving the fuel efficiency and reducing the high cost of after-treatment systems. In the aeronautics domain, reduction at source is the unique way to reduce soot emissions. In this context, the integrated research project ASMAPE “Advanced Soot Models for Aeronautics and Piston Engines”, led by IFP Energies Nouvelles, has been one of the laureates of the call ANR 2013 “green vehicles” for the period 2013-2017. The objective of ASMAPE is to develop validated predictive Computational Fluid Dynamics models for the formation and evolution of soot during the turbulent combustion processes, in both piston engines and gas turbines. The ambition is to address the three main commercial fuels (CF) relevant for a present usage: Gasoline, kerosene and Diesel fuel. The predictive capability of the models to be developed will concern both the soot volume fraction fv and particle size distribution function PSDF. The implication of PC2A in this project partly concerns the acquisition of databases in well defined sooting laminar flames, burning fuels representative of CF, and with a focus on the formation of the first soot particles (nucleation). The experiments rely on sensitive and selective advanced diagnostics (optical diagnostics and sampling-based techniques). The experimental results are expected to gain detailed insight into the chemistry of polycyclic aromatic hydrocarbons (PAH) and especially on soot nucleation. The soot nucleation designates the transition from the gaseous soot precursors to the first solid particles designed as soot. This mechanism is not understood although many advances have been attained these recent years. Experimentally identification of the nucleation zone relies on the detection of the first soot particles, through their number Np (the number of primary particle), their size Dp or 17 © 2017 Tous droits réservés.. lilliad.univ-lille.fr.
(18) Thèse de Christopher Betrancourt, Lille 1, 2017. Introduction soot volume fraction fv (𝑓𝑣 = 𝑁𝑝 𝜋 𝐷𝑝3 /6 ). The most sensitive techniques are to date the ex-situ scanning mobility particle sizing (SMPS) and the in-situ laser induced incandescence (LII) technique. In atmospheric premixed sooting flames, nucleation occurs along the flame. However at the beginning of the soot onset a very thin region of the flame can be isolated dominated by nucleation beyond it other processes like surface growth, condensation and coagulation occur leading to an important growth of the particle size (and fv). Soot particles are expected to be very small and in low concentration in the nucleation zone making their detection very challenging. To investigate experimentally the nucleation in this PhD, we took advantage of recent advances reached at PC2A laboratory. The progresses rely on the refinement of the LII technique to improve significantly the signal to noise ratio (SNR). Knowing that the incandescent radiation is proportional to the soot volume fraction fv, any improvement in SNR translates into a better detection limit of fv and into a smaller size Dp. These efforts led to the discovery of flames called nucleation flames by the conjunction of obtaining a better SNR and the finding that decreasing gradually the equivalence ratio of premixed sooting flames led to a significant diminution of soot growth along the height above the burner (HAB) until a threshold equivalence ratio is reached, at which soot particles do not exhibit growth anymore. Size of soot particles in nucleation flames was estimated to be around 1.5 nm from the modelling of the LII time-decays. This behaviour has first been highlighted in low pressure methane flames [3] and later in an ethylene atmospheric flame [4]. As defined by the ASMAPE project, the main objective of this thesis is to provide an extensive experimental database containing gaseous species mole fraction profiles and soot volume fraction profiles in atmospheric sooting flames, with fuels of interest for automobile and aeronautics. This database aims to further improve kinetics modelling of sooting flames with a focus on the soot nucleation. In order to better investigate the soot nucleation, the strategy relying on studying nucleation flames was adopted. Four flames have been analyzed including two nucleation flames as detailed below. However since the writing of the project, an important phase of validation concerning - (1) soot definition (2) assignment of the laser-induced emission signal to LII and (3) attribution of the behavior identified in nucleation flames (absence of soot growth) to the behavior of particles defined as soot turned out to be indispensable. Indeed part of the recent literature on this subject is sceptical about the existence of very small soot particles as detected previously and in this work [3], [4]. The assignment of the measured radiation to soot particles (or not) being indispensable for further kinetics mechanism development, an important part of the work has finally been devoted to this crucial question. This was made possible thanks to the freedom of action which has guided this contract, supported by ANR and Labex CaPPA.. 18 © 2017 Tous droits réservés.. lilliad.univ-lille.fr.
(19) Thèse de Christopher Betrancourt, Lille 1, 2017. Introduction Considering the above discussion, the thesis is organized in four chapters as follows: Chapter 1 describes briefly the soot formation processes after giving a definition of a soot particle. Then the chapter describes the knowledge on the ultrafine soot particles, later named “just nucleated soot particles”: their formation, their identification and their properties. Finally recent literature on nucleation flames is presented to introduce the strategy followed in this PhD. Chapter 2 aims to definitely assign the laser induced emission signal from just nucleated soot particles to LII, i.e. to very small soot particles. This has been realized by stabilizing a nucleation flame of nbutane making easier the investigation of just nucleated particles and by deploying the most relevant granulometry technologies: LII, nano SMPS and HIM (helium ion microscopy) to detect and measure just nucleated soot particles. New knowledge about some properties of these nascent soot particles is derived. This chapter details the implemented experimental set-up and techniques for LII, nano SMPS and HIM. Chapter 3 describes the experimental procedure implemented to obtain quantitative soot volume fraction in n-butane flames. It includes a calibration by cavity ring-down spectroscopy extinction (CRDE) technique. In addition an original procedure based on the coupling of LII and CRDE has been implemented to gain insight about the optical properties of the just nucleated soot particles, which is currently subject of debates. This knowledge is indispensable to translate the measurement of extinction into soot volume fraction. Finally chapter 4 provides an extensive database for further improvement of kinetics modelling of sooting flames with a focus on the soot nucleation in flames of interest for automobile and aeronautics. Concerning the fuels, two kinds of fuels have been selected: n-butane and a mixture of n-butane and npropylbenzene. For each fuel two flames have been investigated: a nucleation and a standard sooting flame. The database consists of species profiles obtained by gas chromatography (GC), temperature profiles measured by LIF thermometry on NO species, soot volume fraction profiles obtained by LII calibrated by CRDE and particle size distribution function (PSDF) obtained in n-butane flames by SMPS, HIM and LII. From this database effect of equivalence ratio and fuel composition is analyzed. The manuscript ends by a summarizing of the gained experimental results, analyses the advances and derives some perspectives.. 19 © 2017 Tous droits réservés.. lilliad.univ-lille.fr.
(20) Thèse de Christopher Betrancourt, Lille 1, 2017. © 2017 Tous droits réservés.. lilliad.univ-lille.fr.
(21) Thèse de Christopher Betrancourt, Lille 1, 2017. Chapter1: Soot formation processes. CHAPTER1: SOOT FORMATION PROCESSES. INTRODUCTION The objectives of this chapter are: (1) give general information about the definition of soot, (2) summarize the current comprehension of the soot formation processes and (3) review the knowledge on just nucleated soot particles.. I.. I.1. What is soot?. Definition. Definition of soot particles is complex. The consensual position is that these particles are formed during the incomplete combustion of hydrocarbon fuels. Soot are composed mainly of carbon, but there is also significant hydrogen content. The current state of terminology concerning carbon and carbonaceous particle material is discussed in detail in [5]–[7]. It is conventionally assumed in atmospheric science, that there are two kinds of carbon or carbonaceous particles [5], [6]. These particles are referred as the black carbon (BC) and the “brown carbon”. BC has a unique combination of properties. These properties are strong visible light absorption with a wavelength-independent refractive index across the visible spectrum, vaporization temperature near 4000K, aggregate morphology of primary individual particles and insolubility in water and common organic solvents. BC is exclusively formed during an incomplete combustion of hydrocarbon fuels [6]. Brown carbon is a complex mixture of organic compounds which can be formed in atmosphere from BC (i.e. secondary organic aerosol) or directly from the incomplete combustion of hydrocarbon fuels [6]. Its light absorption cross-section is smaller than BC. Brown carbon has a strong wavelength dependence in the ultraviolet (UV) spectrum [8]–[11]. This spectral dependence causes the material to appear brown (or yellow) [5]. Unlike BC, brown carbon is soluble in some organic compounds. Brown carbon and BC particles are similar in size [6]. In combustion science, soot is an aerosol produced by the incomplete combustion of hydrocarbon fuels. It displays different physicochemical properties according to its maturity. Thus, the evolution from young to mature soot is characterized notably by a progressive dehydrogenation with an. 21 © 2017 Tous droits réservés.. lilliad.univ-lille.fr.
(22) Thèse de Christopher Betrancourt, Lille 1, 2017. Chapter1: Soot formation processes increasing C/H ratio from [12]. Their size evolves into a nearly spherical with the maturity in the range 1 nm [4], [13] for the incipient particles to 50 nm [14]. The ability of these particles to absorb radiation from UV to infrared (IR) spectrum is also used to define soot. This ability increases with soot maturity. Based on the ability to absorb radiations from UV to IR and the soot size, two definitions of soot are somewhat opposed in the combustion community: -. The first defines two classes of particles, the incipient particles (soot precursors) with a mean diameter of 3 nm and soot with a diameter larger than 10 nm. These two classes are distinguished by their abilities to absorb radiations in the visible and IR spectrum, the incipient particles being transparent to these radiation [13], [14] (see subsectionIII.4.1).. -. The second considers soot as particles able to absorb from UV to IR. They can be as small as 1 nm. In other words this definition defines soot as particles able to emit blackbody radiations naturally at flame temperature or induced by laser absorption (laser induced incandescence [3], [4], [15]. This is the definition of soot considered in this work.. I.2. Soot morphologies. At the microscopic scale, a soot sample is composed by near-spherical primary particles which aggregate into fractal structures of tens to hundreds of primary particles (Figure 1).. Figure 1. Transmission electron microscopy (TEM) image of Diesel soot aggregate composed of spherical primary particles [16](a) and scanning electron microscopy (SEM) image of soot aggregate from biomass fire [17] (b). The morphology of soot agglomerates is described by a power-law relationship (equation (1)) [18]. This relationship results from the integration of the autocorrelation function [19], which expresses the decreasing probability of primary particles to exist at a distance of the center of gravity of the agglomerate, for increasing distance.. 22 © 2017 Tous droits réservés.. lilliad.univ-lille.fr.
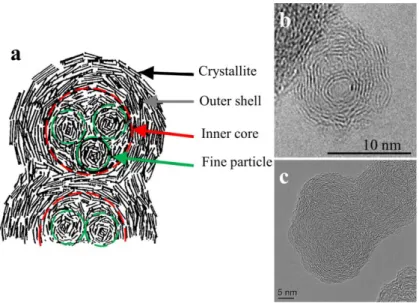
(23) Thèse de Christopher Betrancourt, Lille 1, 2017. Chapter1: Soot formation processes 𝐷𝑓. 𝑅𝑔 𝑁𝑝 = 𝑘𝑓 ( ) 𝐷𝑝 ⁄2. (1). In equation (1), Np is the number of primary particles, kf is the dimensional prefactor, Rg is the radius of gyration of the agglomerate which is the root mean square of the distances from the primary particle center of masses and the aggregate center of mass, Dp is the diameter of the primary particles and Df is the fractal dimension. The fractal dimension corresponds to the “openness” of the aggregate. Its value varies from 3 for spherical aggregate to unity for a linear chain. Figure 2 displays soot aggregates with various fractal dimensions.. Figure 2. TEM images of soot aggregate with different fractal dimension from: Diesel cylinder [20] (a), propane diffusion flame [21] (b), Diesel engine [16](c) and ethylene diffusion flame [22](d). The observation of the primary particles by high-resolution transmission electron microscopy (HRTEM) has allowed to reveal that primary particles have two distinct parts with different structures [23], [24]. Thus Ishiguro et al. [23] describes the structure of primary particles of Diesel soot as composed by: an outer shell and an inner core (Figure 3). The outer shell is composed of microcrystallites with turbostratic structure of carbon layers. The crystallites are planar in shape and are oriented perpendicular to the radius of the primary particle. The inner core (~ 3 – 4 nm) which corresponds to the central region of the primary particle, displays several fine particles (~ 1– 2 nm) with a disordered structure. This disordered structure could be an aromatic core of polyaromatic hydrocarbons (PAHs) cluster [25] (see following subsection).. 23 © 2017 Tous droits réservés.. lilliad.univ-lille.fr.
(24) Thèse de Christopher Betrancourt, Lille 1, 2017. Chapter1: Soot formation processes. Figure 3. A schematic model of microstructure of diesel soot particle described by Ishiguro et al. [23] (a) and HRTEM images of primary soot particles of: jet aircraft [26]and Diesel engine [27]. This structure has been observed in numerous studies [24], [28], [29] particularly by HRTEM images [26], [27], [29]–[33] (Figure 3.b,c). The above description is observed in mature soot. Based on HRTEM, Hurt et al. proposes another class of primary particles: the nascent soot, with a similar structure than the inner core of mature soot i.e. a disordered structure and a fine layer of crystallites [24]. Ishiguro et al. notifies that the inner core is dissolved in nitric acid, by contrast to the outer shell. This indicates that the outer shell composed of graphitic crystallites is of rigid structure, while the inner core is easy to oxidize due to its thermodynamic instability [23]. Camacho et al. observed that the surface of nascent soot is considerably more reactive than that of mature graphitized soot [34]. Inspired by the work of Hurt et al. [35], Kholghy et al. [36] proposes to schematize the different internal nanostructures of nascent and mature soot particles (Figure 4). According to these authors, nascent soot present a physical equilibrium configuration of PAHs clusters known as PAH edge-onsurface (Figure 4.a). On the contrary mature soot consist of a chemical equilibrium configuration of PAH clusters known as PAH face-on-surface. In this configuration, surface PAHs are connected to each other and form a graphitic shell (Figure 4.b). To illustrate this description the authors use HRTEM images of soot produced by pyrolysis of ethanol at 1250°C for a nascent soot with a disordered structure (Figure 4.c) and at 1650 °C for a mature soot with an ordered structure and an inner core (Figure 4.d) [29].. 24 © 2017 Tous droits réservés.. lilliad.univ-lille.fr.
(25) Thèse de Christopher Betrancourt, Lille 1, 2017. Chapter1: Soot formation processes. Figure 4. Illustration of the different internal nanostructures of nascent and mature soot particles [36]and HRTEM images of soot produced by pyrolysis of ethanol at 1250°C (c) and 1650°C (d) [29]. These studies highlight that the microstructure of soot is very dependent on the temperature and the residence time. The detailed mechanisms which lead to a given microstructure are not fully understood.. II. Soot formation processes The wide variety of soot particles observed in flames is related to the complexity of the soot formation process. Several detailed reviews cover this subject[14], [25], [37]–[40]. The soot formation in flame is strongly dependent on the gas-phase chemistry leading to soot precursors formation. The evolution of the gaseous species profiles along the flame which determines the flame chemical structure, may be viewed as constituted of three steps [41]: -. Fuel decomposition.. -. First rings formation.. -. PAHs formation and growth reactions.. 25 © 2017 Tous droits réservés.. lilliad.univ-lille.fr.
(26) Thèse de Christopher Betrancourt, Lille 1, 2017. Chapter1: Soot formation processes. Figure 5. Illustration of soot formation mechanisms in premixed flames. Created with different pictures extracted from [25], [26], [42]–[46]. The solid-phase dynamics, which describes the evolution of the soot particle ensemble, can be divided by three major processes reported on Figure 5. This figure displays a schematic representation of these processes through the evolution of the soot particle size density (dN/dlogDp) as a function of their mobility diameter (~ size see chapter 2) at different reaction times. Thus, three zones are identified: -. Zone I characterizes the nucleation process leading to the formation of the first soot particles with a size below 5 nm.. -. Zone II in the size range 5 – 20 nm illustrates the soot growth processes: surface reactions (growth and oxidation) and particle coagulation of the just nucleated particle coming from zone I.. -. Zone III highlights the soot particles agglomeration of the primary soot particle of Zone II.. 26 © 2017 Tous droits réservés.. lilliad.univ-lille.fr.
(27) Thèse de Christopher Betrancourt, Lille 1, 2017. Chapter1: Soot formation processes. II.1. Gas phase. The following description is limited to the case of alkane decomposition (the main fuel used in the current work). Other description can be found notably in [41]. Polycyclic Aromatic Hydrocarbons are considered as the main soot precursors. They are reaction intermediates of combustion. Their growth is usually based on single ring species such as benzene (C6H6), phenyl (C6H5) and cyclopentadienyl (C5H5). The formation of these aromatic species depends on species issued from the fuel decomposition. Only a brief description of the main reaction pathways is given below.. II.1.1. Fuel decomposition. Stable hydrocarbons primarily are decomposed by three pathways in fuel-rich flames [41]: -. (1) H-atom abstraction, which corresponds to the removing an H-atom of the fuel by of a chain-carrying radical X (O, OH, etc.).. -. (2) Simple fission, which is defined as the breaking of one bond (C-C or C-H bond) to produce two radical fragments.. -. (3) Complex fission, which involves multiple bonds break (C-C and C-H bond) and formation production of two stable hydrocarbons.. These pathways are followed by the dissociation of most hydrocarbon radicals in flames. It usually takes the form of β-scission which corresponds to the breaking of the weakest bond on the C-atom adjacent to the C-atom that contains the radical site. The carbon–carbon bond that connects these two C-atoms increases of one bond. These dissociation reactions form one stable and one radical product [41]. Figure 6 resumes fuel decomposition for alkane.. 27 © 2017 Tous droits réservés.. lilliad.univ-lille.fr.
(28) Thèse de Christopher Betrancourt, Lille 1, 2017. Chapter1: Soot formation processes. Figure 6. Fuel decomposition and first ring formation pathways for large alkanes adapted from [41].. II.1.2. First rings formation. The understanding of the first ring formation is a crucial step towards PAHs formation. Three main pathways have been identified in the literature to lead to the first benzene ring [37]: The C4 + C2 → C6 reactions: A first way to create a benzene ring (C6H6) was proposed by Cole et al. [47] and Frenklach et al. [48]: C2H3 + C2H2 → C4H5 C4H5 + C2H2 → C6H6 + H However, Miller and Melius [49] have shown that these reactions cannot explain the amount of benzene measured experimentally in some cases. The C3 + C3 → C6 reactions: Kern and Xie [50] proposed a second way to form a benzene ring from smaller hydrocarbons. This reaction, also mentioned by Miller and Melius [49], is the recombination of two propargyl radicals (C3H3) into a benzene ring: C3H3 + C3H3 → C6H6 The C5 + C1 → C6 reactions:. 28 © 2017 Tous droits réservés.. lilliad.univ-lille.fr.
(29) Thèse de Christopher Betrancourt, Lille 1, 2017. Chapter1: Soot formation processes Another reaction has been proposed later by Melius et al. [51] and also validated by Ikeda et al. [52]. This reaction is the addition of a methyl group on cyclopentadiene: C5H5 + CH3 → C6H6 + 2H All these pathways are involved in benzene formation. The balance between these reactions depends on the fuel and on the flames conditions [41].. II.1.3. PAHs formation and growth reactions. Few mechanisms explain the PAHs formation and their growth. The most used is the HydrogenAbstraction/ethylene-addition (HACA) mechanism [53] which describes the formation of the PAHs from benzene and their growth to larger PAHs. The HACA mechanism described by Frenklach and co-workers [48], [53]–[55] is based on two reactions occurring repetitively which are the abstraction of an hydrogen atom from aromatic (Ai) by gaseous H atom to create a radical site (Ai + H = Ai· + H2) followed by the addition of gaseous acetylene to the radical site Ai· + C2H2 = molecule. Figure 7 shows a version of the HACA reaction mechanism starting from benzene, extracted from [25].. Figure 7. A version of HACA reaction mechanism extracted from [25]. Although the HACA mechanism can be considered as dominant [56] other pathways are reported in the literature [57] such as the “phenyl addition/cyclization” (PAC) and the “methyl addition/cyclization” (MAC) [58].. 29 © 2017 Tous droits réservés.. lilliad.univ-lille.fr.
(30) Thèse de Christopher Betrancourt, Lille 1, 2017. Chapter1: Soot formation processes. II.2. II.2.1. Solid phase. The nucleation: soot particle inception. The nucleation step corresponds to the transition from the gas phase to the solid phase which gives the first solid particles. This crucial step is still speculative. Soot nucleation or inception is not yet understood despite the large number of studies on this subject [13], [14], [25], [38]. Based on abundant experimental studies, polycyclic aromatic hydrocarbons (PAHs) are widely accepted to be the precursors of soot. Wang [25] summarizes the three conceptual pathways postulated for soot nucleation (Figure 8): -. Path A is depicted by the growth of two-dimensional PAHs into curved, fullerene-like structures [59].. -. Paths B involves the physical coalescence of moderate and large-sized PAHs into stacked clusters [37], [53].. -. Path C implies light and moderate PAHs into crosslinked three-dimensional structures [60], [61]. These structures can be produced via a “chemical” coalescence mechanism [60], [62]– [65] involving reactions between aromatic molecules with an aryl radical.. Figure 8. Conceptual mechanisms of soot particle nucleation. Extracted and adapted from [42], [43] . The path A is considered too slow to account for the rates observed for soot nucleation. Paths B and C are the most supported path in the literature [25], [66]. Some theoretical and experimental research works dedicated to the study and understanding of the nucleation step are developed in section III.. 30 © 2017 Tous droits réservés.. lilliad.univ-lille.fr.
(31) Thèse de Christopher Betrancourt, Lille 1, 2017. Chapter1: Soot formation processes II.2.2. Soot particle surface reactions: growth and oxidation. Once the soot particles formed under standard conditions (see chapter 2), they grow by surface reactions and coagulation. The surface growth is mostly assumed to be governed by the HACA mechanism. The surface of soot particles is looked like the edge of a large PAH molecule, covered with C–H bonds. Abstraction of these H atoms activates the sites, forming surface radicals. The latter react with incoming gaseous species: hydrocarbons that propagate the growth and oxidizing agents that remove the carbon from the surface. The surface growth is counterbalanced by the oxidation of soot particles, which occurs predominantly by O2 molecules, OH radicals and O atoms. These reactions remove hydrogen or carbon atoms [56], [67]. This approach is commonly used to represent soot surface chemistry [15], [36], [67]–[72]. Experimental observations on soot formation in flames show that the surface growth rate of soot particles decreases with the extent of particle growth (see chapter 2). This phenomenon can be attributed to different factors: -. a decline of the H atoms concentration.. -. a decrease in the number of active sites on the soot particle surface characterized by an increase of the C/H ratios on the primary soot particles [73], [74]. -. an effect of the flame maximum or local temperature [75]–[77]. The evaluation of soot surface composition is a major aspect of soot surface modeling [25]. Additionally, the condensation of PAHs onto soot surface [25] contributes to soot mass growth.. II.2.3. Soot particle coagulation. Coagulation between particles occurs immediately after nucleation and simultaneously with surface reactions. The coagulation forms primary particles with slightly aggregated structures. Surface reactions act on these aggregated structures, smooth the surface and produce spherical or nearly spherical particles. This description is supported by TEM studies of mature soot which show inner core with multiple fine soot particles with a disordered structure (Figure 3.b, and Figure 9).. 31 © 2017 Tous droits réservés.. lilliad.univ-lille.fr.
(32) Thèse de Christopher Betrancourt, Lille 1, 2017. Chapter1: Soot formation processes. Figure 9. HRTEM images of soot extracted from [78]. Withe arrows indicate the position of the fine soot particles in the inner core. Coagulation is introduced in the modelling notably through the Smoluchowski coagulation equation which describes the time evolution of the particles number density [79].. II.2.4. Soot particle agglomeration. At some point in the flame, soot particles are observed to agglomerate, i.e., stick to each other forming aggregates of primary particles. The experimental data show that this process does not happen early in the flame where particle inception takes place (Chapter 2), but occurs later when soot particles become more mature and less reactive. Several theoretical approaches aim to reproduce the characteristics of aggregates particles in flames [44], [75], [80]–[82].. III. Knowledge on just nucleated soot particles During these four last decades many theoretical studies and experimental data have been devoted on the just nucleated soot particles. This section reviews briefly a part of this knowledge using few selected examples extracted from the literature.. III.1. Theoretical studies. In order to accurately predict the soot volume fraction for a wide range of conditions, soot models must be able to model the soot nucleation amongst others processes. In most case, the soot inception is 32 © 2017 Tous droits réservés.. lilliad.univ-lille.fr.
(33) Thèse de Christopher Betrancourt, Lille 1, 2017. Chapter1: Soot formation processes defined as the dimerization of two PAHs. Dimerization occurs upon physical collision of PAHs with empirical sticking efficiency based on different physical processes [83]. Thus the nucleation is commonly initiated by the collision between two pyrene (C16H10) with creditable results [74], [74], [75], [84]–[87] or larger PAHs as coronene (C24H12) or ovalene (C32H14). However it has been shown experimentally [88] and from theoretically studies [25], [89]–[92] that the dimerization of two pyrene or even ovalene PAHs were not thermodynamically favored at flame temperatures. These conclusions rely on different works [25], [89]–[93] where the authors have studied the stability of homo-molecular clusters of PAHs formed via nucleation paths B and C (defined in subsection II.2.1) as a function of the cluster size (number of monomer in a cluster) and temperature, from naphthalene (C10H8) to circumcoronene (C54H18). Figure 10 summarizes the ability of PAHs to grow into incipient soot particles as a function of the temperature and nucleation paths.. Figure 10. Nucleation mechanisms of PAHs in homogenous systems. The closed red squares, black stars and blue circles represent physical nucleation, no nucleation and chemical nucleation, respectively. The open olive diamonds and triangles are issued from previous studies on the PAH boiling/sublimation temperatures [94] and equilibrium temperatures for PAH dimerization [25], respectively. Soot nucleation mechanisms can be roughly divided into three regions according to PAH masses and temperatures, (i) physical nucleation: path B (white), (ii) no nucleation (light grey) and (iii) chemical nucleation: path C (dark grey). Adapted from [92]. At high temperatures (~ 2400 K), all PAHs are thermodynamically unstable [95] and react to give incipient soot particles via path C (chemical nucleation). At low temperatures 400 K, the physical nucleation (path B) of incipient soot particles is applicable to all the six types of PAHs through step-wise addition of monomers or clusters and forming incipient soot particles comprised of stacks in different orientations. With the increase of temperature, the ability to form incipient soot particles decreases with the decrease of PAH mass. Thus, naphthalene (A2), anthracene (A3) and pyrene (A4), with 2-, 3- and 4- aromatic rings, cannot grow into incipient soot particles at temperatures above 800 K. When the temperature rises to 1200 K and above, coronene (A7) with 7- aromatic rings can no longer form incipient soot particles. A similar. 33 © 2017 Tous droits réservés.. lilliad.univ-lille.fr.
(34) Thèse de Christopher Betrancourt, Lille 1, 2017. Chapter1: Soot formation processes phenomenon happens for ovalene at temperatures above 1600 K. Only circumcoronene (A19), with 19- aromatic rings, is able to form incipient soot particles even at 2000 K. These studies show that at flame temperature PAHs much larger than ovalene can play a role in nucleation. However, the peak concentrations of PAHs in premixed sooting flames drop by roughly one order of magnitude with the increment of two pericondensed rings [25]. In other words, the existence of PAH monomers with carbon numbers larger than 60 should be in extremely low concentration. Furthermore, these studies demonstrate that the physical nucleation of incipient soot is strongly dependent on the temperature as well as the PAH mass. This feature has been highlighted experimentally by studing the influence of the peak temperature on the soot particles size distribution function (PSDF) [96], [97]. Figure 11 displays the evolution of the PSDF generated by ethylene pyrolysis in a laminar-flow reactor at different temperatures and residence times. It is clear regarding the evolution of the soot PSDFs that the nucleation rate increases with the temperature which according to the authors is due to a decrease of large PAHs formation rate [96].. Figure 11. Evolution of the soot PSDF generated by ethylene pyrolysis in laminar-flow reactor at different temperature and residence time adapted from [96].. 34 © 2017 Tous droits réservés.. lilliad.univ-lille.fr.
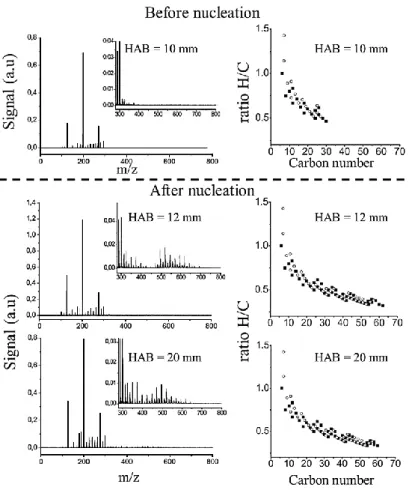
(35) Thèse de Christopher Betrancourt, Lille 1, 2017. Chapter1: Soot formation processes. III.2. Mass spectroscopy studies. In order to characterize the materials produced during the nucleation, many investigations have been performed based on the chemical analysis of samples collected by probe sampling. Depending on the sampling procedure, gaseous species, condensed products, species adsorbed onto solid particles and light particles can be analyzed. Gas phase Gas chromatography (GC) is traditionally used to analyze quantitatively low-mass molecules (up to 300 u) [98], [99]. However, the detection of large species or species adsorbed onto the soot surface remains a hard task because it requires that these species are extracted using a solvent which increases the complexity of the analysis. Another powerfull diagnostic for on line detection of large mass gaseous species in a molecular beam extracted from the flame relies on mass spectrometry (MBMS) with an ionization provided by resonant multiphoton ionization (REMPI) [100] or by single-photon ionization using tunable vacuum ultraviolet radiation provided by synchrotron sources [101]. This technique is much more complex than GC but can offer detection for high mass species. It is limited to weakly sooting flames Other approaches analyze are based on the analysis of species extracted from the flame and deposed on a filter. Thus, using the LD-PI-TOF-MS technique (Laser desorption, Photon Ionization and TimeOf-Flight Mass Spectrometry) which is generally used to study the mass of absorbed species on soot surface, Faccinetto et al. [102] analyzed the mass content of the high-mass gaseous materials from a low pressure sooting premixed methane flame. In order to differentiate the species issued from the gas phase on the adsorbed species on soot surface, the authors have collected several samples at different HAB, before and after the nucleation zone, on borosilicate filters on which soot is preferentially collected and filters covered by a layer of activated carbon in order to trap the combustion products whatever their physical state. From the comparison between the two series of mass spectra, gas contribution could be qualitatively determined. Fragment-free mass spectra were obtained by selecting appropriate desorption and ionization laser fluences on activated carbon filters (Figure 12). The detected PAHs constitute a regular sequence from 78 u (benzene, C6H6) up to about 792 u (C64H24), which varies along the HAB.. 35 © 2017 Tous droits réservés.. lilliad.univ-lille.fr.
(36) Thèse de Christopher Betrancourt, Lille 1, 2017. Chapter1: Soot formation processes. Figure 12. Gas phase mass spectra obtained in a low pressure sooting premixed methane flame (Φ=2.32) (left side) and H/C ratio vs carbon number of the mass spectra (right side) at different HAB. Adapted from [102]. Figure 12 displays the evolution of the gas phase mass spectra obtained in a low pressure sooting premixed methane flame (Φ=2.32) (left side) and the corresponding H/C ratio vs carbon number of the mass spectra (right side) before the nucleation (HAB =10 mm) and after the nucleation (HAB > 10 mm). Before soot inception, the mass spectrum reveals the PAHs presence with mass below 400 u and less than 30 carbons. After the nucleation, a second group of PAHs with higher mass (450-800 u) and more than 60 carbons are detected. According to the authors, these large PAHs might originate from high-mass PAHs formed via growth reaction, possibly via the HACA mechanism or from the clustering of light PAH in which the nascent soot particles may act as reaction intermediates. The absence of high masses just before the soot inception region suggests that the nucleation process is led by relatively small PAHs (<400 u: Ovalene). Similar observations were found in [103]–[107]. Species on soot surface and small particles The MBMS, REMPI or single photo ionization techniques combined with a desorption-based technique provide useful information on the species adsorbed on the soot surface [102], [108]–[113]. 36 © 2017 Tous droits réservés.. lilliad.univ-lille.fr.
(37) Thèse de Christopher Betrancourt, Lille 1, 2017. Chapter1: Soot formation processes Indeed, their combination leads to the desorption of the most volatile species from the underlying nanoparticle matrix without destruction of the matrix itself. Several combination of these techniques are reported in the literature. Thus, Dobbins and co-workers [110], [111] analyzed soot precursor particles collected from a diffusion flame by laser microprobe mass spectrometry (LMMS). They identified the mass sequence as dominated by benzenoid PAHs stabilomers with mass as large as 472 u, which was attributed to the molecule C38H16 with 12 hexagonal rings. Dobbins interpreted the frequent occurrence of masses 252– 276–300 u as evidence that the PAHs in the mass range 200–300 u are those involved in the formation pathway of carbonaceous soot. Conversely, the absence of higher-mass PAHs was interpreted as an evidence that they do not play a role in the formation of carbonaceous soot. Important advances have been achieved through photoionization mass spectrometry (PIMS), which allows to study the mass spectra from heavy PAHs and light particles up to 1 Mu [107]. Thus, Grotheer et al. [114] have investigated using PIMS the evolution of the mass spectra up to 90 Ku in atmospheric sooting premixed ethylene flames as a function of the HAB. The authors have converted the mass spectra into PSDF assuming a density of 1 g.cm-3. The results are displayed in Figure 13.. Figure 13. PSDFs of nascent nanoparticles as a function of HAB in atmospheric sooting premixed ethylene flames using PIMS [114]. The authors show that the nano particles distribution occur in two modes, called A and B. This feature is most pronounced at low heights above the burner. With regards to mass the mode B seems to remain essentially unchanged whereas the first mode becomes heavier and heavier with increasing HAB and the bimodal feature is less and less accentuated. According to their observations, the authors analyze these results through two hypotheses: -. First, the mode A is identified as “D’Alessio particles” with a mass ~30 Ku (see subsection III.4.1), and the mode B as “Dobbins particles”, i.e. micro-crystallites exhibiting a minimum 37. © 2017 Tous droits réservés.. lilliad.univ-lille.fr.
(38) Thèse de Christopher Betrancourt, Lille 1, 2017. Chapter1: Soot formation processes of edge sites and showing rigidity as well as periodicity and a mass ~60 Ku. The resulting stability is also reflected by the relatively high fragmentation threshold ~ 2.3 mW.cm-2. -. Secondly, they propose to interpret the mode B as corresponding to the inner core of the soot particles described by Ishiguro et al. [23] and the mode A to the fine particles encapsulated in the inner core (Figure 3). This suggestion is supported according to the authors by a smooth and continuous transition from B particles to soot.. The detection of these heavier structures notably by Stirn et al. [115], Siegmann et al. [103] and Grotheer et al. [106], [107], [114] lead to the question of the size and morphology of the nascent particles.. III.3. Particles size distribution function. The experimental determination of the PSDFs from nascent to mature soot particles and their evolutions along the flame are very useful for the development of accurate soot formation models. Several experimental techniques are able to measure the PSDFs with various size resolutions: -. ex-situ techniques are the scanning mobility particle sizer (SMPS), helium-ion microscopy (HIM), transmission electron microscopy (TEM), atomic force microscopy (AFM). -. in-situ techniques are the small angle X-ray scattering (SAXS) [116]–[118], small angle neutron scattering (SANS) [119], [120], elastic light scattering and laser induced incandescence (LII).. It should be noted that three of these techniques (LII, SMPS and HIM) are used and developed in chapter 2 in order to identify the just nucleated soot particles. The widespread technique used in the combustion community to measure the PSDFs is the SMPS technique since the pioneer work of Kasper and Siegmann et al. [121]. This technique can provide the PSDF from 1 nm to few micrometers [25]. In general, PSDFs in sooting flames consist of a bimodal or in an apparent unimodal feature which is persistent along the flame. The first mode attributed to the nascent particles, is measured in the lower size range (down to 5 nm) and the second mode in the upper size range (> 10 nm) is attributed to soot primary particles and coagulated soot particles as discussed notably in [13], [25].. 38 © 2017 Tous droits réservés.. lilliad.univ-lille.fr.
(39) Thèse de Christopher Betrancourt, Lille 1, 2017. Chapter1: Soot formation processes. Figure 14. PSDFs measured at various heights along the burner axis in atmospheric ethylene premixed flames. Extracted from [97]. Figure 14 shows a typical example of PSDFs measured here by Gu et al. [97] in atmospheric ethylene premixed flames at different heights and equivalence ratios. In these premixed flames, small soot particles just a few nanometers in size form a nucleation tail that appear to exist at all stages of growth. The persistence of first mode leads to a bimodal PSDF even in the later stage of soot growth (i.e. high heights). These observations are evidences that all the soot processes (nucleation, growth processes and aggregation) happen nearly simultaneously in sooting premixed flames. It is noteworthy that the PSDFs become narrower when the equivalence ratio decreases. The persistence of the nucleation along the flame and the decrease of the mean diameter of the primary soot particles with decrease equivalence ratio have been highlighted also by Stirn et al. [115] in an atmospheric ethylene premixed flame. The authors compare the evolution of the mean particles diameters obtained by LII, SMPS and PIMS technique at fixed height for various equivalence ratios. They observed the persistence of a first zone around 3 nm for all equivalence ratios attributed to the soot precursors. A second zone is assigned to the primary soot particles with a mean diameter which increases with the equivalence ratio.. 39 © 2017 Tous droits réservés.. lilliad.univ-lille.fr.
(40) Thèse de Christopher Betrancourt, Lille 1, 2017. Chapter1: Soot formation processes. Figure 15. PSDFs obtained at heights of 0.5, 0.8, and 1.2 cm and imaged by helium-ion microscopy (HIM), showing representative primary and aggregate structures. Particles shown in the hexagons are in the apparent size range of 4–8 nm, and those in the squares are 14–18 nm. Particles shown in the circles are apparent aggregates. Adapted from [122] . Schenk et al. [122] showed that helium-ion microscopy (HIM) technique allows to measure the PSDFs and visualize the nascent particles as small as 2 nm and assigned to soot. Example of such PSDFs obtained at different heights in atmospheric ethylene premixed flames and representative HIM images are displayed in Figure 15. The HIM images reveal clearly the presence of nascent soot particles with a size of 4 nm and several soot primary particles alone or agglomerated at each height which is in agreement with the literature. This observation highlights the experimental difficulty to study the just nucleated soot particles free from other processes. It is also noteworthy that the bimodal feature is less pronounced than for SMPS measurements (see overhead).. 40 © 2017 Tous droits réservés.. lilliad.univ-lille.fr.
Figure
![Figure 2. TEM images of soot aggregate with different fractal dimension from: Diesel cylinder [20]](https://thumb-eu.123doks.com/thumbv2/123doknet/3661037.108197/23.892.110.784.421.596/figure-images-aggregate-different-fractal-dimension-diesel-cylinder.webp)

+7
Documents relatifs
Distribution automatique Distribution automatique centralisée centralisée Firewall 1 Firewall 3 Officier de sécurité Politique de contrôle d ’accès Modèle du
Even though almost all of these “Big YouTubers” have started creating videos when they were teenagers themselves, the platform has changed significantly in the
1: Distribution of the dijet invariant mass of W + 2 jets events, compared with cumulative contributions from the QCD background (derived from data), the simulation of W +jets
En France, les chevaux sont présents sur tout l’hexagone, et plus particuliè- rement dans les zones herbagères du Grand-Ouest (notamment en Basse- Normandie) et de moyennes
Malheureusement, aussitôt que la voûte protégeant le lac a été percée, l’eau est remontée à la surface sous la force de la pression immense qui régnait dans cette poche et
Stepanov Institute of Physics, National Academy of Sciences of Belarus, Minsk, Republic of Belarus 91 National Scientific and Educational Centre for Particle and High Energy
Quelque chose en plus, pour ainsi dire, a eu lieu – et a encore lieu dans l’expérience qu’en fait le lecteur, malgré – ou grâce à – la distance synchronique (l’œuvre est
Today, there exists an estimated $33 trillion worth of constructed assets in North America, with 20 percent of that asset base invested in municipal infrastructure. In North America
