
Université de Montréal
Département de chimie, Faculté des arts et des sciences
Cette thèse intitulée
Associations concave-convexe entre le C60 et les dérivés du phosphangulène, une triarylphosphine de forme conique
Présentée par Alice Heskia
A été évalué par un jury composé des personnes suivantes
Gary Hanan Président-rapporteur James. D. Wuest Directeur de recherche Andreea-Ruxandra Schmitzer Membre du jury Derek Schipper Examinateur externe
Université de Montréal
Associations concave-convexe entre le C
60et les dérivés du
phosphangulène, une triarylphosphine de forme conique
par Alice Heskia
Département de chimie Faculté des arts et des sciences
Thèse présentée à la Faculté des études supérieures en vue de l’obtention du grade de
Philosophiae Doctor (Ph. D.) en chimie
Résumé
La performance des dispositifs moléculaires, tels que les cellules solaires ou des diodes électroluminescentes, peut être optimisée en contrôlant l’organisation des composantes des couches actives. Les fullerènes et leurs dérivés sont souvant utilisés dans des dispositifs photovoltaïques pour leurs propriétés électro-acceptrices et conductrices. Il est donc important de concevoir des structures moléculaires pouvant interagir avec les unités fullerène et ainsi de diriger leur organisation. Le caractère électro-accepteur et la forme convexe des fullerènes favorisent le choix d’un partenaire de surface complémentaire : électro-donneuse et concave. Le phosphangulène, une triarylphosphine hexacyclique qui répond à ces critères et est aisément fonctionnalisable, a été choisi comme structure de base pour la synthèse des cibles.
La présente thèse décrit la synthèse et la structure des dérivés du phosphangulène et des cocristaux obtenus avec les fullerènes au travers de quatre articles soumis au courant de ce doctorat. Le premier article décrit la synthèse des dérivés chalcogénures du phosphangulène. Ces dérivés-ci présentent de nombreux polymorphes, résultant en de bons candidats pour la cocristallisation. Le second article se concentre sur les cocristaux de ces dérivés chalcogénures avec le C60 et le C70. Dans le troisième article, nous décrivons les complexes obtenus par la coordination du phosphangulène sur des métaux de transition. Enfin, dans le quatrième article, nous parlons des sels du µ-nitrido-bis(phosphangulène), un cation organique où deux unités phosphangulène sont pontées par un atome d’azote, ainsi que des cocristaux résultant de la combinaison de ce ligand pontant et du C60.
Abstract
The performance of molecular devices such as solar cells or light-emitting diodes can be optimized by controlling how the active-layer components are organized. Fullerenes and their derivatives are often used in photovoltaic devices for their electron-accepting and conductive properties. It is therefore important to design molecular structures that can interact with fullerene units and thus direct their organization. The electron-accepting character and convex shape of fullerenes favor the choice of a partner with a complementary surface that is electron-donating and concave. Phosphangulene, a hexacyclic triarylphosphine that meets these criteria and is easily functionalizable, was chosen as the basic structure for synthesizing targets.
This thesis describes the synthesis and structure of phosphangulene derivatives and their cocrystals obtained with fullerenes through four articles submitted during this doctorate. The first article describes the synthesis of chalcogenide derivatives of phosphangulene. These derivatives have many polymorphs, resulting in good candidates for cocrystallization. The second article focuses on cocrystals of these chalcogenide derivatives with C60 and C70. In the third article, we describe the complexes obtained by the coordination of phosphangulene with transition metals. Finally, in the fourth article, we talk about the salts of μ-nitrido-bis (phosphangulene), an organic cation where two phosphangulene units are bridged by a nitrogen atom, as well as the crystals resulting from the combination of this bridging ligand and C60.
Keywords: fullerenes, concave-convex interactions, phosphine, phosphangulene, polymorphism, cocrystals, coordination complexes, organic salts.
Table des matières
Résumé ... II Abstract ... III Table des matières... IV Table des tableaux...X Table des schémas... XI Table des équations ... XII Table des figures ...XIII Index des abréviations... XLIV Remerciements ... XLVIII
Chapitre 1 : Introduction ... 1
1.1 Introduction ... 2
1.2 Cellules photovoltaïques organiques (OPV) ... 3
1.2.1 Fonctionnement... 5
1.2.2 Problèmes de morphologie ... 6
1.3 Les fullerènes et leurs propriétés ... 10
1.3.1 Découverte ... 10
1.3.2 Structure ... 11
1.3.4 Propriétés rédox ... 19
1.3.5 Conductivité ... 23
1.3.6 Organisation à l’état solide ... 25
1.4 Associations supramoléculaires de fullerènes ... 30
1.4.1 Interactions concaves-convexes ... 31
1.4.2 Hôtes de forme ceinture ... 34
1.4.3 Hôtes de forme bol ... 36
1.5 Phosphangulène ... 51
1.5.1 Propriétés physiques ... 53
1.5.2 Réactivité du phosphore et du phosphangulène ... 58
1.6 Objectifs de la thèse ... 72
Chapitre 2 : Polymorphisme des chalcogénures du phosphangulène ... 88
2.1 Introduction ... 89 2.1.1 Polymorphisme ... 90 2.1.2 Surfaces de Hirshfeld ... 93 2.1.3 Objectifs ... 97 2.2 Article 1 ... 98 2.2.1 Abstract ... 99
2.2.3 Results and Discussion ... 105
2.2.4 Conclusions ... 141
2.2.5 Experimental Section ... 144
2.2.6 References ... 148
2.2.7 Table of Contents Graphic ... 154
2.3 Conclusions ... 155
Chapitre 3 : Cocristaux entre les chalcogénures du phosphangulène et les fullerènes .. 156
3.1 Introduction ... 157
3.1.1 Problèmes d’empilement : polymorphisme, Z’ élevé et cocristaux ... 158
3.1.2 Objectifs ... 159
3.2 Article 2 ... 160
3.2.1 Abstract ... 161
3.2.2 Introduction ... 162
3.2.3 Results and Discussion ... 167
3.2.4 Conclusions ... 195
3.2.5 Experimental Section ... 198
3.2.6 References ... 201
3.2.7 Table of Contents Graphic ... 204
Chapitre 4 : Complexes de coordination du phosphangulène sur les métaux de transition
... 206
4.1 Introduction ... 207
4.1.1 Les phosphines comme ligands ... 208
4.1.2 Objectifs ... 210
4.2 Article 3 ... 211
4.2.1 Abstract ... 212
4.2.2 Introduction ... 213
4.2.3 Results and Discussion ... 217
4.2.4 Conclusions ... 245
4.2.5 Experimental Section ... 246
4.2.6 References ... 249
4.2.7 Table of Contents Graphic ... 260
4.3 Conclusions ... 261
Chapitre 5 : Sels de bis(phosphangulène)iminium ... 262
5.1 Introduction ... 263
5.1.1 Cation μ-nitrido-bis(triphénylphosphine) ... 264
5.2.1 Abstract ... 268
5.2.2 Introduction ... 269
5.2.3 Results and Discussion ... 272
5.2.4 Conclusions ... 285
5.2.5 Experimental Section ... 286
5.2.6 References ... 290
5.2.7 Table of Contents Graphic ... 298
5.3 Conclusions ... 299
Chapitre 6 : Conclusions et perspectives ... 300
6.1 Résumé et retour sur les objectifs ... 301
6.2 Perspectives ... 303
6.2.1 Caractérisation en photovoltaïque... 303
6.2.2 Autres dérivés du phosphangulène ... 303
6.3 Conclusions ... 307
6.4 Références ... 308
Chapitre 7: Annexes ... 309
7.1 Informations supplémentaires de l’article 1 ... 310
7.1.1 Phosphangulene oxide (2a) ... 311
7.1.3 Phosphangulene selenide (2c) ... 328
7.1.4 Mixed crystals ... 331
7.1.5 References ... 335
7.2 Informations supplémentaires de l’article 2 ... 336
7.2.1 Additional Crystallographic Information ... 337
7.2.2 ORTEP Diagrams ... 338
7.2.3 References ... 347
7.3 Informations supplémentaires de l’article 3 ... 348
7.3.1 Powder X-Ray Diffraction ... 349
7.3.2 Low-Temperature 31P NMR Spectroscopy ... 350
7.3.3 Solid-State 31P NMR Spectroscopy ... 353
7.3.4 Additional Crystallographic Information ... 357
7.3.5 Descriptions of Additional Structures ... 358
7.3.6 ORTEP Diagrams ... 366
7.3.7 References ... 377
7.4 Informations supplémentaires de l’article 4 ... 379
7.4.1 Additional Crystallographic Details ... 380
Table des tableaux
Tableau 1.1 : Déplacement chimique de l’hélium endohèdral en RMN du 3He pour différentes espèces de fullerènes neutres et hexaanioniques. ... 19 Tableau 1.2 : Potentiels de réduction versus l’électrode de ferrocène (E½ vs Fc/Fc+) pour le C60 et le C70 tels qu’obtenus par Echegoyen et ses collaborateurs.42 ... 21 Tableau 1.3 : Classification des structures ou fonctions du phosphore les plus courantes. La notation de valence indique par λ la covalence et σ le nombre de coordination.. 65 Tableau 2.1 : Exemples en deux dimensions de la construction de réseaux cristallins à partir de l’unité asymétrique et du groupe d’espace. ... 91 Table 2.1 : Crystallographic data for polymorphs A, B, C, D, and E of phosphangulene oxide (2a). ... 109 Table 2.2 : Crystallographic data for polymorphs A and B of phosphangulene sulfide (2b) and for polymorphs A, B, and C of phosphangulene selenide (2c). ... 128 Table 3.1 : Crystallographic Data for Cocrystals of Phosphangulene Oxide (2a) with C60 .. 169 Table 3.2 : Crystallographic Data for Cocrystals of Phosphangulene Sulfide (2b) with C60 and C70 ... 182 Table 3.3 : Crystallographic Data for Cocrystals of Phosphangulene Selenide (2c) with C60192 Table 4.1 : Crystallographic Data for Salts of [Ag(Phang)4]+ and [Cu(Phang)4]+ ... 219 Table 4.2 : Crystallographic Data for Complexes of Phosphangulene with Cu(I) Halides ... 233 Table 4.3 : Crystallographic Data for Complexes Formed by the Reaction of Phosphangulene with Ag(I) Trifluoromethanesulfonate and Perchlorate ... 238 Table 5.1 : Crystallographic Data for Salts of [(Phang)2N]+ ... 274
Table 7.1 : Crystal structure data for polymorph A of phosphangulene oxide (2a) crystallized from EtOH. ... 311 Table 7.2 : Crystal structure data for mixed crystals of phosphangulene (1) and phosphangulene oxide (2a) crystallized from EtOAc. ... 331 Table 7.3 : Crystal structure data for mixed crystals of phosphangulene oxide (2a) and phosphangulene sulfide (2b) crystallized from CH2Cl2/hexane. ... 333 Table 7.4 : NMR Parameters Extracted by Simulating the 31P MAS NMR Spectrum of [Ag(Phang)4]+ BF4- ... 356
Table des schémas
Schéma 1.1 : Configuration électronique de la couche de valence du phosphore. a) État fondamental. b) État trivalent. c) État pentavalent. ... 60 Schéma 1.2 : Substitution électrophile de la phosphine nucléophile produisant un sel organique. ... 67 Schéma 1.3 : Activation du phosphore suite à une attaque nucléophile sur le Br2. L’intermédiaire obtenu est alors plus électrophile et donc susceptible aux attaques nucléophiles... 67 Schéma 1.4 : Substitution nucléophile du PCl3 par l’eau. Le PCl3 joue le rôle d’électrophile. 69 Schéma 1.5 : Attaque nucléophile sur un atome de phosphore cationique et donc activé (λ4σ4).
... 70 Schéma 1.6 : Mécanisme proposé pour la formation de composés de µ-nitrido bis(triphénylphosphore) (PNP) en se basant sur l’intermédiaire proposé par Ruff et al.179 ... 70
Table des équations
Équation 1.1 : Angle de pyramidalisation θp défini comme la différence entre l’angle θσπ (entre le vecteur d’axe de l’orbitale π (π-orbital axis vector; POAV) et l’orbitale σ d’un des liens carbone-carbone) et 90°. ... 14 Équation 2.1 : Masse moléculaire w(r) définie par le quotient de la densité électronique d’une promolécule ρpromolécule(r), sur celle du procristal ρprocristal(r). Ces densités sont la
somme des densités électroniques moyennes sphériques des atomes pris individuellement ρA(r) respectivement au sein de la molécule et du cristal. ... 93
Équation 2.2 : Distance de contact normalisée dnorm, définie par la distance d’un point sur une
surface au plus proche atome externe à la surface (la promolécule) de, la distance
d’un point sur une surface au plus proche atome interne à la surface (la promolécule) di et le rayon de van der Waals rvdW.iv ... 95
Table des figures
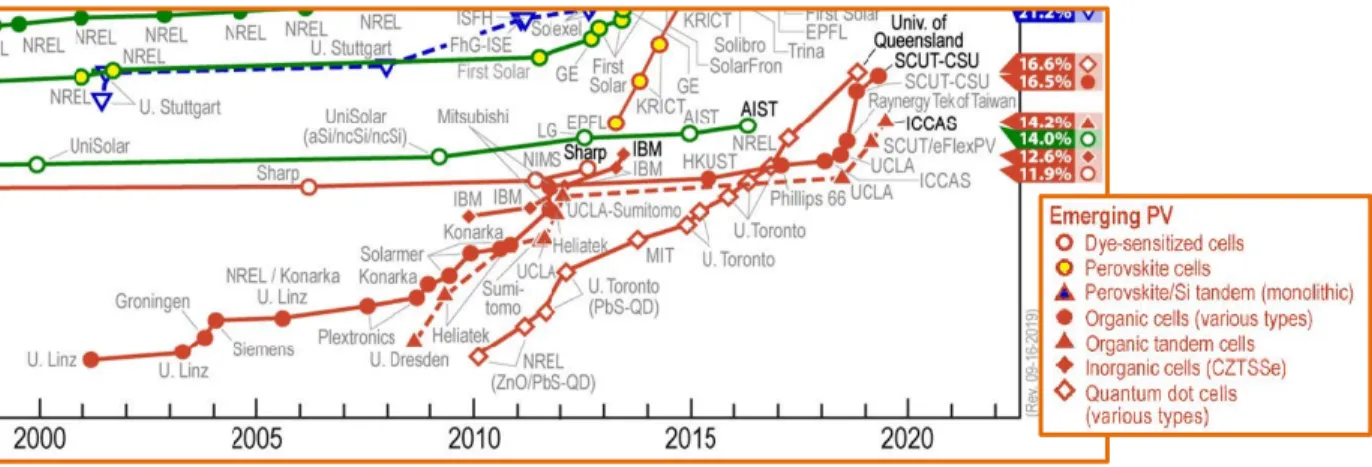
Figure 1.1 : Évolution des technologies émergentes en énergie solaire. Image tirée de la référence 10. ... 4 Figure 1.2 : Fonctionnement d'une cellule solaire organique de morphologie de type bicouche. Les niveaux énergétiques relatifs des orbitales frontières y sont schématisés. Il y a 1) absorption des photons par la composante donneur générant ainsi des excitons (électron excité pairé avec la charge positive générée par son absence), 2) diffusion des excitons dans le matériel jusqu'à l'interface donneur-accepteur, 3) dissociation des charges, l'électron excité se rendant dans la LUMO de l'accepteur et 4) transport des charges jusqu'aux électrodes. Le schéma est une gracieuseté de Dr. Minh-Trung Dang, ancien stagiaire postdoctoral dans le groupe Wuest. ... 6 Figure 1.3 : Représentations des différents types de morphologies d’hétérojonction dans les cellules solaires. a) Mélange « homogène » ou avec de très petits domaines de donneurs et d’accepteurs. b) Hétérojonction en bicouche. c) Morphologie idéale de peignes imbriqués, où LD est la distance de diffusion. d) Morphologie communément employée d’hétérojonction de masse. Image tirée de la référence 11 ... 7 Figure 1.4 : Schéma de l’appareil employé pour la formation et l’analyse des agrégats de carbone résultant en la découverte des fullerènes. Image originale tirée de la référence 23. ... 11 Figure 1.5 : a) Structure du C60 montrant les 12 cycles à 5 en rouge. Chaque cycle à 5 est
molécule. b) Structure du C70 montrant les deux cycles à 5 par où l’axe de symétrie C5 passe. ... 12
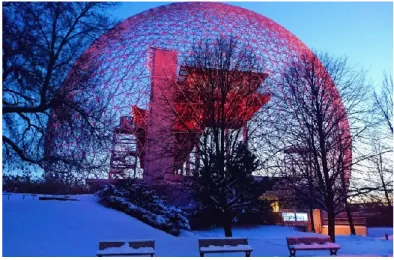
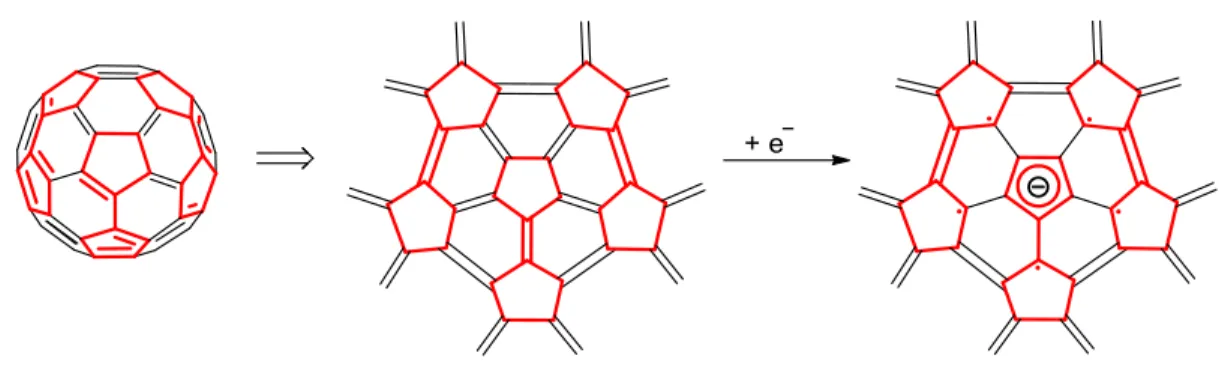
Figure 1.6 : Biosphère de Montréal, conçue par l’architecte Buckminster Fuller. Image tirée de la référence 25. ... 13 Figure 1.7 : Exemple d’angles de pyramidalisation. Image tirée de la référence 27. ... 15 Figure 1.8 : Courbe de réhybridation selon l’angle de pyramidalisation. Graphique tiré de la référence 26. ... 15 Figure 1.9 : Spectre RMN du 3He (381 MHz) de composés de fullerène endohèdraux en solution dans le 1-méthylnaphtalène, obtenus en soumettant un mélange de C60 et de C70 à une pression de 2500 atm de 3He à 600 °C pendant 5 h. Image tirée de la référence 33. ... 17 Figure 1.10 : a) Structure du pyracyclène. b) Unité pyracyclène dans le C60 accentuée en rouge. ... 20 Figure 1.11 : Fragment d’une molécule de C60 centré sur un cycle à cinq qui devient aromatique suite à une réduction. Trois paires de cycles à cinq constituant un pyracyclène ont été accentuées en rouge. On retrouve deux fois ce fragment dans le C60. Il y a donc six unités pyracyclène. ... 20 Figure 1.12 : Réduction du C60 (a) et du C70 (b) dans l’acétonitrile/toluène à -10 °C. Cyclovoltampérogrammes (courbes supérieures dans chaque graphique) à une vitesse de balayage de 100 mV/s; et voltampérogrammes différentiels (differential pulse voltammetry) (courbes inférieures dans chaque graphique) à impulsion de 50 mV, de durée d’impulsion de 50 ms, sur une période de 300 ms et à une vitesse de balayage de 25 mV/s. Image tirée de la référence 42. ... 22
Figure 1.13 : a) Température critique (Tc) de supraconductivité pour divers composés M3C60 selon la constante cubique de maille a0 pour les groupes d’espace face centrée
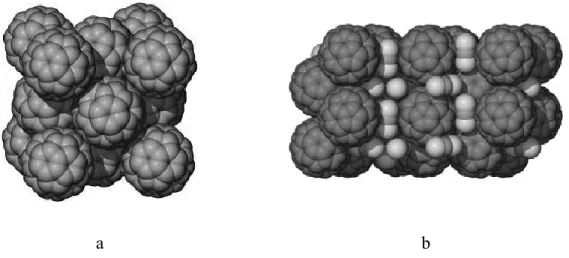
cubique (M3C60) et cubique primitif (Na2RbC60 ou Na2CsC60). Image tirée de la référence 46. b) Diagramme d’énergie des orbitales du C603- dans un sel de type M3C60 montrant la bande de valence et la bande de conduction. ... 24 Figure 1.14 : Mailles élémentaires pour un sel de type M3C60. a) Cubique face centrée. b) Cubique centré. Image tirée de la référence 46. ... 25 Figure 1.15 : Types d’organisations en 1D à l’état solide pour le C60. a) Mono-colonne obtenue pour le clathrate 1,3,5-triphénylbenzène · C60 · PhCl (distance centroïde-centroïde : 10,10 Å).56 b) Chaînes en zigzag obtenues pour le C60 · calix[5]arène (distance centroïde-centroïde : 10,03 Å).57 c) Arrangement en double-colonnes dans un complexe de siloxane/C60 (distance centroïde-centroïde : 9,85–10,1 Å).58 Images tirées de la référence 55. ... 27 Figure 1.16 : Types d’organisations en 2D à l’état solide pour le C60 . a) Formation hexagonale comme dans le (C60)1.5(cyclotrivératrylène) (distance centroïde-centroïde : 10,00-10,2 Å).59 b) Arrangement en feuillets ondulés comme dans un complexe tétraazacyclotétradécènenickel/C60 (distance centroïde-centroïde : 9,99-10,07 Å).60 c) Arrangement en ruche d’abeille du C60 lorsque cocristallisé avec le tétraphénylporphyrine (distance centroïde-centroïde : 9,98 Å).61 Images tirées de la référence 55. ... 28 Figure 1.17 : Types d’organisations en 3D à l’état solide pour le C60. a) C60 à l’état pur (structure fcc). b) (C60)1,5 · CS2 (distance centroïde-centroïde la plus courte : 9,96
Figure 1.18 : Exemples d’hôtes classiques en chimie supramoléculaire. a) Aza-éther couronnes. b) Calixarènes. c) Résorcinarènes. d) Cyclotrivératrylènes. e) Cyclodextrines. ... 31 Figure 1.19 : Représentation des fullerènes imbriqués tels des poupées russes. Image tirée de la référence 87. ... 32 Figure 1.20 : Représentations du système π du benzène. a) Système plan. b) Système incurvé.
... 33 Figure 1.21 : Représentations des systèmes π. a) Coronène. b) Corannulène. ... 33 Figure 1.22 : Complexe de C60 dans un pillar[10]arène. Image tirée de la référence 105. ... 34 Figure 1.23 : Complexe de type oignon de C60 et de cycloparaphénylacétylènes. Image tirée de la référence 108. ... 35 Figure 1.24 : Complexe de C60 dans un [10]cycloparaphénylène. Image tirée de la référence 110. ... 35 Figure 1.25 : a) Structure du corannulène. b) Présence de corannulène comme fragment dans le C60. ... 37 Figure 1.26: a) Structure du sumanène. b) Présence de sumanène comme fragment dans le C60. ... 37 Figure 1.27 : a) et b) Dérivés sulfurés du corannulène développés par Georghiou. c) Structure tridimensionnelle hypothétique (n’est pas une image résultant d’une étude par diffraction à rayons X).115-116 Image c tirée de la référence 116. ... 39 Figure 1.28 : Dérivés thioaryles du sumanène permettant la formation d’un complexe d’inclusion avec le C60. Image tirée de la référence 117. ... 39 Figure 1.29 : Buckycatcher de Sygula et al.118 ... 40
Figure 1.30 : Hôtes corannulène déposés sur une surface de Cu(110). b) Image de microscopie à effet tunnel à haute résolution. c) Modélisation de la surface. d) Schématisation de l’association du C60 sur les sites corannulène. Image tirée de la référence 132. ... 41 Figure 1.31 : Structure du dibenzo[a,g]corannulène présentée dans les travaux de Filatov et al.134 ... 42 Figure 1.32 : Structure de c-hexabenzocoronène. Le cercle rouge indique la zone congestionnée stériquement. ... 43 Figure 1.33 : Structure des cristaux de c-hexabenzocoronène obtenus dans
1,2,4-trichlorobenzène. Les atomes d’hydrogène ont été soustraits pour plus de clarté. a) Vue de face avec les points de pivots encerclés. b) et c) Vues du côté. d) Vue de côté pour un segment acène où les autres atomes de c-hexabenzocoronène ont été retirés. Image tirée de la référence 140. ... 44 Figure 1.34 : Structure d’un cocristal de c-hexabenzocoronène et de C60. Image tirée de la référence 139. ... 45 Figure 1.35 : a) Schématisation de l’interface « rotule » (« ball-and-socket ») dans une cellule de type bicouche et de type bulk heterojunction. b) Structure de c-hexabenzocoronène. c) Corrélation entre la représentation schématique de la rotule et la structure moléculaire réelle obtenue d’un cocristal de hexabenzocoronène et du C60. d) Organisation dans un cocristal de c-hexabenzocoronène et C60 tel qu’obtenu par cristallisation à partir d’une solution saturée des deux composantes. Image tirée de la référence 142. ... 46
Figure 1.36 : Structures de l’hexabenzocoronène planaire (f-hexabenzocoronène) et contorsionné (c-hexabenzocoronène). Image tirée de la référence 149. ... 47 Figure 1.37 : Le changement de géométrie de l’atome centrale de bore suite à une coordination permet de déformer le plan subphtalocyanine vers une coupe pouvant encapsuler une molécule de C60. Image tirée de la référence 156. ... 49 Figure 1.38 : Le changement de géométrie de l’atome centrale de zinc suite à une coordination permet de déformer le plan porphyrine vers une coupe pouvant encapsuler une molécule de C60. ... 49 Figure 1.39 : Complexe de C60 avec les dérivés phénylacétylène du phosphangulène (1) et de l’oxyde de phosphangulène tel que rapporté par Yamamura et ses associés.161, 163 Image tirée de la référence 163. ... 52 Figure 1.40 : Composé fusionnant deux cœurs altérés du phosphangulène (1). Image tirée de la référence 162. ... 53 Figure 1.41 : Angles et profondeurs de cône tels que mesurés par Yamamura, Nabeshima et leurs associés165 pour Phang (phosphangulène); Phang-O, son oxyde; Phang-S, son sulfure; et Phang-Se, son sélénure. *Rapportée par Krebs originellement.160 ... 54 Figure 1.42 : Substitution des oxygènes pontant pour des soufres. Image tirée de la référence 165. ... 55 Figure 1.43 : Types d’empilement dans un cristal pour les molécules incurvées. Image tirée de la référence 164. ... 57 Figure 1.44 : Exemples des trois types d’empilement A-C pour les molécules incurvées. a) Colonnes parallèles, illustrées par le cas du phosphangulène (1). b) Colonnes
anti-parallèles, illustrées par l’analogue avec trois atomes de soufre. c) Organisation alternative, exemplifiée par le corannulène. ... 57 Figure 1.45 : Interprétations du lien P-X chez les composés tétraédriques neutres du phosphore. a) Lien P-O. b) Lien P-C. Forme I = double lien covalent et forme II = lien simple polarisé. ... 61 Figure 1.46 : Liens π entre les orbitales 3d vacantes du phosphore et les doublets libres dans les orbitales 2p de l’oxygène. a) Interactions entre les orbitales 3dxy du phosphore et 2px de l’oxygène. b) Interactions entre les orbitales 3dyz du phosphore et 2pz de l’oxygène. ... 63 Figure 1.47 : a) Conformation des substituants autour du lien P-O. b) Hyperconjugaison négative d’un des doublets de l’oxygène (en rouge) vers l’orbitale anti-liante P-H (vert). ... 64 Figure 1.48 : Doublet libre sur les phosphines λ3σ3 et le phosphangulène (1). ... 66 Figure 1.49 : Coordination du doublet libre de la phosphine vers l’orbitale vacante d’un acide de Lewis tel qu’un métal de transition. ... 68 Figure 2.1: Illustration des surfaces de Hirshfeld sur le benzène. a) Contours de la fonction de masse wA(r) pour des valeurs de 0.1 et 0.5. b) Cartographie de la distance d’un
point sur une surface au plus proche atome externe à la surface (de la promolécule) de, sur cette surface de Hirshfeld. Le gradient va de la distance de la
plus courte en rouge à la plus longue en bleu avec le vert pour intermédiaire. Image tirée de : Spackman, M. A.; Jayatilaka, D., Hirshfeld surface analysis. CrystEngComm 2009, 11 (1), 19-32. ... 94
Figure 2.2 : Comparaison des tracés empreintes digitales des surfaces d’Hirshfeld pour l’acide 2-chloro-4-nitrobenzoïque. a) La forme I comportant une seule molécule. b) La forme II comportant quatre molécules différentes dans l’unité asymétrique (seules deux d’entre elles représentées ici). Les interactions intermoléculaires clées sont encerclées et annotées en rouge. Image tirée de : Spackman, M. A.; Jayatilaka, D., Hirshfeld surface analysis. CrystEngComm 2009, 11 (1), 19-32. 96 Figure 2.3 : Representations of the molecular structure of phosphangulene (1) in crystals grown from ethyl acetate, as viewed along the C3 axis and perpendicular to the axis. Atoms of carbon appear in gray, hydrogen in white, oxygen in red, and phosphorus in orange. ... 101 Figure 2.4 : Representations of the structure of crystals of phosphangulene grown from ethyl acetate. (a) View perpendicular to the c-axis, showing part of two adjacent π-stacks with aligned dipoles. Principal inter-stack C-H···O interactions are marked by broken lines, with distances given in Å. (b) View along the c-axis, showing how a central stack (in red) is surrounded by six others. Unless otherwise indicated, atoms are shown in standard colors. ... 102 Figure 2.5 : (a) Hirshfeld surface of the convex face of a molecule of phosphangulene in crystals grown from ethyl acetate. The surface is colored according to the local value of de (distance from the surface to the nearest atomic nucleus in another molecule), and the colors range from cool (blue) to hot (red) as de decreases. (b) Corresponding surface of the concave face. ... 103 Figure 2.6 : Two-dimensional fingerprint plot of the Hirshfeld surface for molecules of phosphangulene in crystals grown from ethyl acetate. The plot shows the
frequency of finding points on the surface with particular values of de and di (distances to the nearest external and internal atomic nuclei). The colors at each point range from cool (blue) to hot (red) as the frequency increases. ... 104 Figure 2.7 : Representation of the structure of crystals of phosphangulene oxide (2a) grown from ethyl acetate (polymorph A). Two molecules that interact to form an offset clamshell pair are highlighted in red, and a second pair is shown with atoms in normal colors. Selected C-H∙∙∙O interactions and C∙∙∙O contacts are marked by broken lines, with distances given in Å. ... 110 Figure 2.8 : (a) Hirshfeld surface colored by de, showing an offset clamshell pair formed by two molecules of oxide 2a in polymorph A. (b) Corresponding surface of one of the convex faces of the pair. ... 111 Figure 2.9 : Fingerprint plots of Hirshfeld surfaces for the two symmetry-inequivalent molecules of oxide 2a in polymorph A. ... 111 Figure 2.10 : (a) Representative fingerprint plot of the Hirshfeld surface of one of the four symmetry-inequivalent molecules of triphenylphosphine in the triclinic P𝟏̅
polymorph. (b) Fingerprint plot of the Hirshfeld surface of a molecule of triphenylphosphine oxide in the orthorhombic Pbca form. ... 113 Figure 2.11 : (a) Representation of the structure of needle-shaped crystals of oxide 2a grown from anhydrous ethanol (polymorph B). Two adjacent inequivalent clamshell pairs are shown with atoms in normal colors. The shortest C-H∙∙∙O interaction between pairs is marked by a broken line, with the distance given in Å. (b) Superposition of representative clamshell pairs in the structures of polymorphs A
Figure 2.12 : (a) Hirshfeld surface colored by de, showing a representative offset clamshell pair of molecules of oxide 2a in polymorph B. (b) Corresponding surface of adjacent molecules of oxide 2a in a slipped stack in polymorph C. ... 116 Figure 2.13 : (a) Representative fingerprint plot of the Hirshfeld surface corresponding to one of the four symmetry-inequivalent molecules of oxide 2a in polymorph B. (b) Fingerprint plot for molecules of oxide 2a in polymorph C. ... 117 Figure 2.14 : Space-filling representation of part of a slipped stack observed in the structure of polymorph C of oxide 2a. Atoms are shown in normal colors. ... 118 Figure 2.15 : (a) Hirshfeld surface colored by de, showing a representative offset clamshell pair formed by two molecules of oxide 2a in polymorph D. (b) Corresponding surface of an offset clamshell pair in polymorph E of oxide 2a. ... 120 Figure 2.16 : (a) Representative fingerprint plot of the Hirshfeld surface for one of the four symmetry-inequivalent molecules of oxide 2a in polymorph D. (b) Fingerprint plot for molecules of oxide 2a in polymorph E. ... 120 Figure 2.17 : Percentage contributions made by various intermolecular interactions to the Hirshfeld surfaces of representative molecules in the structures of phosphangulene and oxide 2a (polymorphs A–E). Phosphangulene is shown as Phang, and polymorphs A–E appear in order of the importance of C-H interactions. ... 123 Figure 2.18 : Representation of the structure of crystals of sulfide 2b (polymorph A). Two adjacent offset clamshell pairs of molecules are illustrated with atoms of carbon in gray, hydrogen in white, oxygen in red, phosphorus in orange, and sulfur in
yellow. C-H∙∙∙S interactions are marked by broken lines, with the distances given in Å. ... 129 Figure 2.19 : (a) Hirshfeld surface colored by de, showing a representative offset clamshell pair formed by two molecules of sulfide 2b in polymorph A. (b) Corresponding surface of an offset clamshell pair in polymorph B of sulfide 2b. ... 129 Figure 2.20 : (a) Representative fingerprint plot of the Hirshfeld surface for one of the two symmetry-inequivalent molecules of sulfide 2b in polymorph A. (b) Fingerprint plot for molecules of sulfide 2b in polymorph B. ... 130 Figure 2.21 : Representations of the structures of crystals of selenide 2c grown from CHCl3/hexane (polymorph A) and from CS2 (polymorph B). (a) Offset clamshell pair observed in polymorph A. (b) Three adjacent offset clamshell pairs in polymorph B. Both images show atoms of carbon in gray, hydrogen in white, oxygen in red, phosphorus in orange, and selenium in yellow. Selected C-H∙∙∙Se and Se∙∙∙Se interactions are marked by broken lines, with the distances given in Å. ... 132 Figure 2.22 : (a) Hirshfeld surface colored by de, showing an offset clamshell pair formed by molecules of selenide 2c in polymorph A. (b) Corresponding surface of a representative offset clamshell pair in polymorph B of selenide 2c. ... 133 Figure 2.23 : (a) Representative fingerprint plot of the Hirshfeld surface for one of the two symmetry-inequivalent molecules of selenide 2c in polymorph A. (b) Fingerprint plot for molecules of selenide 2c in polymorph B. ... 133 Figure 2.24 : Representation of the structure of crystals of selenide 2c (polymorph C). View
(in red) is surrounded by eight other loose stacks. Unless otherwise indicated, atoms are shown in normal colors. ... 135 Figure 2.25 : (a) Hirshfeld surface colored by de, showing the convex face of a molecule of selenide 2c in polymorph C. (b) Corresponding concave face. ... 135 Figure 2.26 : Fingerprint plot for molecules of selenide 2c in polymorph C. ... 136 Figure 2.27 : Superimposition of six representative offset clamshell pairs present in the structures of oxide 2a (polymorphs A and B in red and dark red), sulfide 2b (polymorphs A and B in blue and dark blue), and selenide 2c (polymorphs A and B in green and dark green). ... 137 Figure 2.28 : Graph showing that the unit cell volume V (in Å3) measured for single crystals of polymorph C of oxide 2a decreases linearly as the molar fraction (1-χ) of incorporated phosphangulene increases. ... 139 Figure 3.1 : Two views of the structure of phosphangulene (1), one along the C3 axis and the other perpendicular. Atoms of carbon appear in gray, hydrogen in white, oxygen in red, and phosphorus in orange. ... 163 Figure 3.2 : Representations of the structure of crystals of phosphangulene grown from ethyl acetate. (a) View perpendicular to the c-axis, illustrating part of two adjacent π-stacks with aligned dipoles. Significant inter-stack C-H···O interactions are marked by broken lines, and H···O distances are given in Å. (b) View along the c-axis, showing a central stack (in red) surrounded by six others. Unless indicated otherwise, atoms are shown in standard colors. ... 164 Figure 3.3 : Representation of the asymmetric unit in the structure of 1:1 cocrystals of phosphangulene oxide (2a) and C60 grown from PhCl. Atoms of carbon appear in
gray, hydrogen in white, oxygen in red, chlorine in green, and phosphorus in orange. The centroids of C60 and the aromatic rings of oxide 2a are marked by red circles, and key interactions are identified by broken lines, with distances given in Å. Molecules of C60 are disordered in the structure, and only a single representative orientation is shown. ... 170 Figure 3.4 : Representation of the structure of 1:1 cocrystals of phosphangulene oxide and C60 grown from PhCl. View along the ac-diagonal showing how fullerene-rich regions (top and bottom) are separated by intervening layers of oxide 2a. The structure is maintained by multiple C-H···O-P and C-H···π interactions (identified by broken lines, with distances given in Å), as well as by the aromatic interactions shown in Figure 3.3. Atoms are shown in their standard colors. Molecules of C60 are disordered and are shown using a simplified representation. Their centroids are marked by red circles. ... 171 Figure 3.5 : Bilayers of C60 in the structure of 1:1 cocrystals of phosphangulene oxide and C60 grown from PhCl. Each molecule of C60 is surrounded by one molecule of oxide 2a and by eight other molecules of C60 with centroid-centroid distances less than 10.45 Å. Atoms are shown in their standard colors. Molecules of C60 are disordered and are shown using a simplified representation. Their centroids are marked by red circles, and illustrative centroid-centroid distances are shown in Å. Guest molecules of PhCl are omitted for clarity. ... 172 Figure 3.6 : Representation of the asymmetric unit in the structure of 3:1 cocrystals of phosphangulene oxide and C60 grown from o-xylene. Atoms are shown in their
by red circles, and key interactions are identified by broken lines, with distances given in Å. Guest molecules of o-xylene are omitted for clarity. ... 175 Figure 3.7 : Representation of the structure of 3:1 cocrystals of phosphangulene oxide and C60 grown from o-xylene. The view shows paired molecules of C60 in a cavity bounded by molecules of oxide 2a and o-xylene. Atoms are shown in their standard colors. Their centroids are marked by red circles, and the centroid-centroid distance is given in Å. ... 175 Figure 3.8 : Representation of the structure of 2:1 cocrystals of phosphangulene oxide and C60 grown from PhMe. Atoms are shown in their standard colors. The centroids of C60 and the aromatic rings of oxide 2a are marked by red circles, and centroid-centroid distances are given in Å. Guest molecules of PhMe are omitted for clarity. ... 177 Figure 3.9 : View along the a-axis showing the structure of 2:1 cocrystals of phosphangulene oxide and C60 grown from PhMe. Fullerenes are aligned in contact along the a-axis to form a hexagonal array of columns surrounded by molecules of oxide 2a and PhMe. Atoms are shown in their standard colors. Molecules of PhMe are disordered and are shown using simplified representations. ... 178 Figure 3.10 : View of the structure of 6:4 cocrystals of phosphangulene oxide and C60 grown from PhMe/MeOH. The view shows only one symmetry-inequivalent molecule of C60 capped by two molecules of oxide 2a. Atoms are shown in their standard colors. The centroids of C60 and the aromatic rings of oxide 2a are marked by red circles, and centroid-centroid distances are given in Å. C60 is disordered and is
shown using a simplified representation. Guest molecules of MeOH are omitted for clarity. ... 179 Figure 3.11 : Representation of the structure of 6:4 cocrystals of phosphangulene oxide and C60 grown from PhMe/MeOH. The view shows a fullerene-rich layer in the ab-plane and adjacent layers comprised of molecules of oxide 2a and MeOH. Atoms are shown in their standard colors. Molecules of C60 are disordered and are shown using a simplified representation. ... 180 Figure 3.12 : (a) View showing how C60 is singly capped by phosphangulene sulfide in the structure of 1:1 cocrystals grown from CS2. (b) Analogous view of the structure of 1:1 cocrystals grown from m-xylene. Atoms of carbon are shown in gray, hydrogen in white, oxygen in red, phosphorus in orange, and sulfur in yellow. Centroids of C60 and the aromatic rings of sulfide 2b are marked by red circles, and centroid-centroid distances are given in Å. ... 183 Figure 3.13 : Representation of the structure of 1:1 cocrystals of phosphangulene sulfide and C60 grown from CS2, showing the environment of a central molecule of C60 (space-filling image), with a capping molecule of sulfide 2b (blue), four contacting molecules of C60, and various other interacting molecules of sulfide 2b and CS2. Unless indicated otherwise, atoms are shown in their standard colors. ... 184 Figure 3.14 : (a) View along the b-axis showing the structure of 1:1 cocrystals of phosphangulene sulfide and C60 grown from CS2. Hexagonally-arranged columns of fullerenes separated by molecules of CS2 lie along the b-axis and define
the c-axis portraying the closely related structure of 1:1 cocrystals of sulfide 2b and C60 grown from m-xylene. Atoms are shown in their standard colors... 185 Figure 3.15 : Representation of the structure of 1:1 cocrystals of phosphangulene sulfide and C60 grown from m-xylene, showing the environment of a central molecule of C60 (space-filling image), with a capping molecule of sulfide 2b (blue), four close C60 neighbors, and various other interacting molecules of sulfide 2b and m-xylene. Unless indicated otherwise, atoms are shown in their standard colors. C60 is disordered and is shown using a simplified representation. ... 187 Figure 3.16 : Representative view of the structure of 1:1 cocrystals of phosphangulene sulfide and C70 grown from CS2. The view shows one of two symmetry-inequivalent molecules of C70 capped near the equator by a molecule of sulfide 2b. An interacting molecule of CS2 is also shown. Atoms are drawn in their standard colors. The centroids of C70 and the aromatic rings of sulfide 2b are indicated by red circles, and two pseudocentroids in blue correspond to C60 subunits of the fullerene. Interactions are represented by broken lines, and distances are given in Å. ... 189 Figure 3.17 : View along the b-axis showing the structure of 1:1 cocrystals of phosphangulene sulfide and C70 grown from CS2. Hexagonally-arrayed columns of fullerenes separated by molecules of CS2 lie along the b-axis and define channels that include capping molecules of sulfide 2b. Atoms are shown in their standard colors. ... 190 Figure 3.18 : Representative view of the structure of 1:1 cocrystals of phosphangulene selenide and C60 grown from PhCl, showing how one of the
symmetry-inequivalent molecules of C60 is capped by selenide 2c. Atoms of carbon are shown in gray, hydrogen in white, oxygen in red, phosphorus in orange, and selenium in yellow-orange. Centroids of C60 and the aromatic rings of selenide 2c are marked by red circles, and centroid-centroid distances are given in Å. C60 is disordered and is shown using a simplified representation. Guest molecules of PhCl are omitted for clarity. ... 194 Figure 3.19 : Representative view of the structure of 1:1 cocrystals of phosphangulene selenide (2c) and C60 grown from PhCl, showing the environment of a central molecule of C60 (space-filling image), a capping molecule of selenide 2c (blue), five neighboring molecules of C60, and various other interacting molecules of selenide 2c and PhCl. Unless indicated otherwise, atoms are shown in their standard colors. Molecules of C60 are disordered and are shown using a simplified representation. Guest molecules of PhCl are omitted for clarity. .... 194 Figure 3.20 : Ordered arrangements of connected fullerenes observed in cocrystals formed by phosphangulene oxide and C60. In each image, fullerenes are represented by red spheres and their connections by red sticks. ... 197 Figure 4.1 : Representations of the molecular structure of phosphangulene (1) in crystals grown from ethyl acetate,1 as viewed along the C3 axis and perpendicular to the axis. Atoms of carbon are shown in gray, hydrogen in white, oxygen in red, and phosphorus in yellow-orange. ... 214 Figure 4.2 : Representations of the structure of crystals of [Ag(Phang)4]+ BF4- grown from CH2Cl2. (a) Image showing the approximately tetrahedral coordination of Ag(I).
of Phang ligands. (c) View of neighboring cations joined by a distorted pair of Phang ligands. Atoms of carbon appear in gray, hydrogen in white, oxygen in red, phosphorus in yellow-orange, and silver in light gray. BF4- ions are omitted for clarity. ... 220 Figure 4.3 : Comparisons of molecular organization in crystals of phosphangulene and oxide 2. (a) Offset clamshell pair formed by molecules of oxide 2 in crystals of a representative polymorph. (b) Stacking of molecules of phosphangulene.1 (c) Hirshfeld surface showing a representative concave surface in paired molecules of oxide 2. (d) Hirshfeld surface of the concave face of stacked molecules of phosphangulene. (e) Two-dimensional fingerprint plot of the surface of oxide 2. (e) Fingerprint plot of the surface of phosphangulene. Colors of the Hirshfeld surfaces range from cool (blue) to hot (red) as de decreases. The colors at each point in the fingerprint plots vary from cool (blue) to hot (red) as the frequency of particular values of de and di increases. In Figures 3a–b, atoms are shown in normal colors. ... 224 Figure 4.4 : Hirshfeld surfaces and two-dimensional fingerprint plots corresponding to [Ag(PPh3)4]+ and [Ag(Phang)4]+ in crystals of their BF4- salts. (a) View of the Hirshfeld surface of [Ag(PPh3)4]+ along the direction of a representative P-Ag bond. (b) Corresponding view of the surface of [Ag(Phang)4]+. (c) Fingerprint plot of the surface of [Ag(PPh3)4]+. (d) Fingerprint plot of the surface of [Ag(Phang)4]+. The Hirshfeld surfaces and fingerprint plots are colored in the normal ways. ... 226
Figure 4.5 : Low-temperature (183 K) 31P NMR spectra of solutions prepared by mixing phosphangulene and AgBF4 in CH2Cl2/diethyl ether, with the ratios shown on the left. The bottom spectrum corresponds to pure phosphangulene. Chemical shifts are relative to external 85% aqueous H3PO4. ... 229 Figure 4.6 : Representations of the structure of crystals of Cu2Cl2(Phang)4 grown from EtOH. (a) Image showing a single complex. (b) View of a central complex (in red) linked to four coplanar neighbors by offset clamshell pairs of Phang ligands. (c) Image showing a cyclic quartet joined by pairing of Phang ligands. (d) Side view of part of a sheet (in red) and two adjacent layers. Unless indicated otherwise, atoms of carbon appear in gray, hydrogen in white, oxygen in red, phosphorus in yellow-orange, copper in orange, and chlorine in green. ... 235 Figure 4.7 : Representations of the structure of crystals of [Ag(O3SCF3)(H2O)(Phang)]2 grown from EtOH/toluene. (a) View of a single molecule of the complex. (b) Image showing how inter-complex Ag···O interactions complete the trigonal bipyramidal coordination of Ag(I). (c) View showing a chain of complexes linked by pairing of Phang ligands. Atoms of carbon appear in gray, hydrogen in white, oxygen in red, fluorine in yellow-green, phosphorus in yellow-orange, sulfur in yellow, and silver in light gray. Selected intermolecular interactions are represented by broken lines. ... 239 Figure 4.8 : Representation of a molecule of [Ag(ClO4)(MeCN)2(Phang)]2 in the structure of crystals grown from MeCN/toluene. Atoms of carbon appear in gray, hydrogen in white, nitrogen in blue, oxygen in red, phosphorus in yellow-orange, chlorine
Figure 4.9 : Representations of the structure of crystals of [Ag(O3SCF3)(toluene)(Phang)2]2 • 2 C60 • 3 toluene grown from EtOH/toluene. (a) View showing an individual complex and two adjacent molecules of C60 capped by Phang ligands. (b) Image showing how complexes (in red) and molecules of C60 are linked to form alternating zig-zag chains. (c) View showing a central molecule of C60 and its immediate environment, including two neighboring fullerenes aligned with the a-axis, two capping complexes (in red), and a third molecule of the complex that forms C-H···π interactions with the central fullerene. Unless stated otherwise, atoms of carbon appear in gray, hydrogen in white, oxygen in red, fluorine in yellow-green, phosphorus in yellow-orange, sulfur in yellow, and silver in light gray. Guest molecules of toluene are omitted for clarity. ... 244 Figure 5.1 : Comparison of molecular organization in crystals of phosphangulene (1) and oxide 2. (a) Stacking of molecules of phosphangulene in crystals grown from ethyl acetate.1 (b) Offset clamshell pair formed by molecules of oxide 2 in crystals of a representative polymorphic form. Atoms of carbon appear in gray, hydrogen in white, oxygen in red, and phosphorus in yellow-orange. ... 270 Figure 5.2 : Representations of the structure of crystals of [(Phang)2N]+ BF4- grown from CS2. (a) View showing an individual cation. (b) Image showing undulating chains of cations linked by offset clamshell pairing of Phang groups. Atoms of carbon appear in gray, hydrogen in white, nitrogen in blue, oxygen in red, and phosphorus in yellow-orange. BF4- counterions are omitted for clarity. ... 273 Figure 5.3 : Comparison of molecular organization in crystals of phosphangulene oxide (2) and [(Phang)2N]+ BF4-. (a) Hirshfeld surface corresponding to a representative
concave face in paired molecules of oxide 2. (b) Corresponding Hirshfeld surface of the concave face of a [(Phang)2N]+ ion. Colors of the Hirshfeld surfaces range from hot (red) to cool (blue) as de increases. ... 276 Figure 5.4 : Representations of the structure of crystals of [(Phang)2N]4+ [Ag4Br8]-4 grown from PhCl. (a) Side view of part of a single sheet, showing a central [(Phang)2N]+ ion (blue) surrounded by eight neighbors. (b) Top view showing part of an anionic sheet consisting of [Ag4Br8]-4 ions and partly disordered molecules of PhCl. (c) Detailed view of the S2-symmetric structure of [Ag4Br8]-4, showing bond distances in Å. (d) Bond angles (°) in [Ag4Br8]-4 ions. Unless indicated otherwise, atoms of carbon appear in dark gray, hydrogen in white, nitrogen in blue, oxygen in red, phosphorus in yellow-orange, chlorine in green, bromine in brown, and silver in light gray. Molecules of H2O are omitted to simplify the images. ... 279 Figure 5.5 : Representations of the structure of crystals of of [(Phang)2N]+ [Ag7F24O24S8]- • 1
C60 • 3 Me • 2 H2O grown from mesitylene. (a) Top view of part of an anionic sheet, showing molecules of C60 embedded in a continuous network derived from Ag(I) trifluoromethanesulfonate. (b) Side view showing alternating ionic layers, with molecules of C60 doubly capped by [(Phang)2N]+ ions. (c) Space-filling view along the b-axis with [(Phang)2N]+ ions in blue, showing solvent-accessible volume in the cationic layers. Unless indicated otherwise, atoms of carbon appear in dark gray, hydrogen in white, nitrogen in blue, oxygen in red, fluorine in pale green, phosphorus in yellow-orange, sulfur in yellow, and silver in light gray. 283
Figure 7.1 : Thermal atomic displacement ellipsoid plot of the structure of crystals of polymorph A of phosphangulene oxide (2a) grown from EtOH and measured at 150 K. The ellipsoids of non-hydrogen atoms are drawn at the 50% probability level, and hydrogen atoms are represented by a sphere of arbitrary size. (a) View of the asymmetric unit. (b), (c) Individual views of the two molecules in the asymmetric unit. ... 312 Figure 7.2 : Thermal atomic displacement ellipsoid plot of the structure of crystals of polymorph B of phosphangulene oxide (2a) grown from EtOH and measured at 150 K. The ellipsoids of non-hydrogen atoms are drawn at the 50% probability level, and hydrogen atoms are represented by a sphere of arbitrary size. View of the asymmetric unit with labeled heteroatoms. ... 313 Figure 7.3 : Thermal atomic displacement ellipsoid plot of the structure of crystals of polymorph B of phosphangulene oxide (2a) grown from EtOH and measured at 150 K. The ellipsoids of non-hydrogen atoms are drawn at the 50% probability level, and hydrogen atoms are represented by a sphere of arbitrary size. (a), (b), (c), (d) Individual views of the four molecules in the asymmetric unit with all atoms labeled. ... 314 Figure 7.4 : Thermal atomic displacement ellipsoid plot of the structure of crystals of polymorph C of phosphangulene oxide (2a) grown from EtOH and measured at 150 K. The ellipsoids of non-hydrogen atoms are drawn at the 50% probability level, and hydrogen atoms are represented by a sphere of arbitrary size. ... 315 Figure 7.5 : Thermal atomic displacement ellipsoid plot of the structure of crystals of polymorph D of phosphangulene oxide (2a) grown from EtOH and measured at
150 K. The ellipsoids of non-hydrogen atoms are drawn at the 50% probability level, and hydrogen atoms are represented by a sphere of arbitrary size. View of the asymmetric unit with labeled heteroatoms. ... 316 Figure 7.6 : Thermal atomic displacement ellipsoid plot of the structure of crystals of polymorph D of phosphangulene oxide (2a) grown from EtOH and measured at 150 K. The ellipsoids of non-hydrogen atoms are drawn at the 50% probability level, and hydrogen atoms are represented by a sphere of arbitrary size. (a), (b), (c), (d) Individual views of the four molecules in the asymmetric unit with all atoms labeled. ... 317 Figure 7.7 : Thermal atomic displacement ellipsoid plot of the structure of crystals of polymorph E of phosphangulene oxide (2a) grown from EtOH and measured at 150 K. The ellipsoids of non-hydrogen atoms are drawn at the 50% probability level, and hydrogen atoms are represented by a sphere of arbitrary size. (a) View of the asymmetric unit. (b), (c) Individual views of the two molecules in the asymmetric unit. ... 318 Figure 7.8 : Packing similarity matrix (top) and associated tree diagram (bottom) for the five polymorphs of phosphangulene oxide (2a). Part of the tree diagram between 5 and 25 (indicated by the dotted green line) was removed to make the figure shorter and the diagram more readable. ... 320 Figure 7.9 : Molecular overlay calculated by CrystalCMP showing clusters of ten molecules from the structures of polymorphs B and D of phosphangulene oxide (2a). .... 321
Figure 7.10 : Fingerprint plots of Hirshfeld surfaces for the four symmetry-inequivalent molecules of phosphangulene oxide (2a) in polymorphs D (left) and B (right). ... 322 Figure 7.11 : Views of the superposition of the structures of polymorphs B (red) and D (blue) (2 2 2 arrays of unit cells) of phosphangulene oxide (2a). The structures are viewed along two perpendicular directions to show to what extent the molecules overlap. ... 323 Figure 7.12 : Simulated XRD powder patterns for polymorphs B and D of phosphangulene oxide (2a). ... 324 Figure 7.13 : Simulated XRD patterns for the five polymorphs of phosphangulene oxide (2a).
... 325 Figure 7.14 : Thermal atomic displacement ellipsoid plot of the structure of crystals of polymorph B of phosphangulene sulfide (2b) grown from EtOH and measured at 150 K. The ellipsoids of non-hydrogen atoms are drawn at the 50% probability level, and hydrogen atoms are represented by a sphere of arbitrary size. ... 326 Figure 7.15 : Simulated XRD patterns for the two polymorphs of phosphangulene sulfide (2b). ... 327 Figure 7.16 : Thermal atomic displacement ellipsoid plot of the structure of crystals of polymorph B of phosphangulene selenide (2c) grown from CS2 and measured at 150 K. The ellipsoids of non-hydrogen atoms are drawn at the 50% probability level, and hydrogen atoms are represented by a sphere of arbitrary size. (a) View of the asymmetric unit with heteroatoms labeled. (b), (c) Individual views of the two molecules in the asymmetric unit with all atoms labeled. ... 328
Figure 7.17 : Thermal atomic displacement ellipsoid plot of the structure of crystals of polymorph C of phosphangulene selenide (2c) grown from CS2 and measured at 150 K. The ellipsoids of non-hydrogen atoms are drawn at the 50% probability level, and hydrogen atoms are represented by a sphere of arbitrary size. ... 329 Figure 7.18 : Simulated XRD patterns for the three polymorphs of phosphangulene selenide (2c). ... 330 Figure 7.19 : Thermal atomic displacement ellipsoid plot of the structure of mixed crystals of phosphangulene (1) and phosphangulene oxide (2a) grown from EtOAc and measured at 150 K. The ellipsoids of non-hydrogen atoms are drawn at the 50% probability level, and hydrogen atoms are represented by a sphere of arbitrary size. (a) C18H9O3.85P. (b) C18H9O3.70P. (c) C18H9O3.5P. ... 332 Figure 7.20 : Thermal atomic displacement ellipsoid plot of the structure of mixed crystals of phosphangulene oxide (2a) and phosphangulene sulfide (2b) grown from CH2Cl2/hexane and measured at 150 K. The ellipsoids of non-hydrogen atoms are drawn at the 50% probability level, and hydrogen atoms are represented by a sphere of arbitrary size. (a) C18H9O3.71PS0.29. (b) C18H9O3.72PS0.28. (c) C18H9O3.65PS0.35. (d) C18H9O3.63PS0.37. ... 334 Figure 7.21 : Thermal atomic displacement ellipsoid plot of the structure of 1:1 cocrystals of phosphangulene oxide (2a) and C60 grown from PhCl. The ellipsoids of non-hydrogen atoms are drawn at the 50% probability level, and non-hydrogen atoms are represented by a sphere of arbitrary size. ... 338 Figure 7.22 : Thermal atomic displacement ellipsoid plot of the structure of 3:1 cocrystals of
hydrogen atoms are drawn at the 50% probability level, and hydrogen atoms are represented by a sphere of arbitrary size. ... 339 Figure 7.23 : Thermal atomic displacement ellipsoid plot of the structure of 2:1 cocrystals of phosphangulene oxide (2a) and C60 grown from PhMe. The ellipsoids of non-hydrogen atoms are drawn at the 50% probability level, and non-hydrogen atoms are represented by a sphere of arbitrary size. ... 340 Figure 7.24 : Thermal atomic displacement ellipsoid plot of the structure of 6:4 cocrystals of phosphangulene oxide (2a) and C60 grown from MeOH. The ellipsoids of non-hydrogen atoms are drawn at the 50% probability level, and non-hydrogen atoms are represented by a sphere of arbitrary size. ... 341 Figure 7.25 : Thermal atomic displacement ellipsoid plot of the structure of 1:1 cocrystals of phosphangulene sulfide (2b) and C60 grown from CS2. The ellipsoids of non-hydrogen atoms are drawn at the 50% probability level, and non-hydrogen atoms are represented by a sphere of arbitrary size. ... 342 Figure 7.26 : Thermal atomic displacement ellipsoid plot of the structure of 1:1 cocrystals of phosphangulene sulfide (2b) and C60 grown from m-xylene. The ellipsoids of non-hydrogen atoms are drawn at the 50% probability level, and hydrogen atoms are represented by a sphere of arbitrary size. ... 343 Figure 7.27 : Thermal atomic displacement ellipsoid plot of the structure of 1:1 cocrystals of phosphangulene sulfide (2b) and C70 grown from CS2. The ellipsoids of non-hydrogen atoms are drawn at the 50% probability level, and non-hydrogen atoms are represented by a sphere of arbitrary size. ... 344
Figure 7.28 : Thermal atomic displacement ellipsoid plot of the structure of 1:1 cocrystals of phosphangulene selenide (2c) and C60 grown from CS2. The ellipsoids of non-hydrogen atoms are drawn at the 50% probability level, and non-hydrogen atoms are represented by a sphere of arbitrary size. ... 345 Figure 7.29 : Thermal atomic displacement ellipsoid plot of the structure of 1:1 cocrystals of phosphangulene selenide (2c) and C60 grown from PhCl. The ellipsoids of non-hydrogen atoms are drawn at the 50% probability level, and non-hydrogen atoms are represented by a sphere of arbitrary size. ... 346 Figure 7.30 : Simulated and observed powder X-ray diffraction patterns for bulk crystalline [Ag(Phang)4]+ BF4-. ... 349 Figure 7.31 : Low-temperature (183 K) 31P NMR spectra of solutions prepared in CH2Cl2/diethyl ether by mixing AgBF4and PPh3 in four different ratios (1:1, 1:2, 1:3, and 1:4), along with a spectrum of the free ligand in the absence of AgBF4 (1:0). ... 352 Figure 7.32 : (a) Solid-state 31P NMR spectrum of crystalline [Ag(Phang)4]+ BF4-, showing signals A–D corresponding to four symmetry-inequivalent Phang ligands. A small amount of free phosphangulene (δ 31P = -135) arises from decomposition of the complex. (b) Partial structure of [Ag(Phang)4]+ BF4-, showing the central atom of silver (light gray) and four bonded atoms of phosphorus (yellow-orange), with bond lengths given in Å and assignments based jointly on (1) the typical correlation of shielding and bond length and (2) the smaller value of 1J (107/109Ag, 31P) expected for the most shielded signal. ... 354
Figure 7.33 : Experimental 31P MAS NMR spectrum of crystalline [Ag(Phang)4]+ BF4-, along with a simulation used to extract isotropic shifts and values of 1J (107/109Ag, 31P). ... 356 Figure 7.34 : Representations of the structure of crystals of Cu2I2(Phang)4 grown from EtOH/toluene. (a) Image showing a central complex (in red) linked to four coplanar neighbors by offset clamshell pairing of Phang ligands. (b) View of a cyclic quartet surrounding a disordered molecule of toluene (in red). Unless indicated otherwise, atoms of carbon appear in gray, hydrogen in white, oxygen in red, phosphorus in yellow-orange, copper in orange, and iodine in purple. . 360 Figure 7.35 : Representations of the structure of crystals of Cu2Cl2(Phang)3 grown from EtOH. (a) Image showing a single molecule of the complex. (b) View showing how molecules of Cu2Cl2(Phang)3 form sheets held together by extensive interdigitation of Phang ligands. Atoms of carbon appear in gray, hydrogen in white, oxygen in red, phosphorus in yellow-orange, copper in orange, and chlorine in green. ... 362 Figure 7.36 : (a) Representation of one of the two inequivalent molecules of [Ag(O3SCF3)(toluene)(Phang)]2 in the structure of crystals grown from EtOH/toluene. (b) Representation of a molecule of [Ag(ClO4)(toluene)(Phang)]2 in the structure of crystals grown from MeCN/toluene. Atoms of carbon appear in gray, hydrogen in white, oxygen in red, fluorine in yellow-green, phosphorus in yellow-orange, sulfur in yellow, chlorine in green, and silver in light gray. 364 Figure 7.37 : Thermal atomic displacement ellipsoid plot of the structure of crystals of [Ag(Phang)4]+ BF4- grown from CH2Cl2. The ellipsoids of non-hydrogen atoms
are drawn at the 50% probability level, and hydrogen atoms are represented by a sphere of arbitrary size. ... 366 Figure 7.38 : Thermal atomic displacement ellipsoid plot of the structure of crystals of [Cu(Phang)4]+ BF4- grown from EtOH. The ellipsoids of non-hydrogen atoms are drawn at the 50% probability level, and hydrogen atoms are represented by a sphere of arbitrary size. ... 367 Figure 7.39 : Thermal atomic displacement ellipsoid plot of the structure of crystals of [Cu(Phang)4]+ PF6- 3 MeOH grown from MeOH. The ellipsoids of non-hydrogen atoms are drawn at the 50% probability level, and non-hydrogen atoms are represented by a sphere of arbitrary size. ... 368 Figure 7.40 : Thermal atomic displacement ellipsoid plot of the structure of crystals of Cu2Cl2(Phang)4 grown from EtOH. The ellipsoids of non-hydrogen atoms are drawn at the 50% probability level, and hydrogen atoms are represented by a sphere of arbitrary size. Symmetry code (i): 1-x, 1-y, 1-z ... 369 Figure 7.41 : Thermal atomic displacement ellipsoid plot of the structure of crystals of Cu2I2(Phang)4 1 toluene grown from EtOH/toluene. The ellipsoids of non-hydrogen atoms are drawn at the 50% probability level, and non-hydrogen atoms are represented by a sphere of arbitrary size. Symmetry code (i): 1-x, 2-y, 1-z; (ii): x, y, 1-z. ... 370 Figure 7.42 : Thermal atomic displacement ellipsoid plot of the structure of crystals of Cu2Cl2(Phang)3 grown from EtOH. The ellipsoids of non-hydrogen atoms are drawn at the 50% probability level, and hydrogen atoms are represented by a
Figure 7.43 : Thermal atomic displacement ellipsoid plot of the structure of crystals of [Ag(O3SCF3)(H2O)(Phang)]2 grown from EtOH/toluene. The ellipsoids of non-hydrogen atoms are drawn at the 50% probability level, and non-hydrogen atoms are represented by a sphere of arbitrary size. Symmetry code (i): 1-x, 1-y, 1-z. .... 372 Figure 7.44 : Thermal atomic displacement ellipsoid plot of the structure of crystals of [Ag(O3SCF3)(toluene)(Phang)]2 grown from EtOH/toluene. The ellipsoids of non-hydrogen atoms are drawn at the 50% probability level, and hydrogen atoms are represented by a sphere of arbitrary size. Symmetry code (i): 1-x, 1-y, 1-z; (ii): 1-x, 1-y, 2-z. ... 373 Figure 7.45 : Thermal atomic displacement ellipsoid plot of the structure of crystals of [Ag(ClO4)(toluene)(Phang)]2 grown from MeCN/toluene. The ellipsoids of non-hydrogen atoms are drawn at the 50% probability level, and non-hydrogen atoms are represented by a sphere of arbitrary size. Symmetry code (i): 1-x, 1-y, 1-z. .... 374 Figure 7.46 : Thermal atomic displacement ellipsoid plot of the structure of crystals of [Ag(ClO4)(MeCN)2(Phang)]2 grown from MeCN/toluene. The ellipsoids of non-hydrogen atoms are drawn at the 50% probability level, and non-hydrogen atoms are represented by a sphere of arbitrary size. Symmetry code (i): 1-x, 1-y, 1-z. .... 375 Figure 7.47 : Thermal atomic displacement ellipsoid plot of the structure of crystals of [Ag(O3SCF3)(toluene)(Phang)2]2 • 2 C60 • 3 toluene grown from EtOH/toluene. The ellipsoids of non-hydrogen atoms are drawn at the 50% probability level, and hydrogen atoms are represented by a sphere of arbitrary size. Symmetry code (i): 1-x, 1-y, 1-z. ... 376
Figure 7.48 : Thermal atomic displacement ellipsoid plot of the structure of crystals of [(Phang)2N]+ BF4- grown from CS2. The ellipsoids of non-hydrogen atoms are drawn at the 50% probability level, and hydrogen atoms are represented by a sphere of arbitrary size. ... 381 Figure 7.49 : Thermal atomic displacement ellipsoid plot of the structure of crystals of [(Phang)2N]+ CF3SO3- grown from CS2/CH2Cl2. The ellipsoids of non-hydrogen atoms are drawn at the 50% probability level, and hydrogen atoms are represented by a sphere of arbitrary size. ... 382 Figure 7.50 : Thermal atomic displacement ellipsoid plot of the structure of crystals of [(Phang)2N]+ I- grown from CH2Cl2/acetone. The ellipsoids of non-hydrogen atoms are drawn at the 50% probability level, and hydrogen atoms are represented by a sphere of arbitrary size. ... 383 Figure 7.51 : Thermal atomic displacement ellipsoid plot of the structure of crystals of [(Phang)2N]4+ [Ag4Br8]-4 grown from PhCl. The ellipsoids of non-hydrogen atoms are drawn at the 50% probability level, and hydrogen atoms are represented by a sphere of arbitrary size. Symmetry code (i): -x, 1-y, 1-z. ... 384 Figure 7.52 : Thermal atomic displacement ellipsoid plot of the structure of crystals of [(Phang)2N]+ [Ag7F24O24S8]- • 1 C60 grown from mesitylene. The ellipsoids of non-hydrogen atoms are drawn at the 50% probability level, and hydrogen atoms are represented by a sphere of arbitrary size. Symmetry code (i): -x, 1-y, -z; (ii): x, ½-y, z. ... 385
Index des abréviations Å : Ångström °C : degré Celsius µ : coefficient d’absorption µm : micromètre µmol : micromole calcd : calculated cm : centimètre d : doublet (en RMN)
de : distance séparant la surface d’Hirshfeld et le noyau atomique le plus près situé à l’extérieur de cette surface
di : distance séparant la surface d’Hirshfeld et le noyau atomique le plus près situé à l’intérieur de cette surface
DMF : N,N-diméthylformamide DMSO : diméthyl sulfoxyde
dnorm : contribution normalisée des de et di en rapport aux rayons de van der Waals des atomes impliqués
equiv. : équivalent
ESI : electrospray ionisation Et : éthyle
FTIR : Fourier transform infrared
GoF : goodness-of-fit
h : heure
HOMO : highest occupied molecular orbital HRMS : high-resolution mass spectrometry Hz : hertz
hν : sous irradiation IR : infrarouge
J : constante de couplage
K : Kelvin
LUMO : lowest unoccupied molecular orbital M : molaire
m : masse ou multiplet (en RMN) m/z : ratio masse / charge
Me : méthyle Mes : mesitylène mg : milligramme MHz : mégahertz min : minute mL : millilitre
mM : millimolaire mmol : millimole mol : mole mp : melting point MS : mass spectrometry nm : nanomètre
NMR : nuclear magnetic resonance
ORTEP : Oak Ridge Thermal Ellipsoid Program
PC61BM : méthyl ester de l’acide [6,6]-phényl-C61-butyrique Ph : phényle
Phang : phosphangulène PhCl : chlorobenzène PhMe : toluène
ppm : partie par millions q : quadruplet (en RMN) quint : quintuplet (en RMN)
R1 : facteur d’accord sur les réflexions observées RMN : résonance magnétique nucléaire
rt : room temperature s : singulet (en RMN)
T : température t : triplet (en RMN) THF : tétrahydrofuranne UV : ultraviolet
V : volume
rvdW : rayon de van der Waals wR2 : facteur d’accord pondéré Z
: nombre de molécules dans la maille élémentaire Z'
: nombre de molécules dans l'unité asymétrique α : angle de déviation à la tangente
Δ : reflux
δ : déplacement chimique λ : longueur d’onde ρ : densité électronique
ρcalc : calculated density (masse volumique) χ : fraction molaire




![Figure 1.22 : Complexe de C 60 dans un pillar[10]arène. Image tirée de la référence 105](https://thumb-eu.123doks.com/thumbv2/123doknet/7450808.221315/86.918.161.737.686.843/figure-complexe-pillar-arène-image-tirée-référence.webp)
