R/V Coriolis II expedition RQM-MEOPAR – COR2001:
Monitoring natural hazards during coastal to offshore
sediment remobilization and its impacts on primary
production dynamics in the Lower St. Lawrence Estuary
July 5-15, 2020
J.-C. Montero-Serrano, A. Limoges, A. Normandeau, A. Corminboeuf, T.
Laphengphratheng
2
R/V Coriolis II expedition RQM-MEOPAR – COR2001:
Monitoring natural hazards during coastal to offshore
sediment remobilization and its impacts on primary
production dynamics in the Lower St. Lawrence Estuary
J.-C. Montero-Serrano
1, A. Limoges
2, A. Normandeau
3, A. Corminboeuf
1,
T. Laphengphratheng
41 Institut des sciences de la mer de Rimouski, Université du Québec à Rimouski, Rimouski, Québec, Canada. 2 University of New Brunswick, Fredericton, New Brunswick, Canada.
3 Geological Survey of Canada (Atlantic), 1 Challenger Drive, Dartmouth, Nova Scotia. 4 Université du Québec à Rimouski, Rimouski, Québec, Canada.
2020
Information contained in this publication or product may be reproduced, in part or in whole, and by any means, for personal or public non-commercial purposes, without charge or further permission, unless otherwise specified.
You are asked to:
• exercise due diligence in ensuring the accuracy of the materials reproduced;
• indicate the complete title of the materials reproduced, and the name of the author organization; and
• indicate that the reproduction is a copy of an official work that is published by the Institut des sciences de la mer de Rimouski (ISMER) de l’Université du Québec à Rimouski (UQAR) and that the reproduction has not been produced in affiliation with, or with the endorsement of, ISMER-UQAR.
Commercial reproduction and distribution is prohibited except with written permission from ISMER-UQAR.
CC BY-NC-ND
URL: http://semaphore.uqar.ca/id/eprint/1731/
This publication is available for free download through SÉMAPHORE (http://semaphore.uqar.ca/index.html), dépôt numérique de l’UQAR.
Recommended citation
Montero-Serrano J.-C., Limoges A., Normandeau A., Corminboeuf A., Laphengphratheng T. (2020). R/V Coriolis II expedition RQM-MEOPAR – COR2001: Monitoring natural hazards during coastal to offshore sediment remobilization and its impacts on primary production dynamics in the Lower St. Lawrence Estuary. COR2001 expedition report. Université du Québec à Rimouski (UQAR), Institut des sciences de la mer de Rimouski (ISMER), 54 p.
3
T
ABLE OFC
ONTENTSTABLE OF CONTENTS ... 3 LIST OF FIGURES ... 5 LIST OF TABLES ... 7 ACKNOWLEDGMENTS ... 8
1. BACKGROUND AND OBJECTIVES ... 9
2. PARTICIPANTS ... 10 3. SUMMARY OF ACTIVITIES ... 11 4. PRELIMINARY RESULTS ... 12 4.1 CRUISE STATISTICS ... 12 4.2 KEY PRELIMINARY RESULTS ... 13 4.2.1 Betsiamites ... 13 4.2.2 Franquelin ... 13 4.2.3 Pointe-des-Monts ... 14 5. DAILY NARRATIVE ... 15 5.1 JD187–JULY 5,2020–RIMOUSKI ... 15 5.2 JD188–JULY 6,2020–BETSIAMITES ... 15
5.3 JD189–JULY 7,2020–POINTES-AUX-OUTARDES ... 16
5.4 JD190–JULY 8,2020–MANICOUAGAN ... 16
5.5 JD191–JULY 9,2020–POINTE-DES-MONTS ... 17
5.6 JD192–JULY 10,2020–POINTE-DES-MONTS ... 17
5.7 JD193–JULY 11,2020–POINTE-DES-MONTS ... 17
5.8 JD194–JULY 12,2020–POINTE-DES-MONTS ... 18
5.9 JD195–JULY 13,2020–GODBOUT ... 18
5.10 JD196–JULY 14,2020–MANICOUAGAN ... 18
5.11 JD197–JULY 15,2020–RIMOUSKI ... 19
6. EQUIPMENT AND PROCEDURES ... 19
6.1 EDGETECH X-STAR 2.1 SUB-BOTTOM PROFILER ... 19
6.2 EM-2040 MULTIBEAM ECHOSOUNDER ... 20
6.3 CORING ... 21
6.3.1 Van Veen grab sampler (VV). ... 21
6.3.2 Box corer (BC). ... 21
6.3.3 Gravity core (GC). ... 21
6.3.4 Giant gravity corer (GGC). ... 22
4
6.4 PLANKTON NET SAMPLING ... 23
6.5 CTD-ROSETTE ... 23
7. CONCLUSIONS ... 24
APPENDIX A: STATION SUMMARY ... 25
APPENDIX B: GEOGRAPHIC LOCATIONS OF STATIONS ... 34
APPENDIX C: STRATIGRAPHIC POSITIONS OF SEDIMENT CORES ... 40
APPENDIX D: CTD PROFILES ... 46
5
L
IST OF FIGURESFigure 1: Participants of the COR2001 cruise. From left to right: Michel Miron, Gilles Desmeules, Victor Garvey, Anne Corminboeuf, Dominic Ndeh Munang, Gilles Pelletier, Jean-Carlos Montero-Serrano, Robert Bélanger, Tina
Laphengphratheng, and Audrey Limoges. ... 10
Figure 2: Summary of activities during COR2001. Blue shaded areas are multibeam surveys completed during COR2001 and dots are all the samples collected. ... 11
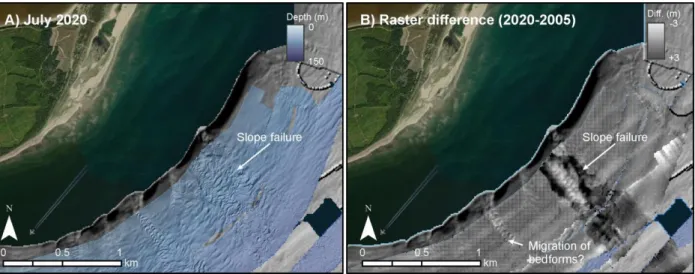
Figure 3: Recent (post 2005) slope failure on the Betsiamites delta, evidencing recent sediment remobilization offshore. A) 2020 multibeam bathymetry; B) Difference in bathymetry between 2005 and 2020. ... 13
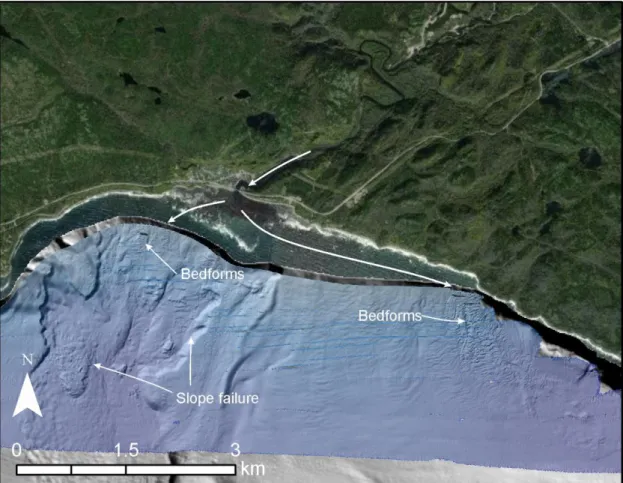
Figure 4: Evidence of slope failure and offshore sediment transport in the Franquelin area. Bedforms suggest sediment density flows occur at the mouth of the river and at the end of a small littoral cell to the east. ... 14
Figure 5: Evidence of a 'recent' turbidite in box core 08, in Pointe-des-Monts. ... 15
Figure 6: Labelling system for the sections of the gravity cores ... 23
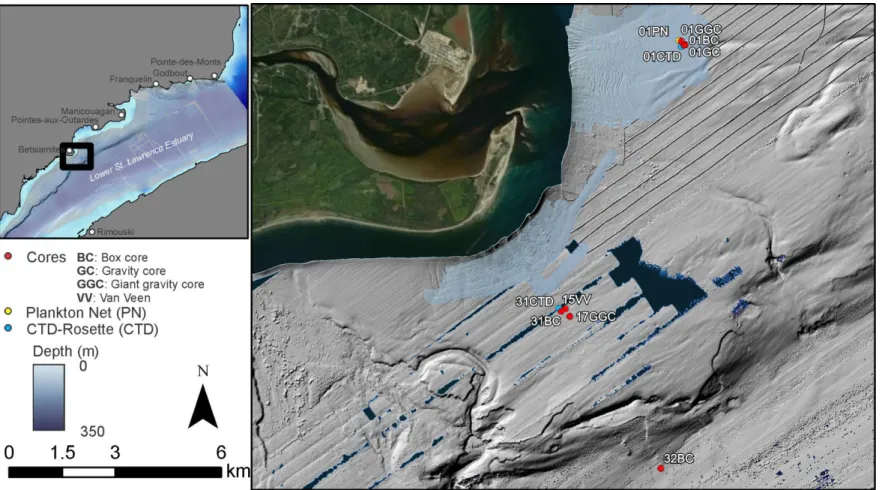
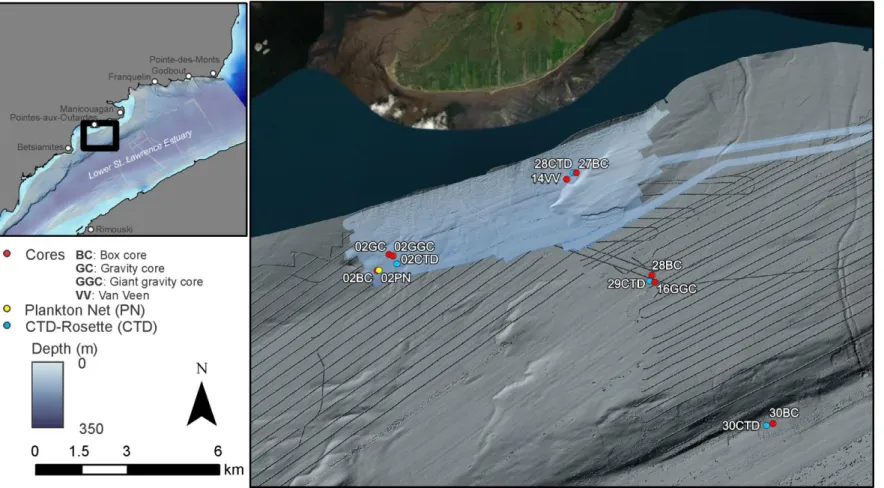
Figure B1: Location of coring, CTD-R and plankton nets in Betsimiates area ... 34
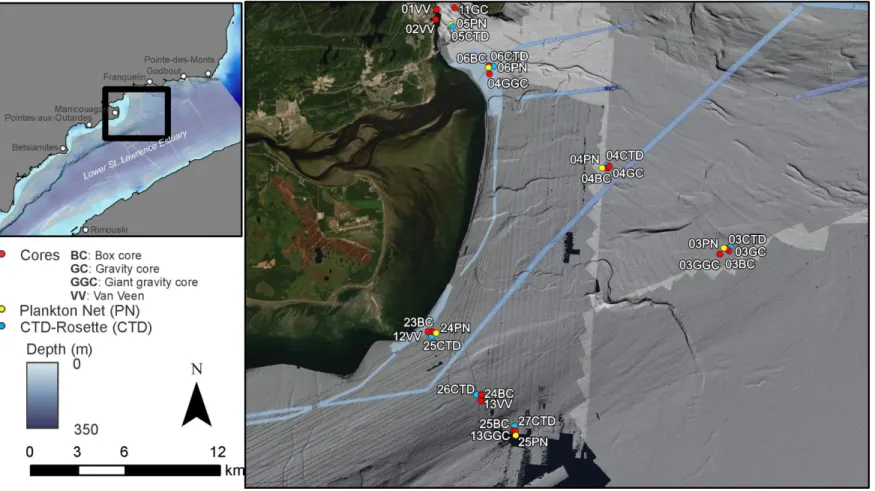
Figure B2: Location of coring, CTD-R and plankton nets in Pointes-aux-Outardes area ... 33
Figure B3: Location of coring, CTD-R and plankton nets in Manicouagan area ... 34
Figure B4: Location of coring, CTD-R and plankton nets in Franquelin area ... 35
Figure B5: Location of coring, CTD-R and plankton nets in Godbout area ... 36
Figure B6: Location of coring, CTD-R and plankton nets in Pointe-des-Monts area ... 37
Figure C1: Approximate stratigraphic positions of cores COR2001-01BC and 01GC ... 40
Figure C2: Approximate stratigraphic positions of cores COR2001-02BC and 02GC ... 40
Figure C3: Approximate stratigraphic positions of cores COR2001-04BC and 04GC ... 41
Figure C4: Approximate stratigraphic positions of cores COR2001-04GGC and 06BC ... 41
Figure C5: Approximate stratigraphic positions of cores COR2001-07GGC, 08BC, 08GGC, 10BC, 11BC, and 19BC ... 42
Figure C6: Approximate stratigraphic position of core COR2001-07BC... 42
Figure C7: Approximate stratigraphic positions of cores COR2001-09BC and 12BC ... 43
Figure C8: Approximate stratigraphic positions of cores COR2001-15BC and 17BC ... 43
Figure C9: Approximate stratigraphic positions of cores COR2001-13BC, 14BC and 18BC ... 44
Figure C10: Approximate stratigraphic positions of cores COR2001-17GGC and 31BC ... 44
Figure C11: Approximate stratigraphic position of core COR2001-23BC... 45
Figure C12: Approximate stratigraphic position of core COR2001-27BC... 45
Figure D1: CTD profiles COR2001-01-06 ... 46
Figure D2: CTD profiles COR2001-07-12 ... 47
Figure D3: CTD profiles COR2001-13-18 ... 48
Figure D4: CTD profiles COR2001-19-24 ... 49
Figure D5: CTD profiles COR2001-25-30 ... 50
6
Figure E1: Photos of successful box cores 01-09 recovered during the mission. ... 52 Figure E2: Photos of successful box cores 10-20 recovered during the mission. ... 53 Figure E3: Photos of successful box cores 24-32 recovered during the mission. ... 54
7
L
IST OF TABLESTable 1: Scientific participants of the COR2001 cruise ... 10
Table 2: Summary of activities ... 12
Table 3: Specifications of the EM2040 ... 20
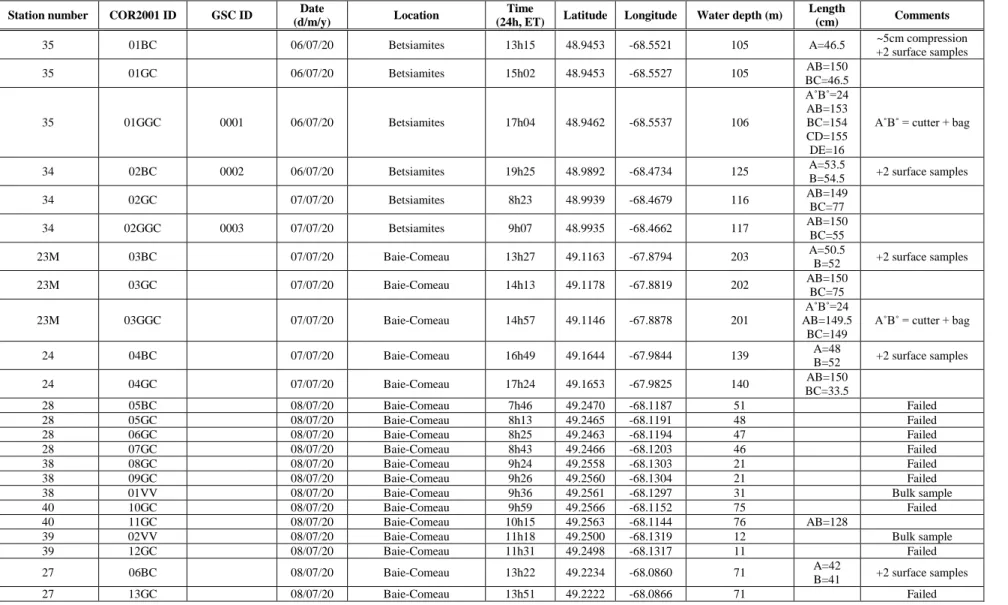
Table A1: Summary of core stations ... 25
Table A2: Summary of CTD stations ... 27
8
A
CKNOWLEDGMENTSThe scientific staff would like to thank the Commanding Officer Robert Bélanger, the deck crew led by boatswain Gilles Pelletier and the entire ship’s crew for its support and help during this successful mission. This oceanographic expedition was supported by Réseau Québec maritime (RQM), the Marine Environmental Observation Prediction and Response Network (MEOPAR), and the Natural Sciences and Engineering Research Council of Canada (NSERC) through Discovery Grants to J.C.M.S. and A.L. We thank the technical staff of the Geological Survey of Canada (Atlantic) at BIO for support with the coring material used during the expedition as well as Christian Boutot (UQAR-ISMER), Pascal Rioux (UQAR-ISMER) and Erwann Fraboulet (RQM) for assistance with the preparation of the sampling material and transport logistics.
9
1.
B
ACKGROUND ANDO
BJECTIVESSubmarine canyons and channels serve as conduits for episodic turbidity currents that transport large volumes of carbon- and nutrient-rich terrigenous sediment to the seafloor. These currents and other hydrodynamic processes lead to mixing within the water column which favors primary and secondary productivity in many places. In eastern Canada, the Lower St. Lawrence Estuary (LSLE) bathymetry is bounded by steep slopes (often ≥5°) which allowed inner-shelf submarine canyons and channels to form during the Late Quaternary. Sediments flowing through these canyons and channels mainly originate from rivers, longshore drift, and remobilization of shelf and slope sediments. However, triggers of turbidity currents in the LSLE remain poorly understood due to few direct measurements and even fewer long-term (> 50 years) recurrence documentation. Likewise, while the offshore waters of the Québec North Shore are important in terms of primary production and biomass accumulation, important seedbeds of Alexandrium catenella (formerly Alexandrium tamarense; 300 to 600 cysts/cm3) have been localized in the shallow sediment from Manicouagan/aux-Outardes Rivers to Pointe-des-Monts. Nevertheless, the role and connectivity between the spatio-temporal changes in sediment remobilization from nearshore to offshore, currents within LSLE canyons and channels and surface productivity has never been investigated.
In this context, we developed a network of researchers (including scientists from the fields of marine geology, geochemistry, micro-paleontology, geography, literary creation and ethics) from universities and the federal government. Together, we will test the hypothesis that sediment remobilization events and hydrodynamic processes within canyons and channels play important roles in the regional primary productivity by: 1) influencing the pathways and rate by which nutrients and sediment are delivered to the water column, and 2) facilitating the resuspension and dispersal of algal benthic resting stages, thereby potentially playing a role in the initiation of algal blooms, including those associated with harmful species. We also postulate that the coastal populations in LSLE are not fully aware of the existence of such a dynamic underwater environment and the roles it may play on what is manifested at the surface (e.g., regular sightings of marine mammals).
Based on a transdisciplinary approach, the purpose of this RQM-MEOPAR funded expedition is to carry out CTD-rosette measurements, hydroacoustic surveys (high-resolution multibeam bathymetry and sub-bottom profiles), sediment coring operations, plankton net sampling and collect geopoetics and literary material to 1) investigate long term hydrodynamic processes and natural hazards during coastal to offshore sediment remobilization and its impact on primary productivity dynamics in the LSLE and 2) explore the heuristic process of scientific and artistic knowledge, and expand both by a creative common shared experience and reflection.
10 The scientific cruise took place on board the R/V Coriolis II, a research vessel owned by Reformar and able to accommodate 28 people. For the COR2001 cruise, only 6 scientists and 9 crew members were able to participate because of the COVID-19 pandemic.
2.
P
ARTICIPANTSScientific participants of the COR2001 cruise consisted of three Université du Québec à Rimouski (UQAR) researchers, one University of New Brunswick (UNB) researcher, and one shore-based scientist from the Geological Survey of Canada (GSC) (Table 1, Fig. 1).
Table 1: Scientific participants of the 2019Nuliajuk cruise
Name Organization Role
Jean-Carlos Montero-Serrano Professor, UQAR-ISMER Co-chief Scientist. Responsible of coring operations
Audrey Limoges Professor, UNB
Co-chief Scientist. Responsible of plankton net sampling and core
processing
Anne Corminboeuf M.Sc., UQAR-ISMER
Core processing, plankton net sampling, and co-responsible of the
cruise report
Tina Laphengphratheng M.A., UQAR
Core processing, plankton net sampling, and co-responsible of the
cruise report Alex Normandeau GSC Shore-based scientist
Figure 1: Participants of the COR2001 cruise. From left to right: Michel Miron, Gilles Desmeules, Victor Garvey, Anne Corminboeuf, Dominic Ndeh Munang, Gilles Pelletier, Jean-Carlos Montero-Serrano, Robert
11
3.
S
UMMARY OFA
CTIVITIESThe COR2001 RQM-MEOPAR cruise, called 2020CORIOLIS for the purpose of GSC archiving, started in Rimouski. During the mobilization, the following equipment and lab spaces were installed and organized: the CTD-Rosette, the core processing laboratory, the giant gravity corer and the acquisition room. When the mobilization ended, the ship immediately left the port with the afternoon tide to reach the first station and start its sampling.
The cruise was separated into 6 areas of priority (Fig. 2): Pointe-des-Monts, Godbout and Baie-Comeau (high priority), Franquelin and Manicouagan (secondary priority) and Betsiamites (tertiary priority). Those areas were sampled during daytime, while every hydroacoustic survey lines were performed at night. The COVID-19 pandemic could not allow full personnel capacity; hence the normal sampling schedule was from 7h00 to 19h00 for the main sampling (CTD, plankton nets and sediment coring).
Sampling consisted of CTD profiles, plankton nets and coring (gravity coring, box coring and grab sampling). Material for the literary part of the project was created along with other samplings (i.e. photos, thoughts, poems). Every plankton and sediment samples were stored until demobilization, which took place in Rimouski. In total, 45 stations where sampled with 31 CTD profiles, 25 plankton nets, 15 Van Veen grabs, 28 box cores, 6 gravity cores, 11 giant gravity cores, 50 fragments of thoughs, 90 geopoetic fragments and 1000 km of hydroacoustic data.
Figure 2: Summary of activities during COR2001. Blue shaded areas are multibeam surveys completed during COR2001 and dots are all the samples collected.
12
Table 2: Summary of activities. During the mission 4 BC, 15 GC and 6 GGC did not work due to the sandy nature of the seabed. Note that these failed operations are not reported in the table.
Date JD Location VV GGC GC BC CTD PN 3.5
kHz MBES
Notes
July 5 187 Betsiamites x x Mobilization
July 6 188 Betsiamites 1 1 2 1 1 x x July 6 188 Pointe-aux-Outardes 1 1 x x July 7 189 Pointe-aux-Outardes 1 1 x x July 7 189 Manicouagan 1 2 2 2 2 x x July 8 190 Manicouagan 2 1 1 1 2 2 x x July 8 190 Franquelin 1 1 1 x x July 9 191 Pointe-des-Monts 5 1 3 3 x x July 10 192 Pointes-des-Monts 2 5 4 4 x x July 11 193 Pointes-des-Monts 1 6 6 6 x x July 12 194 Godbout 3 1 1 4 3 x x July 13 195 Manicouagan 2 1 3 3 2 x x July 13 195 Franquelin 1 1 1 x x July 14 196 Pointe-aux-Outardes 1 1 3 2 x x July 14 196 Betsiamites 1 1 2 2 x x
July 15 197 Rimouski Demobilisation
TOTAL 15 11 6 28 31 25
4.
P
RELIMINARYR
ESULTS4.1 Cruise statistics
45 stations were sampled during the cruise for a total of 105 physical samples and 140 literary fragments
1. 31 CTD profiles, 2. 25 plankton nets, 3. 15 Van Veen grabs, 4. 28 box cores, 5. 6 gravity cores, 6. 11 giant gravity cores,
7. 1000 km of multibeam bathymetry data 8. 50 fragments of thoughts,
13
4.2 Key preliminary results
High-resolution seafloor mapping in all the areas surveyed revealed the presence of bedforms that suggest modern active sediment transport. Three examples of preliminary results are provided below, illustrating the dynamic nature of the nearshore environment of the Lower St. Lawrence Estuary.
4.2.1 Betsiamites
Offshore the Betsiamites River, seafloor mapping completed in 2005 by the Canadian Hydrographic Service hinted at the presence of bedforms on the delta slopes. These bedforms were mapped at a higher resolution during this COR2001 cruise. A comparison of the 2005 to the 2020 datasets, a 15-year difference, shows that offshore sediment remobilization has occurred (Fig. 3). A slope failure occurred on the slope, evidenced by up to 3 m of erosion on the slope. This dataset clearly shows that slopes failures and sediment density flows occur in the nearshore environment of the Québec North Shore.
Figure 3: Recent (post 2005) slope failure on the Betsiamites delta, evidencing recent sediment remobilization offshore. A) 2020 multibeam bathymetry; B) Difference in bathymetry between 2005 and 2020. 4.2.2 Franquelin
Offshore the Franquelin River, a large slope failure was imaged in greater detail. Within the head of this large slope failure, seafloor bedforms are imaged, suggesting that sediment density flows occur at the mouth of the delta. These bedforms remain limited to the nearshore environment and do not appear to extend downslope to the Laurentian Channel. A small littoral cell also transports sediment eastward where the shelf narrows and sediment overspill on the slope, creating another field of seafloor bedforms (Fig. 4).
14
Figure 4: Evidence of slope failure and offshore sediment transport in the Franquelin area. Bedforms suggest sediment density flows occur at the mouth of the river and at the end of a small littoral cell to the east. 4.2.3 Pointe-des-Monts
Offshore Pointe-des-Monts, submarine canyons are known to be active, through the passage of sediment density flows. The comparison of multibeam bathymetry collected in 2019 and 2020 reveals that turbidity currents have occurred in the past year. In addition, a box core collected on the submarine fan shows the presence of a sand layer, interpreted as a turbidite (Fig. 5). Examination of the Plankton Net and CTD-R will help understand the role these events play on primary productivity.
15
Figure 5: Evidence of a 'recent' turbidite in box core 08, in Pointe-des-Monts.
5.
D
AILY NARRATIVE*All date/time in Eastern Standard Time.
5.1 JD187 – July 5, 2020 – Rimouski
Every scientific member was onboard before 7h00. The familiarization tour was performed at 8h00 and the R/V Coriolis II departed the marina of Rimouski at 13h30 (scheduled departure time was 15h00) heading towards Betsiamites. After departure, the deck crew verified the main winch to conclude that it was not functional. They tried to fix it, but when we arrived on site 37 at 15h00, the winch was not ready for use. Instead of sampling, the SVP measurements and patch tests for the multibeam sonars were performed from 18h30 to 19h00 in the Betsiamites area. At 19h30, when the crew left the deck, the main winch was still not functional. We decided to wait until the next day to try to fix it before taking another decision.
5.2 JD188 – July 6, 2020 – Betsiamites
During the night, bathymetric survey lines were performed in the Betsiamites area. Crew members converted the 3-ton winch on the upper deck and used it instead of the 5-ton winch. Sampling at station 35 was performed from 9h34 to 17h15 in this order: CTD cast, plankton net, box core, gravity core and giant gravity core, which will be the usual sampling line-up for the
16 cruise. At 15h05, another problem occurred: the counting pulley maintaining the cable to the winch dropped when the gravity core hit the bottom. It does not appear to have affected the coring since the core recovered was 1.65m long. The ship did a short transit to reach station 34 which was sampled from 18h36 to 19h35 with a CTD cast, a plankton net and a box core. For the first deployment of every equipment, it took longer than expected as everyone was still developing a routine and locating required material.
5.3 JD189 – July 7, 2020 – Pointes-aux-Outardes
During the night, bathymetric survey lines were performed in the Pointe-aux-Outardes area (partially completed). We finished sampling station 34 with a gravity core at 8h34. It took a long time to get prepared because many screws used for the GGC couplings were either stripped or dirty, and therefore impossible to use. A special care should be given during the storage process and grease should be applied on those pieces. We also tried the 9 m long giant gravity corer, but it did not perform well (recovered core = 2.05m). Hence, we decided to keep a barrel length of 6 m for the giant gravity core for the next deployment. At 9h18, we transited to station 23M where sampling started at 12h46 and ended at 15h09. During the box core recovery, the box hit the side of the ship, which disturbed the surficial sediments. We then transited to station 24, where sampling was performed from 16h10 to 17h32. We determined that an efficient way to proceed was to deploy the box core and subsample it while the gravity corer is being deployed. This method was successfully used for the 2 stations today.
5.4 JD190 – July 8, 2020 – Manicouagan
During the night, bathymetric survey lines were performed in the Pointe-aux-Outardes area (completed survey of this sector) and Manicouagan area (partially surveyed). At 7h11, we were ready to deploy the CTD at station 28. Sampling continued with a PN at 7h28. Coring at this station was unsuccessful: 05BC, 05GC, 06GC and 07GC failed because of the sandy nature of the substrate. Also, the counting pulley handling the cable from the winch and going to the A-frame dropped twice (8h14 and 8h26). We moved a little further to station 38, where sampling started at 9h23. Cores 08GC and 09GC also failed because of the sandy nature of the substrate. Therefore, for the first time, we deployed the Van Veen Grab at 9h35. At 9h38, we left station 38 for station 40, which was sampled from 9h57 to 10h16. There, 10GC failed, but 11GC was successful with a recovered core of 1.28 m. Then, the ship reached the port of Baie-Comeau where material (liners and caps for gravity corer of 1.5m) arrived from UQAR-ISMER with the morning ferry. At 11h47, the sampling at station 39 started with a Van Veen Grab and ended at 11h32 with a failed 12GC. We then moved to station 27, where sampling started at 12h38 and ended at 13h52 with a failed 13GC. Station 26 was sampled from 14h27 to 14h32 with a successful GGC of 4.55 m length. Finally, sampling at station 22 started at 16h24 and ended at 17h32. Once again, because of the presence of a relatively thick layer of fine sand at the surface, the BC was almost empty (07BCA = 14 cm and 07BCB = 18 cm) and the 05GCC failed.
17
5.5 JD191 – July 9, 2020 – Pointe-des-Monts
During the night, bathymetric survey lines were performed in the Manicouagan area (completed) and Godbout area (partially surveyed). This morning, from 7h00 to 7h31, we were searching for an alternate station 01 with suitable substrate. At 7h31, the CTD was in the water. At 8h10, we tried a Van Veen Grab to evaluate the substrate. At 8h36, we decided to try a gravity core, but it was unsuccessful, like the next gravity core. At 9h00, we started a short transit towards station 03, where CTD profiling started at 9h41. At 10h00, we had a loss of hydraulic power that took 10 minutes to repair. At 10h11, we were ready for the plankton net. We had another loss of hydraulic power right after the net, at 10h20, and also an oil spill from the winch that took 20 minutes to contain. At 10h57, we were ready for a Van Veen Grab, and then left for the next station at 11h09. At 11h34, we were on station 05 and ready for a CTD, but we had to reposition the ship. The CTD was finally deployed at 11h45. Sampling was performed until 13h43, when a major problem occurred: during the box core lowering, the cable got stuck in the counting pulley (the one providing the speed and depth to the operator). From 13h43 to 14h24, crew members worked to repair the counting pulley. At 14h29, the box core was back on deck, but empty. From 14h30 to 15h12, crew members worked to remove the counting pulley. Therefore, next deployments were performed without indication of the speed and current depth. At 16h01, sampling resumed and led to a successful box core and an unsuccessful giant gravity core. At 17h14, we moved for the final Van Veen Grab at station 05-M-2, which took place from 17h41 to 17h52.
5.6 JD192 – July 10, 2020 – Pointe-des-Monts
During the night, bathymetric survey lines were performed in the Godbout area (partially surveyed). At 7h09, the CTD was ready for deployment at station 05-M, followed by a PN and a BC. We then moved slightly to come back to station 05-M-2 at 9h12. We left at 10h47 for station 07, which was sampled from 12h25 to 14h46. Station 06 was sampled from 15h19 to 16h15, and station 02 was sampled from 16h50 to 17h43. After the last BC, members of the cruise reunited on the deck for a group photo. Today, coring operations had a limited success: the sandy seabed did not allow a good penetration of the corers and sampled cores were smaller than those obtained previously from silt/clay seabeds.
5.7 JD193 – July 11, 2020 – Pointe-des-Monts
During the night, bathymetric survey lines were performed in the Godbout (completed) and Franquelin (partially surveyed) areas. This morning, we sampled station 10. The CTD was in the water at 7h08 and was completed by 7h20, but the data archiving was not activated. We performed a second CTD from 7h26 to 7h38 and the sampling at this station ended at 8h22 with a box core from which only surface sediments were sampled. We then transited to station 9, which was sampled from 8h51 to 9h41. Once again, only surface sediments were taken from the
18 box core. We transited to station 8 where the original station was modified based on sub-bottom data. The CTD was in the water at 10h48, but the data archiving was not activated again. A second CTD was performed from 11h14 to 11h31. At 12h46, we left the station and transited to station 13. During the CTD that started at 13h20, a problem with the cable occurred. The CTD was brought back onboard and deployed again from 13h32 to 13h44. At 14h30, we left station 13 and transited to station 12, where sampling was performed from 15h03 to 15h40. Sampling at station 11 was performed from 16h22 to 16h56, and sampling at station 41 was performed from 17h30 to 17h37 (which consisted of a single box core). Coring operations were better than yesterday since the substrate was fine sand with a higher content of silt/clay
5.8 JD194 – July 12, 2020 – Pointe-des-Monts
During the night, bathymetric survey lines were completed in the Godbout area and the partial survey of the Godbout-C area took slightly longer than usual. Therefore, we were ready to start the sampling at station 16 at 7h48. It was decided to first deploy the CTD, PN and BC at all stations, and then come back to complete with the GC deployments. Stations 16 (7h48 to 8h27), station 18 (9h19 to 9h44, with a failed 21BC), station 20 (11h43 to 12h56, with a failed 22BC), station 42 (13h33 to 13h53) and station 43 (14h09 to 14h17) were sampled first. We then came back to station 20 (14h51 to 14h55, with failed 09GGC and 10GGC). We moved further to station 20-1 (15h52 to 16h13), where 17GC and 18GC failed. We moved again further to station 20-2 (16h41 to 16h46), where 11GGC failed. We finished the day at station 16 (17h36 to 17h44) with a successful 12GGC (4.06m). Again, sampling operation had a limited success due to the layer of fine sand overlying a relatively thick layer of finer sediment, the latter being inferred from sub-bottom profiles. It appears that our equipment cannot go through this layer to reach the silt/clay layer underneath. Many trials were made to find the perfect speed to prevent the corer to lay on the seabed, but it was unsuccessful.
5.9 JD195 – July 13, 2020 – Godbout
During the night, bathymetric survey lines were performed in the Godbout (partially surveyed) and Franquelin (partially surveyed) areas. Station 29 was sampled from 7h12 to 7h53. Sediments in the 23BC were washed out and only the bulk sediments were subsampled. We then transited to station 30 and sampled from 8h33 to 9h15. Station 31 was sampled from 9h58 to 11h44. Station 44 was sampled from 12h56 to 12h58 and only with a GCC, which failed because of the sandy bottom. Finally, after a 2.5-hour transit, station 21 was sampled from 15h32 to 16h58.
5.10 JD196 – July 14, 2020 – Manicouagan
During the night, bathymetric survey lines were performed in the Franquelin area. Station 32 was sampled from 7h06 to 8h23 (failed 20GC and 21GC). Station 33 was sampled from 9h02 to 9h32. A problem occurred with the CTD system: we had to bring back the CTD and start over. Station 45 was sampled from 10h29 to 11h38 (failed 29BC). A marked fluorescence peak, the
19 highest of the cruise, was noted during the CTD profile. Station 33 was sampled from 13h22 to 13h30 with a successful assembled 9m-GGC of 6.20m. Station 37 was sampled from 15h12 to 17h07. Finally, station 36 was sampled from 17h58 to 18h07.We transited toward Rimouski, where we docked with the night tide at 20h00.
5.11 JD197 – July 15, 2020 – Rimouski
Demobilisation was performed between 8h00 and 12h00 in Rimouski dock. All samples collected were transport and stored at 4°C in the cool room of the UQAR-ISMER. End of program.
6.
E
QUIPMENT ANDP
ROCEDURES6.1 Edgetech X-Star 2.1 sub-bottom profiler
This sub-bottom profiler allows the acquisition of high-resolution subsurface data (sediment stratigraphy). The echo sounder transmits FM acoustic waves (0.5 to 12 kHz, centered on 4.5 or 6 kHz) with 9 transducers that serve as both transmitters (TX) and receiver (RX). During the cruise, the data from the EdgeTech echosounder were all acquired using the seismic wave (pulse) Hull 2_8_40WB (frequency modulation from 2 to 8 kHz, pulse duration of 40 ms) and a frequency of 3 Hz. The acquisition and visualization of the profiles was done with the version 2.1 of the Edgetech Discover X-Star software. However, the raw JSF data were converted to SegY following a routine conversion. The SegY data were then converted into JP2 format using SegyJp2 software.
20
6.2 EM-2040 multibeam echosounder
The EM-2040 is a shallow-water multibeam echosounder (MBES) that allows the mapping of the seabed at a maximum depth of ~500 m. A transducer (TX) emits an acoustic wave that is reflected from the seabed and picked up by a receiver (RX). The EM-2040 echosounder operates at a frequency that varies between 200, 300 and 400 kHz depending on the depth and resolution required. It has 400 pings per swath and allows coverage of 5.5 times water depth. During this expedition, a frequency of 300 kHz was used, which allowed mapping the seabed to a maximum depth of 480 m while maintaining a very good resolution. An Applanix POS M/V was positioned near the center of gravity of the ship to record the motion of the vessel and the data were integrated using the multibeam echosounder’s acquisition software (SIS). The static and dynamic calibrations (patch tests) were carried out at the beginning of the expedition. The MBES data were processed using the CARIS software during the night watches and gridded surfaces were ready to view in the morning (~7h00). Final surfaces can be gridded at 1 m horizontal resolution.
Table 3: Specifications of the EM2040
Beams 400 (HD Equi-Distant)
Frequency 200kHz - 400kHz (used 300 kHz)
Swath Greater than four times water depth
Max Swath Angle 120 degrees
Depth Range 10m-500m
In order to georeference MBES data, sound velocity profiles (SVP) were done during the surveys. SVPs are used to correct the ray tracing of the MBES data. The most efficient way to perform sound velocity profiles was to stop the vessel and deploy the profiler with a winch. This operation was performed 3 times during each night of mapping operations: 1) at the beginning, during the day/night shift transition, 2) in the middle of the night, and 3) at the night/day shift transition. This deployment required two persons: 1 hydrographer and 1 deck assistant (winch operator). During this expedition the SVP AML Minos sensor was used. This sensor was lowered in the water column using a weight of approximately 9 kg (20 lbs). It is suggested to use up to 3 shackles available in the BOSEN store during this operation. The assembly to lower the profiler requires a pulley to direct the rope to the aft deck of the vessel. For the deployment, the profiler was attached with a shackle on the rope and lowered at the water level with the winch. The winch counter was reset to 0 and the probe was deployed to 90% of the last observed depth at a speed of ~90 m/min (1.5 m/s). The probe was then brought back up and recovered by the hydrographer. The hydrographer then integrated the SVP profile in the SIS acquisition software to calibrate the MBES data.
21
6.3 Coring
6.3.1 Van Veen grab sampler (VV).
The VV grab sampler is a rapid and simple method to collect sediment samples at the seabed. When the grab sampler touches bottom, it closes, holding surficial sediments. It can collect up to
0.008 m3 of sediment. This sampling device was used to verify the nature of the substrate before
using the box corer or when the box corer was unsuccessful in collecting sediments. The VV was lowered at an average speed of 50 m/min (0.83 m/s).
6.3.2 Box corer (BC).
The BC collects up to 0.125 m3 of soft sediments at the seafloor and is suitable for any water depths (limited by winch cable length). It is used for minimum disturbance of the sediment/water interface. The BC was lowered at an average speed of 50 m/min (-0.83 m/s). When the sampler was approximately at 100 m above the seabed, wire payout was slowed to approximately 20-25 m/min (0.33 to 0.42 m/s). On contact with the seafloor, a little extra wire was given to allow box penetration, and the winch was stopped. A few seconds thereafter, the corer was uplifted back at a slow rate, at approximately 10 m/min (0.17 m/s). It is at this time that the spade is levered into the mud and the apparatus is pulled out: thus the wire speed was increased to 50 m/min (0.83 m/s). During the expedition, two push-cores (PVC tubes of 10 cm diameter and ~60 cm length) were taken from each box core with the aid of a vacuum pump to reduce compaction. The sediment/water interface (0-1 cm surface sample) from each box-core location was subsampled into two Whirl-Pak bags for subsequent identification of microfossils (e.g., dinoflagellate cysts and non-pollen palynomorphs, diatoms, etc.) as well as grain size, mineralogical, geochemical, and magnetic analyses. Each push core and surface sediment samples were stored in the refrigerated container (4°C).
6.3.3 Gravity core (GC).
During the expedition, two GC of different lengths (1.5 and 3 m) were deployed. The 3 m GC has a maximum recovery length of ~2.80 m (in a 3 m aluminum barrel), uses a stainless-steel cutting head and penetrates the sediment under a 165 kg weight. The 1.5 m GC has a maximum recovery length of ~1.5 m (in a 1 m galvanized steel barrel), uses a manganese bronze cutting head and penetrates the sediment under 80 kg of weight. In both GC, a check valve was installed at the top end of the corer’s main body to allow a water flow through the liner during the descent and to block the water during the ascension. This valve prevents the water from flushing out the collected sample. A core catcher keeps the sediment in the GCs during uplift. Winch speeds (lowering) ranged from 60 to 70 m/min (1 to 1.17 m/s) depending on hypothesized substrate properties. After a tension drop at the point of penetration, about 2-3 m of cable was given to ensure that the weight could allow a full penetration of the corer into the sediment. After penetration into the sediment, the corer was heaved at a speed of 10 m/min (0.17 m/s) until it
22 was free from the bottom. Then the corer was heaved at a speed of 60 m/min (1m/s) on board. Once on deck, the cores were cut into 1.5 m long sections and stored in a cold room at 4°C.
6.3.4 Giant gravity corer (GGC).
The GGC operates with a core head of 817 kg with two or three 3.05 m steel core barrels (91 kg each) connected with steel coupling sleeves attached with set screws, and a steel cutting head. A core catcher helps keep the sediment in the corer when the latter is pulled upward. A valve (rubber butterfly flaps) of 3.5 inches long was installed at the top end of the first 3m liner to allow a water flow through the liners during the descent and blocks water during the ascension. This valve prevents the water from flushing out the collected sample. This coring instrument allows the collection of long cores of up to a maximum length of 6 or 9 m. The GCC was lowered with an average speed of 60 m/min (1 m/s). The corer was lowered at about 80 m, stopped above the seafloor for 1 min and then lowered at a speed of 25-30 m/min (0.4-0.5 m/s) depending on sediment substrate properties determined previously through box coring. After a tension drop at the point of penetration about 10 m of cable slack was given to ensure that the weight allowed full penetration of the corer into the sediment. After penetration into the sediment, the corer was heaved at a speed of 10 m/min (0.17 m/s) until it was free from the sediment. Then the corer was heaved at a speed of 60 m/min (1 m/s) until near the sea surface. Once on deck, the plastic liner was cut into 1.5 m long sections and these sections were stored in a cold room (4°C). Note that the BC collected in conjunction with the GGC allows recovery of the undisturbed sediment-water interfaces, which are usually perturbed when the GGC enters the
sediments. Ideally, push cores from box-cores can be correlated visually,
chronostratigraphically, or geochemically with GGC from the same site.
6.3.5 Samples and core identification and labelling
The sediment core and phytoplankton samples were labelled using the following numbering system: COR2001-01BC COR = Coriolis II 20 = Year 2020 01 = Leg # 1 01 = Station # 1
BC = Corer type (e.g., VV = Van Veen grab, BC = box core, GC= gravity core, GCC = giant gravity core, PN: phytoplankton net, CTD = CTD-Rosette)
AB = Core section if applicable
The 1.5 m subsections of the giant gravity and gravity cores were labelled as per Fig. 6 with “A” identifying the base and section AB corresponding to the lowest, oldest section, followed by BC,
23 CD etc. sequentially. When multiple push cores were taken from a box core, they were labelled using a sequential alphabetical identifier, e.g. 03BC-A, 03BC-B, 03BC-C, etc.
Figure 6: Labelling system for the sections of the gravity cores
The core samples were stored vertically in a refrigerated container on the R/V Coriolis II during Leg 1. Cores, surface sediment and phytoplankton net samples were transported to Rimouski during the demobilization, where they were stored before analyses. A selection of cores (See Appendix A) was also shipped to Geological Survey of Canada (Dartmouth) and one set of twin surface sediment samples was directly transported to UNB for microfossil analyses.
6.4 Plankton Net sampling
Plankton samples were collected with a 30 cm diameter net with a 20 μm mesh size. A heavy lead weight of 10kg was fixed at the base of the cod-end and the net was lowered vertically down to 100m in the water column. After 30 seconds, the net was hauled back at a constant speed of 30 m/min (0.5 m/s). The net was rinsed from top to bottom with seawater from the sampling site, and the inside of the net was rinsed with sea water from the sampling site to ensure that all the organisms were collected. The concentrated samples were transferred into 250 mL plastic jars, preserved with 10 mL of formaldehyde (37%) and stored in a refrigerator (4°C).
6.5 CTD-Rosette
During this expedition the CTD-R was composed of 12 Niskin-type bottles of 12 L with an automatic closing system that normally allows the sampling of seawater at specific depths. A CTD probe, which continuously measures the conductivity, temperature, density, dissolved oxygen, pH, % light transmission and the fluorescence was also attached to the rosette. Note that we did not collect water samples during this expedition. Deployment steps were as follow: 1) Immerse the rosette in the surface (about 5 meters) and turn the pump on; 2) wait 30 seconds for the plumbing system to flush (Check that the probes stabilize); 3) Start archiving (recording) in SeaSave; 4) Descend at 1 meter/second (if possible with a winch) to 10 meters from the bottom; 5) Slow down to 20 meters from the bottom by checking the altimeter to stop at 10 meters from the bottom; 6) If bottom water is required, wait 30 seconds (or wave stabilization) and then close the desired number of bottles; 7) ascend to the requested depths by following the same procedure before closing the bottles (waiting for wave stabilization); 8) Once at the surface and water sampling has been completed, turn the pump off; 9) Stop archiving and close deck unit.
24
7.
CONCLUSIONSThis mission was a success on many levels: water column profiling (CTD), and phytoplankton (PN) and sediment (VV, BC, GC, GGC) sampling were done at every planned station. In addition, it was possible to conduct opportunistic sediment sampling despite being on a reduced team. All the priority areas defined for the bathymetric surveys were completed. Material was also collected for the literary part of the project. Sampling activities were recorded with photos and short videos, about fifty fragments of thoughts and reflections for a potential essay and about ninety ideas for geopoetic fragments and poems were written. The texts for the essay revolve around the similarities and differences between scientific methods and creative methods in literature, which both aim at understanding the world from different perspectives. For the poetic fragments, the ideas take source from a glossary of words about the “nature” and the “sea”. A major theme exploited at this early stage of the project is the quest for identity. Here is a fragment quote: « J’ai froid sous ma peau /mes os frétillent / ma mâchoire serrée /mes muscles pétrifiés / les halos de chaleur se résorbent quand / je les frôle / dans les interstices du vide je / tricote / un nuage / fait bouillir le soleil ».
25
A
PPENDIXA:
S
TATION SUMMARYTable A1: Summary of core stations
Station number COR2001 ID GSC ID Date
(d/m/y) Location
Time
(24h, ET) Latitude Longitude Water depth (m)
Length
(cm) Comments
35 01BC 06/07/20 Betsiamites 13h15 48.9453 -68.5521 105 A=46.5 ~5cm compression
+2 surface samples 35 01GC 06/07/20 Betsiamites 15h02 48.9453 -68.5527 105 AB=150 BC=46.5 35 01GGC 0001 06/07/20 Betsiamites 17h04 48.9462 -68.5537 106 A˚B˚=24 AB=153 BC=154 CD=155 DE=16
A˚B˚ = cutter + bag
34 02BC 0002 06/07/20 Betsiamites 19h25 48.9892 -68.4734 125 A=53.5 B=54.5 +2 surface samples 34 02GC 07/07/20 Betsiamites 8h23 48.9939 -68.4679 116 AB=149 BC=77 34 02GGC 0003 07/07/20 Betsiamites 9h07 48.9935 -68.4662 117 AB=150 BC=55
23M 03BC 07/07/20 Baie-Comeau 13h27 49.1163 -67.8794 203 A=50.5 B=52 +2 surface samples
23M 03GC 07/07/20 Baie-Comeau 14h13 49.1178 -67.8819 202 AB=150 BC=75 23M 03GGC 07/07/20 Baie-Comeau 14h57 49.1146 -67.8878 201 A˚B˚=24 AB=149.5 BC=149
A˚B˚ = cutter + bag
24 04BC 07/07/20 Baie-Comeau 16h49 49.1644 -67.9844 139 A=48 B=52 +2 surface samples 24 04GC 07/07/20 Baie-Comeau 17h24 49.1653 -67.9825 140 AB=150 BC=33.5 28 05BC 08/07/20 Baie-Comeau 7h46 49.2470 -68.1187 51 Failed 28 05GC 08/07/20 Baie-Comeau 8h13 49.2465 -68.1191 48 Failed 28 06GC 08/07/20 Baie-Comeau 8h25 49.2463 -68.1194 47 Failed 28 07GC 08/07/20 Baie-Comeau 8h43 49.2466 -68.1203 46 Failed 38 08GC 08/07/20 Baie-Comeau 9h24 49.2558 -68.1303 21 Failed 38 09GC 08/07/20 Baie-Comeau 9h26 49.2560 -68.1304 21 Failed
38 01VV 08/07/20 Baie-Comeau 9h36 49.2561 -68.1297 31 Bulk sample
40 10GC 08/07/20 Baie-Comeau 9h59 49.2566 -68.1152 75 Failed
40 11GC 08/07/20 Baie-Comeau 10h15 49.2563 -68.1144 76 AB=128
39 02VV 08/07/20 Baie-Comeau 11h18 49.2500 -68.1319 12 Bulk sample
39 12GC 08/07/20 Baie-Comeau 11h31 49.2498 -68.1317 11 Failed
27 06BC 08/07/20 Baie-Comeau 13h22 49.2234 -68.0860 71 A=42
B=41 +2 surface samples
26 26 04GGC 0004 08/07/20 Baie-Comeau 14h29 49.2188 -68.0854 71 A˚B˚=22 AB=150 BC=155 CD=148
A˚B˚ = cutter + bag
22 07BC 08/07/20 Franquelin 16h51 49.2587 -67.8341 139 A=14
B=18 +2 surface samples
22 05GGC 08/07/20 Franquelin 17h28 49.2590 -67.8351 138 Failed
1 03VV 09/07/20 Pointe-des-Monts 8h15 49.3044 -67.3903 177 Bulk sample
1 14GC 09/07/20 Pointe-des-Monts 8h40 50.9705 -67.3890 178 Failed
1 15GC 09/07/20 Pointe-des-Monts 8h58 49.3044 -67.3898 176 Failed
31 04VV 09/07/20 Manicouagan 11h04 49.2940 -67.3769 254 Bulk sample
5 05VV 09/07/20 Pointe-des-Monts 13h16 49.2855 -67.3684 291 Bulk sample
5 06VV 09/07/20 Pointe-des-Monts 15h16 49.2852 -67.3693 291 Bulk sample
5 08BC 09/07/20 Pointe-des-Monts 16h06 49.2857 -67.3695 290 A=49.5
B=49.5 +2 surface samples
5 06GGC 09/07/20 Pointe-des-Monts 17h09 49.2850 -67.3695 292 Failed
05M-2 07VV 09/07/20 Pointe-des-Monts 17h47 49.2853 -67.3798 278 Bulk sample
05M 09BC 10/07/20 Pointe-des-Monts 8h08 49.2904 -67.3818 266 +2 surface samples
05M-2 07GGC 10/07/20 Pointe-des-Monts 9h21 49.2839 -67.3798 278 AB=93.5 05M-2 16GC 10/07/20 Pointe-des-Monts 10h08 49.2863 -67.3806 274 Failed 05M-2 10BC 10/07/20 Pointe-des-Monts 10h38 49.2847 -67.3796 277 A=37 B=38 +2 surface samples 7 11BC 10/07/20 Pointe-des-Monts 13h29 49.2841 -67.3883 291 A=48 B=49 +2 surface samples 7 08GGC 10/07/20 Pointe-des-Monts 14h42 49.2836 -67.3867 290 AB=56.5 6 12BC 10/07/20 Pointe-des-Monts 16h11 49.2928 -67.3927 263 A=25 B=26.5 +2 surface samples 2 13BC 10/07/20 Pointe-des-Monts 16h57 49.3069 -67.3965 152 A=22 B=22.5 +2 surface samples
10 14BC 11/07/20 Pointe-des-Monts 8h18 49.3038 -67.4140 175 only surface samples
9 15BC 11/07/20 Pointe-des-Monts 9h37 49.2966 -67.4125 215 only surface samples
8 16BC 11/07/20 Pointe-des-Monts 12h41 49.2780 -67.4099 295 A=51
B=51 +2 surface samples 13 17BC 11/07/20 Pointe-des-Monts 14h25 49.2951 -67.4266 218 A=32 B=33 +2 surface samples
12 18BC 11/07/20 Pointe-des-Monts 15h40 49.3043 -67.4234 170 A=27
B=25
+2 surface samples BCA : worm taken off at ~6cm from top
11 08VV 11/07/20 Pointe-des-Monts 16h56 49.3101 -67.4261 142 Bulk sample
41 19BC 11/07/20 Pointe-des-Monts 17h34 49.2842 -67.4224 200 A=45 B=46.5 +2 surface samples 16 20BC 12/07/20 Godbout 8h24 49.2523 -67.5063 258 A=52 B=52 2 layers of shells +2 surface samples 16 12GGC 0005 12/07/20 Godbout 17h40 49.2522 -67.5079 257 AB=150 BC=157 CD=94
27
18 21BC 12/07/20 Godbout 9h57 49.2798 -67.5360 190 Failed
18 09VV 12/07/20 Godbout 10h36 49.2800 -67.5365 188 Bulk sample
20 22BC 12/07/20 Godbout 12h55 49.3071 -67.5832 75 Failed
42 10VV 12/07/20 Godbout 13h52 49.3208 -67.5858 30 Bulk sample
43 11VV 12/07/20 Godbout 14h16 49.3228 -67.5895 30 Bulk sample
20 09GGC 12/07/20 Godbout 14h53 49.3017 -67.5852 90 Failed
20 10GGC 12/07/20 Godbout 15h25 49.3017 -67.5848 90 Failed
20-Jan 17GC 12/07/20 Godbout 15h54 49.3023 -67.5755 91 Failed
20-Jan 18GC 12/07/20 Godbout 16h11 49.3031 -67.5750 95 Failed
20-Feb 11GGC 12/07/20 Godbout 16h47 49.2999 -67.5697 143 Failed
29 12VV 13/07/20 Manicouagan 7h32 49.0728 -68.1379 60 Bulk sample
29 23BC 13/07/20 Manicouagan 7h52 49.0725 -68.1392 57 Only bulk sample
30 13VV 13/07/20 Manicouagan 8h51 49.0331 -68.0964 133 Bulk sample
30 24BC 13/07/20 Manicouagan 9h13 49.0364 -68.0968 119 A=25.5 B=24 +2 surface samples 31 25BC 0006 13/07/20 Manicouagan 10h48 49.0158 -68.0684 265 A=50.5 B=53 +2 surface samples 31 13GGC 0007 13/07/20 Manicouagan 11h39 49.0159 -68.0670 263 A˚B˚=21 AB=152 BC=128
A˚B˚= cutter + bag
44 14GGC 13/07/20 Manicouagan 12h57 49.0505 -68.1183 75 Failed 21 26BC 0008 13/07/20 Franquelin 15h34 49.2528 -67.7463 211 A=45 B=46 C=42 BCC : infiltrated water during pumping
+2 surface samples 21 15GGC 0009 13/07/20 Franquelin 16h30 49.2535 -67.7467 146 AB=150.5 BC=156 CD=151 21 19GC 13/07/20 Franquelin 16h55 49.2532 -67.7470 146 AB=163
32 14VV 14/07/20 Pointe-aux-Outardes 7h23 49.0160 -68.3874 95 Bulk sample
32 27BC 14/07/20 Pointe-aux-Outardes 7h47 49.0173 -68.3833 94 A=43
B=44.5 +2 surface samples
32 20GC 14/07/20 Pointe-aux-Outardes 8h14 49.0161 -68.3808 88 Failed
32 21GC 14/07/20 Pointe-aux-Outardes 8h22 49.0159 -68.3791 83 Failed
33 28BC 0010 14/07/20 Pointe-aux-Outardes 9h30 48.9867 -68.3507 135 A=52 B=55 +2 surface samples
45 29BC 14/07/20 Pointes-aux-Outardes 11h04 48.9436 -68.2971 336 Failed 45 30BC 14/07/20 Pointe-aux-Outardes 11h33 48.9444 -68.2969 335 A=36 B=34.5 Tilted sample +2 surface samples 33 16GGC 0011 14/07/20 Pointe-aux-Outardes 13h25 48.9855 -68.3503 134 A˚B˚ = 31 AB=100 BC=100 CD=104 DE=100 EF=101 FG=109 GH=10 A˚B˚ = cutter GH = mixed
28
37 15VV 14/07/20 Betsiamites 15h35 48.8786 -68.6006 126 Bulk sample
37 17GGC 0012 14/07/20 Betsiamites 16h06 48.8766 -68.5973 126 AB=100 BC=65 37 31BC 0013 14/07/20 Betsiamites 17h07 48.8778 -68.6006 126 A=51.5 B=51 +2 surface samples 36 32BC 14/07/20 Betsiamites 18h02 48.8378 -68.5625 254 A=53 B=54 +2 surface samples
29
Table A2: Summary of CTD stations
Station number COR2001 ID Date Location Time Latitude Longitude Water
depth (m) 35 01CTD 06-07-2020 Betsiamites 9h34 9h40 9h46 48.94 48.94 48.94 -68.55 -68.55 -68.56 100 34 02CTD 06-07-2020 Pointe-aux-Outardes 18h36 18h44 18h48 48.99 48.99 48.99 -68.46 -68.47 -68.47 128 23M 03CTD 07-07-2020 Baie-Comeau 12h46 12h52 12h57 49.12 49.12 49.12 -67.88 -67.88 -67.88 200 24 04CTD 07-07-2020 Baie-Comeau 16h10 16h16 16h19 49.17 49.17 49.17 -67.98 -67.99 -67.99 137 28 05CTD 08-07-2020 Baie-Comeau 7h11 7h15 7h17 49.25 49.25 49.25 -68.12 -68.12 -68.12 53 27 06CTD 08-07-2020 Baie-Comeau 12h38 12h42 12h44 49.22 49.22 49.22 -68.09 -68.09 -68.08 73 22 07CTD 08-07-2020 Franquelin 16h01 16h08 16h13 49.26 49.26 49.26 -67.84 -67.84 -67.84 136 1 08CTD 09-07-2020 Pointe-des-Monts 7h31 7h39 7h46 49.30 49.30 49.31 -67.39 -67.39 -67.39 176 3 09CTD 09-07-2020 Pointe-des-Monts 9h41 9h51 9h59 49.30 49.30 49.30 -67.38 -67.38 -67.38 256 5 10CTD 09-07-2020 Pointe-des-Monts 11h45 11h56 12h04 49.29 49.29 49.29 -67.37 -67.37 -67.37 289 05M 11CTD 10-07-2020 Pointe-des-Monts 7h09 7h19 7h28 49.29 49.28 49.28 -67.38 -67.38 -67.38 280 7 12CTD 10-07-2020 Pointe-des-Monts 12h25 12h30 12h40 49.28 49.28 49.28 -67.39 -67.39 -67.39 293 6 13CTD 10-07-2020 Pointe-des-Monts 15h19 15h28 15h36 49.29 49.29 49.29 -67.39 -67.39 -67.40 265 2 14CTD 10-07-2020 Pointe-des-Monts 16h50 16h57 17h01 49.31 49.31 49.30 -67.40 -67.40 -67.40 152 10-1 15CTD 11-07-2020 Pointe-des-Monts 7h08 49.30 -67.41 176
30 7h15 7h20 49.30 49.30 -67.42 -67.42 10-2 15CTD 11-07-2020 Pointe-des-Monts 7h26 7h33 7h38 49.30 49.30 49.30 -67.42 -67.42 -67.42 193 9 16CTD 11-07-2020 Pointe-des-Monts 8h51 9h00 9h06 49.30 49.30 49.29 -67.40 -67.41 -67.41 220 8 17CTD 11-07-2020 Pointe-des-Monts 10h48 10h58 11h06 49.28 49.28 49.28 -67.41 -67.41 -67.41 295 8 17CTD 11-07-2020 Pointe-des-Monts 11h14 11h22 11h31 49.28 49.28 49.28 -67.41 -67.41 -67.41 294 13 18CTD 11-07-2020 Pointe-des-Monts 13h32 13h38 13h44 49.30 49.29 49.29 -67.43 -67.43 -67.43 217 12 19CTD 11-07-2020 Pointe-des-Monts 15h03 15h10 15h14 49.30 49.30 49.30 -67.42 -67.42 -67.43 168 11 20CTD 11-07-2020 Pointe-des-Monts 16h22 16h26 16h30 49.31 49.31 49.31 -67.43 -67.43 -67.43 145 16 21CTD 12-07-2020 Godbout 7h48 7h59 8h00 49.25 49.25 49.25 -67.51 -67.51 -67.51 258 18 22CTD 12-07-2020 Godbout 9h19 9h29 9h30 49.28 49.28 49.28 -67.54 -67.54 -67.54 190 20 23CTD 12-07-2020 Godbout 11h43 11h50 11h52 49.31 49.31 49.31 -67.58 -67.58 -67.58 67 42 24CTD 12-07-2020 Godbout 13h33 13h38 13h40 49.32 49.32 49.32 -67.59 -67.59 -67.59 50 29 25CTD 13-07-2020 Manicouagan 7h12 7h15 7h18 49.07 49.07 49.07 -68.14 -68.14 -68.14 61 30 26CTD 13-07-2020 Manicouagan 8h33 8h38 8h42 49.04 49.04 49.03 -68.10 -68.10 -68.10 120 31 27CTD 13-07-2020 Manicouagan 9h58 10h06 10h14 49.02 49.02 49.01 -68.07 -68.07 -68.07 264 32 28CTD 14-07-2020 Pointe-aux-Outardes 7h06 7h10 7h14 49.02 49.02 49.02 -68.39 -68.39 -68.39 93
31 33 29CTD 14-07-2020 Pointe-aux-Outardes 9h08 9h13 9h17 48.99 48.99 48.98 -68.35 -68.35 -68.35 136 45 30CTD 14-07-2020 Betsiamites 10h29 10h38 10h48 48.94 48.94 48.94 -68.30 -68.30 -68.30 337 37 31CTD 14-07-2020 Betsiamites 15h12 15h19 15h24 48.88 48.88 48.88 -68.60 -68.60 -68.60 127
32
Table A3: Summary of plankton nets
Station number Identifier Date (d/m/y) Location Time (24hr, ET) (Surface/Bottom/Surface) Latitude (N) Longitude (W) Water depth (m) Net depth (m) 35 01PN 06-07-2020 Betsiamites 10h03 10h07 10h12 48.9465 48.9469 48.9475 -68.5545 -68.5553 -68.5549 102 90 34 02PN 06-07-2020 Pointe-aux-Outardes 18h55 19h02 19h06 48.9893 48.9892 48.9890 -68.4725 -68.4742 -68.4750 127 100 23M 03PN 07-07-2020 Baie-Comeau 12h57 13h09 13h12 49.1181 49.1179 49.1178 -67.8840 -67.8848 -67.8853 200 100 24 04PN 07-07-2020 Baie-Comeau 16h27 16h31 16h33 49.1645 49.1643 49.1640 -67.9886 -67.9896 -67.9904 135 100 28 05PN 08-07-2020 Baie-Comeau 7h28 7h30 7h31 49.2470 49.2471 49.2471 -68.1180 -68.1180 -68.1181 57 50 27 06PN 08-07-2020 Baie-Comeau 12h52 12h55 12h57 49.2225 49.2222 49.2220 -68.0864 -68.0860 -68.0857 72 65 22 07PN 08-07-2020 Franquelin 16h24 16h28 16h31 49.2601 49.2601 49.2601 -67.8360 -67.8375 -67.8385 136 100 1 08PN 09-07-2020 Pointe-des-Monts 7h55 7h59 8h02 49.3041 49.3041 49.3043 -67.3903 -67.3899 -67.3896 183 100 3 09PN 09-07-2020 Pointes-des-Monts 10h11 10h15 10h17 49.2962 49.2963 49.2961 -67.3813 -67.3808 -67.3802 252 100 5 10PN 09-07-2020 Pointe-des-Monts 12h55 12h58 13h00 49.2852 49.2853 49.2855 -67.3694 -67.3690 -67.3680 290 100 05M 11PN 10-07-2020 Pointe-des-Monts 7h35 7h38 7h41 49.2806 49.2798 49.2793 -67.3793 -67.3788 -67.3784 299 100 7 12PN 10-07-2020 Pointe-des-Monts 12h50 12h53 12h56 49.2842 49.2836 49.2831 -67.3886 -67.3891 -67.3892 290 100 6 13PN 10-07-2020 Pointe-des-Monts 15h45 15h48 15h51 49.2919 49.2914 49.2907 -67.3922 -67.3940 -67.3949 265 100 2 14PN 10-07-2020 Pointe-des-Monts 17h12 49.3064 -67.3975 145 100
33 17h16 17h18 49.3059 49.3058 -67.3994 -67.4011 10 15PN 11-07-2020 Pointe-des-Monts 7h52 7h55 7h58 49.3041 49.3039 49.3036 -67.4138 -67.4141 -67.4139 173 100 9 16PN 11-07-2020 Pointe-des-Monts 9h15 9h18 9h21 49.2979 49.2977 49.2974 -67.4083 -67.4138 -67.4140 207 100 8 17PN 11-07-2020 Pointe-des-Monts 11h40 11h43 11h46 49.2782 49.2779 49.2775 -67.4102 -67.4100 -67.4098 295 100 13 18PN 11-07-2020 Pointe-des-Monts 13h50 13h53 13h56 49.2942 49.2940 49.2937 -67.4273 -67.4276 -67.4277 223 100 12 19PN 11-07-2020 Pointe-des-Monts 15h21 15h24 15h27 49.3048 49.3047 49.3045 -67.4237 -67.4239 -67.4242 167 100 11 20PN 11-07-2020 Pointe-des-Monts 16h40 16h43 16h46 49.3102 49.3102 49.3101 -67.4245 -67.4252 -67.4259 141 100 18 21PN 12-07-2020 Godbout 9h38 9h42 9h44 49.2796 49.2798 49.2802 -67.5355 -67.5355 -67.5354 188 100 20 22PN 12-07-2020 Godbout 12h40 12h42 12h44 49.3071 49.3072 49.3072 -67.5828 -67.5827 -67.5826 77 70 42 23PN 12-07-2020 Godbout 13h44 13h45 13h47 49.3204 49.3206 49.3207 -67.5859 -67.5857 -67.5856 50 42 29 24PN 13-07-2020 Manicouagan 7h23 7h25 7h26 49.0723 49.0718 49.0720 -68.1379 -68.1378 -68.1376 61 55 31 25PN 13-07-2020 Manicouagan 10h18 49.0131 -68.0664 270 100
34
APPENDIX
B:
G
EOGRAPHIC LOCATIONS OF STATIONS35
36
37
38
39
40
APPENDIX
C:
S
TRATIGRAPHIC POSITIONS OF SEDIMENT CORESFigure C1: Approximate stratigraphic positions of cores COR2001-01BC and 01GC
41
Figure C3: Approximate stratigraphic positions of cores COR2001-04BC and 04GC
42
Figure C5: Approximate stratigraphic positions of cores COR2001-07GGC, 08BC, 08GGC, 10BC, 11BC, and 19BC
43
Figure C7: Approximate stratigraphic positions of cores COR2001-09BC and 12BC
44
Figure C9: Approximate stratigraphic positions of cores COR2001-13BC, 14BC and 18BC
45
Figure C11: Approximate stratigraphic position of core COR2001-23BC
46
APPENDIX
D:
CTD
PROFILES47
48
49
50
51
52
APPENDIX
E:
B
OX CORE PHOTOGRAPHS53
54