Science Arts & Métiers (SAM)
is an open access repository that collects the work of Arts et Métiers Institute of
Technology researchers and makes it freely available over the web where possible.
This is an author-deposited version published in: https://sam.ensam.eu Handle ID: .http://hdl.handle.net/10985/14019
To cite this version :
Iheb CHERIF, Théo DORLIN, Bertrand MARCON, Guillaume FROMENTIN, Habib KARAOUNI -Phenomenological study of chip flow/formation and unified cutting force modelling during Ti6Al4V alloy turning operations - Procedia CIRP - Vol. 77, p.351-354 - 2018
Any correspondence concerning this service should be sent to the repository Administrator : archiveouverte@ensam.eu
ScienceDirect
Available online at www.sciencedirect.com
Available online atwww.sciencedirect.com
ScienceDirect
Procedia CIRP 00 (2017) 000–000
www.elsevier.com/locate/procedia
2212-8271 © 2017 The Authors. Published by Elsevier B.V.
Peer-review under responsibility of the scientific committee of the 28th CIRP Design Conference 2018.
28th CIRP Design Conference, May 2018, Nantes, France
A new methodology to analyze the functional and physical architecture of
existing products for an assembly oriented product family identification
Paul Stief *, Jean-Yves Dantan, Alain Etienne, Ali Siadat
École Nationale Supérieure d’Arts et Métiers, Arts et Métiers ParisTech, LCFC EA 4495, 4 Rue Augustin Fresnel, Metz 57078, France * Corresponding author. Tel.: +33 3 87 37 54 30; E-mail address: paul.stief@ensam.eu
Abstract
In today’s business environment, the trend towards more product variety and customization is unbroken. Due to this development, the need of agile and reconfigurable production systems emerged to cope with various products and product families. To design and optimize production systems as well as to choose the optimal product matches, product analysis methods are needed. Indeed, most of the known methods aim to analyze a product or one product family on the physical level. Different product families, however, may differ largely in terms of the number and nature of components. This fact impedes an efficient comparison and choice of appropriate product family combinations for the production system. A new methodology is proposed to analyze existing products in view of their functional and physical architecture. The aim is to cluster these products in new assembly oriented product families for the optimization of existing assembly lines and the creation of future reconfigurable assembly systems. Based on Datum Flow Chain, the physical structure of the products is analyzed. Functional subassemblies are identified, and a functional analysis is performed. Moreover, a hybrid functional and physical architecture graph (HyFPAG) is the output which depicts the similarity between product families by providing design support to both, production system planners and product designers. An illustrative example of a nail-clipper is used to explain the proposed methodology. An industrial case study on two product families of steering columns of thyssenkrupp Presta France is then carried out to give a first industrial evaluation of the proposed approach.
© 2017 The Authors. Published by Elsevier B.V.
Peer-review under responsibility of the scientific committee of the 28th CIRP Design Conference 2018.
Keywords: Assembly; Design method; Family identification
1. Introduction
Due to the fast development in the domain of communication and an ongoing trend of digitization and digitalization, manufacturing enterprises are facing important challenges in today’s market environments: a continuing tendency towards reduction of product development times and shortened product lifecycles. In addition, there is an increasing demand of customization, being at the same time in a global competition with competitors all over the world. This trend, which is inducing the development from macro to micro markets, results in diminished lot sizes due to augmenting product varieties (high-volume to low-volume production) [1]. To cope with this augmenting variety as well as to be able to identify possible optimization potentials in the existing production system, it is important to have a precise knowledge
of the product range and characteristics manufactured and/or assembled in this system. In this context, the main challenge in modelling and analysis is now not only to cope with single products, a limited product range or existing product families, but also to be able to analyze and to compare products to define new product families. It can be observed that classical existing product families are regrouped in function of clients or features. However, assembly oriented product families are hardly to find. On the product family level, products differ mainly in two main characteristics: (i) the number of components and (ii) the type of components (e.g. mechanical, electrical, electronical).
Classical methodologies considering mainly single products or solitary, already existing product families analyze the product structure on a physical level (components level) which causes difficulties regarding an efficient definition and comparison of different product families. Addressing this
Procedia CIRP 77 (2018) 351–354
2212-8271 © 2018 The Authors. Published by Elsevier Ltd.
This is an open access article under the CC BY-NC-ND license (https://creativecommons.org/licenses/by-nc-nd/4.0/)
Selection and peer-review under responsibility of the International Scientific Committee of the 8th CIRP Conference on High Performance Cutting (HPC 2018).
10.1016/j.procir.2018.09.033
© 2018 The Authors. Published by Elsevier Ltd.
This is an open access article under the CC BY-NC-ND license (https://creativecommons.org/licenses/by-nc-nd/4.0/)
Selection and peer-review under responsibility of the International Scientific Committee of the 8th CIRP Conference on High Performance Cutting (HPC 2018).
Available online atwww.sciencedirect.com
ScienceDirect
Procedia CIRP 00 (2018) 000–000
www.elsevier.com/locate/procedia
2212-8271 © 2018 The Authors. Published by Elsevier Ltd. This is an open access article under the CC BY-NC-ND license (http://creativecommons.org/licenses/by-nc-nd/3.0/)
Peer-review under responsibility of the International Scientific Committee of the 8th CIRP Conference on High Performance Cutting (HPC 2018)..
8th CIRP Conference on High Performance Cutting (HPC 2018)
Phenomenological study of chip flow/formation and unified cutting force
modelling during Ti6Al4V alloy turning operations
Iheb Chérif
a, Théo Dorlin
a,b, Bertrand Marcon
a, Guillaume Fromentin
a*, Habib Karaouni
baArts et Metiers ParisTech, LaBoMaP, 71250 Cluny, France bSafran Tech, Research and Technology Center, 78117 Châteaufort, France
* Corresponding author. Tel.: +33-385-595-388; fax: +33-3858-595-370. E-mail address: guillaume.fromentin@ensam.eu
Abstract
Mechanistic approach for prediction of cutting forces are showing limits when it comes to enhance the cutting force modelling for specific applications of high-value added and thin parts, which are made of difficult-to-cut materials such as titanium alloys. This is the reason why precise cutting force modelling is needed in order to avoid deflection during machining. Therefore, this contribution aims to improve the description of the chip formation in cutting force modelling thanks to an original experimental set-up built up to observe in-situ the chip flow and measure the cutting forces during Ti6Al4V turning. This study highlights the fact that the chip flow direction has a significant effect on cutting forces and can be influenced by several parameters. In view of the results obtained, a generalised chip flow direction model is suggested. Chips morphology observation is also conducted with the purpose of providing experimental observations physical meaning. Afterwards, a cutting force model is proposed which takes into account the chip flow direction influence.
© 2018 The Authors. Published by Elsevier Ltd. This is an open access article under the CC BY-NC-ND license (http://creativecommons.org/licenses/by-nc-nd/3.0/)
Peer-review under responsibility of the International Scientific Committee of the 8th CIRP Conference on High Performance Cutting (HPC 2018).
Keywords: Cutting forces modelling, Chip flow, Chip morphology, In-process observation, Round tool
1. Introduction
The present study deals with the machining of turbojet drums; these parts, as most of the aeronautical parts, are requiring more and more sophisticated machining processes due to the complex geometries needed to achieve lighter parts made of “difficult-to-cut” materials like titanium alloys. Turbojet drums have high dimensions and thin thickness, which lead to variable cutting tool engagement and edge angle during long contour turning pass when using round tool insert. In order to minimize tool wear and high cutting forces issues responsible for the part deflection during machining, industries are looking for simulating solutions allowing to optimize them. Research investigations propose some modelling approaches in order to evaluate cutting forces [1]. Mechanistic approach [2] is under developments since decades because it is suitable for short time computation and
for easy model identification associated to quite precise prediction. The cutting forces are usually modelled using edge discretization methodology, generalised geometrical cutting model in constant enhancement [3], and specific scientific points are still debated. Cutting forces models are introducing ploughing effect to take into account the edge radius r [4]. Campocasso et al. exhibit a significant influence of the nose radius r on the cutting forces during turning operation [5]. The global chip flow direction has to be considered; thus, mechanical approaches [6-7], as mechanistic ones [8], propose their own formulation of it. This issue is closely linked to the cutting force segment dependency in the edge discretization methodology. Molinari et al. [6-7] define the contribution of the lateral stress into the chip induced by its flow onto the cutting forces. These lateral forces constrain all elementary chips to flow in the global direction of the chip.
Available online atwww.sciencedirect.com
ScienceDirect
Procedia CIRP 00 (2018) 000–000
www.elsevier.com/locate/procedia
2212-8271 © 2018 The Authors. Published by Elsevier Ltd. This is an open access article under the CC BY-NC-ND license (http://creativecommons.org/licenses/by-nc-nd/3.0/)
Peer-review under responsibility of the International Scientific Committee of the 8th CIRP Conference on High Performance Cutting (HPC 2018)..
8th CIRP Conference on High Performance Cutting (HPC 2018)
Phenomenological study of chip flow/formation and unified cutting force
modelling during Ti6Al4V alloy turning operations
Iheb Chérif
a, Théo Dorlin
a,b, Bertrand Marcon
a, Guillaume Fromentin
a*, Habib Karaouni
baArts et Metiers ParisTech, LaBoMaP, 71250 Cluny, France bSafran Tech, Research and Technology Center, 78117 Châteaufort, France
* Corresponding author. Tel.: +33-385-595-388; fax: +33-3858-595-370. E-mail address: guillaume.fromentin@ensam.eu
Abstract
Mechanistic approach for prediction of cutting forces are showing limits when it comes to enhance the cutting force modelling for specific applications of high-value added and thin parts, which are made of difficult-to-cut materials such as titanium alloys.This is the reason why precise cutting force modelling is needed in order to avoid deflection during machining. Therefore, this contribution aims to improve the description of the chip formation in cutting force modelling thanks to an original experimental set-up built up to observe in-situ the chip flow and measure the cutting forces during Ti6Al4V turning.This study highlights the fact that the chip flow direction has a significant effect on cutting forces and can be influenced by several parameters. In view of the results obtained, a generalised chip flow direction model is suggested. Chips morphology observation is also conducted with the purpose of providing experimental observations physical meaning. Afterwards, a cutting force model is proposed which takes into account the chip flow direction influence.
© 2018 The Authors. Published by Elsevier Ltd. This is an open access article under the CC BY-NC-ND license (http://creativecommons.org/licenses/by-nc-nd/3.0/)
Peer-review under responsibility of the International Scientific Committee of the 8th CIRP Conference on High Performance Cutting (HPC 2018).
Keywords: Cutting forces modelling, Chip flow, Chip morphology, In-process observation, Round tool
1. Introduction
The present study deals with the machining of turbojet drums; these parts, as most of the aeronautical parts, are requiring more and more sophisticated machining processes due to the complex geometries needed to achieve lighter parts made of “difficult-to-cut” materials like titanium alloys. Turbojet drums have high dimensions and thin thickness, which lead to variable cutting tool engagement and edge angle during long contour turning pass when using round tool insert. In order to minimize tool wear and high cutting forces issues responsible for the part deflection during machining, industries are looking for simulating solutions allowing to optimize them. Research investigations propose some modelling approaches in order to evaluate cutting forces [1]. Mechanistic approach [2] is under developments since decades because it is suitable for short time computation and
for easy model identification associated to quite precise prediction. The cutting forces are usually modelled using edge discretization methodology, generalised geometrical cutting model in constant enhancement [3], and specific scientific points are still debated. Cutting forces models are introducing ploughing effect to take into account the edge radius r [4]. Campocasso et al. exhibit a significant influence of the nose radius r on the cutting forces during turning operation [5]. The global chip flow direction has to be considered; thus, mechanical approaches [6-7], as mechanistic ones [8], propose their own formulation of it. This issue is closely linked to the cutting force segment dependency in the edge discretization methodology. Molinari et al. [6-7] define the contribution of the lateral stress into the chip induced by its flow onto the cutting forces. These lateral forces constrain all elementary chips to flow in the global direction of the chip.
352 Iheb Chérif et al. / Procedia CIRP 77 (2018) 351–354
2 Iheb Chérif / Procedia CIRP 00 (2018) 000–000
As consequence, it leads to the mechanistic formulation with the third force component on cutting edge segment [8-9] also allowing to consider different tool nose radii [9].
Nowadays, cutting forces models considering the chip flow direction are theoretical and without any experimental validation. Some recent research work as [10] are proposing a chip flow direction analytical model, validated through the tool wear observation on the rake face. Previous contribution [8] proposes a chip flow direction (ξc,global) formulation presented in Fig. 1, depending on the depth of cut (ap), based on Eq. 1. 2 1 , c global k k
a
p
= + (1) As a consequence, it is of major interest to check the validity of the models proposed depending on operational parameters. Therefore, this study aims to improve the cutting forces modelling by taking into account, in a very accurate way, the chip flow direction better than the global forces resultant direction. A phenomenological model of the chip flow direction is proposed based on experimental and instrumented observations during turning operations under different cutting conditions among depth of cut, and with different tool nose radii. Furthermore, chip morphology in relation with its flow direction is expertized.2. Methodology & experimental details
Cutting tests are realised on an instrumented NC 2-axis lathe. The workpiece material is Ti-6Al-4V titanium alloy, which hardness homogeneity has been verified. Four Seco Tools MDT round cutting insert are used r = (18 ± 7) µm with four different tool nose radii r {2.0, 2.5, 4.0, 5.0} mm for cylindrical turning, which are representative of a simple contour turning test. Those inserts are constituted of uncoated tungsten carbide and the four tools present the same cutting geometry which is constant along the cutting edge (n = 7 °; n = 7 °).
The depth of cut is set to three levels corresponding to a percentage of the different tool nose radii (10%, 50% or 90%). In order to maintain the same evolution range of chip thickness regardless the cut depth, the tests were conducted with two levels of maximum uncut chip thickness hmax = {0.1, 0.15} mm. To achieve this, the feed per revolution was calculated as a function of the nose radius and depth of cut values, with the geometrical Eq. 2 deduced from [3].
(
)
2(
)
2(
)
22
max
p p
f = r − r a− − r h− − r a− (2)
Cutting forces are collected thanks to a Kistler 9121 piezoelectric dynamometer. The chip flow direct observation during machining is conducted using a Basler aCA2000-165um CMOS monochrome imager mounted with a 35 mm lens and extension tubes, its sensor resolution is 2048 × 1088 square pixels, and the image acquisition is configured at 100 frames per second rate with a shutter settled at 10 ms. No specific illumination device was required out of the embedded NC light. The imager position is insured thanks to a self-designed support fixed on the VDI tool holder allowing to set the magnification, image clearness and to follow the tool movements during machining. The cutting trials are conducted without coolant for the chip observation and with a Blasocut 2000 CF emulsion for establishment of
the cutting forces modelling; no significant effect being revealed comparing cutting forces and resultant force orientation with or without coolant. The cutting speed (vC) is set to 90 m/min. Table 1 resumes the experimental trials parameters, for: the four tools, different cutting conditions, and the chip flow direction measured after postprocessing of the videos recorded during each machining.
Table 1. Experimental plan: chip flow direction dependency with cutting conditions at vC = 90 m/min (refer to Fig. 1b for parameters description).
N° r ap hmax f h,wt,ave ξc,global (mm) (mm) (mm) (mm/rev) (°) (°) 1 2.0 0.20 0.10 0.26 13.6 13.4 ± 1.0 2 2.0 0.20 0.15 0.44 11.3 10.7 ± 0.2 3 2.0 1.00 0.10 0.12 38.1 36.3 ± 0.2 4 2.0 1.00 0.15 0.18 37.4 36.7 ± 0.0 5 2.0 1.80 0.10 0.10 53.3 51.2 ± 0.2 6 2.0 1.80 0.15 0.15 52.9 50.8 ± 0.8 7 2.5 0.25 0.10 0.25 14.4 12.3 ± 1.7 8 2.5 0.25 0.15 0.41 12.8 10.0 ± 0.4 9 2.5 1.25 0.10 0.12 38.3 34.6 ± 0.6 10 2.5 1.25 0.15 0.18 37.8 33.8 ± 0.1 11 2.5 2.25 0.10 0.10 53.4 51.0 ± 0.0 12 2.5 2.25 0.15 0.15 53.2 50.3 ± 1.1 13 4.0 0.40 0.10 0.24 15.5 15.2 ± 0.7 14 4.0 0.40 0.15 0.38 14.6 18.0 ± 1.0 15 4.0 2.00 0.10 0.12 38.7 36.4 ± 1.0 16 4.0 2.00 0.15 0.17 38.4 37.0 ± 0.4 17 4.0 3.60 0.10 0.10 53.6 57.8 ± 2.2 18 4.0 3.60 0.15 0.15 53.5 54.7 ± 1.1 19 5.0 0.50 0.10 0.24 15.9 12.6 ± 1.0 20 5.0 0.50 0.15 0.37 15.2 15.1 ± 1.4 21 5.0 2.50 0.10 0.12 38.8 38.2 ± 0.3 22 5.0 2.50 0.15 0.17 38.5 36.9 ± 0.3 23 5.0 4.50 0.10 0.10 53.7 57.6 ± 0.5 24 5.0 4.50 0.15 0.15 53.6 54.9 ± 2.3
Examples of chip formation images obtained are presented in Fig. 1a for different cutting conditions. Chips after machining were collected for the different cutting conditions considered and for their examination. Further analysis demonstrates that the chip flow direction is not affected by wear neither lubrication. Complementary investigations in face turning demonstrate the validity of results obtained in cylindrical turning.
(a)
(b)
Fig. 1. (a) Cut area observation (hmax = 0.1 mm), (b) chip flow geometrical parameters and cut area, during cylindrical turning with round insert.
rε= 2 mm, ap= 1 mm rε= 5 mm, ap= 4.5 mm ap= 0.9 rɛ r Chip Machined surface Tool hmax0.1 Pr Zone II Zone I Ff Fp Fc θmin = ε θmax = ε ξc,θmax ξc,θmin Δθ = θmax - θmin ξc,global θh,wt,ave θFf ,Fp hmax0 .1 ap= 0.1 rɛ
Iheb Chérif / Procedia CIRP 00 (2018) 000–000 3
3. Analysis of chip flow direction & formation 3.1. Chip flow direction analysis and parameterization
From the videos recorded, several specific instants are chosen where the chip is not disturbing the observation and during a steady cutting forces state as for the pictures shown in Fig. 1a. Pictures iare then analyzed to extract averaged over the different pictures some chip geometrical descriptors as the maximum, minimum, and average chip direction angles, respectively noted as ξc,min, ξc,max, and ξc,global. Fig. 2 presents all results including the force resultant and passive force angles taken in the reference plane, as defined on Fig. 1a.
Fig. 2. Chip flow direction ξc,global compared to the angular limits of cut area
and the force resultant direction angle Ff,Fp.
A first observation underlines that, for any condition, the chip flow direction angle measured in-situ is always contained in the angular limits [min ; max] of the cut section, which make sense when considering there is no obliquity angle over the cutting edge. The Ff,Fp angle follows the ξc,global angle which represents the effective measured chip flow direction, nonetheless it exists a slight difference between these angles. This difference can be explained by the fact that the force resultant angle includes also the edge effect and not only the cut effect; the latter being linked to the chip flow.
Fig. 2 also shows that the chip flow direction is mostly affected by the depth of cut ap for any nose radius r, and seems to not depend on the feed value. The evaluation of
ξc,global is analyzed on Fig. 3 as a function of the ap/r ratio for both maximum cut thicknesses. It demonstrates a rather linear relation of the chip flow angle with the proposed ratio.
Fig. 3. Global chip flow direction considering 4 nose radii for: (a) hmax = 0.10 mm, and (b) hmax = 0.15 mm.
The cutting geometry being constant all along the tool edge with no inclination angle, a new geometrical criterion is proposed to predict the chip flow direction. Eq. 3 defines
h,wt,ave, the average orientation angle weighted by the cut thickness. It is computed using the exact analytical
formulations of the cut thickness h defined in [3], and considering the circle to circle distance (zone I), and the circle to line distance (zone II), both pictured in Fig. 1b. The zone II cannot be neglected for low depth of cut and high feed, as shows the cut area in Fig. 2 (ap = 0.1 × r). Table 1 and Fig. 2, demonstrate that h,wt,ave geometrical criterion predicts very well the measured values of ξc,global angle; the absolute mean
error is around 2°, and 4° in maximum.
max max , ,
( ). .
( ).
min min h wt aveh
d
h
d
=
(3)These investigations are completed by the analysis of the chip morphologies presented in Fig. 4. Tubular chips are produced, with a pitch which is as smaller as ap/r ratio, in relation with low ξc,global angle.
Fig. 4. Morphology of chips generated during Ti6Al4V cylindrical turning with round insert (images with different magnifications).
Two chip geometrical criteria are characterized and exposed on Fig. 5: the tubular chip diameter (dc), and the width of chip torn zone (wt). Regarding dc, it appears an homothetic relation and the ratio (dc/(ap/r)) decreases with the (ap/r) ratio. As a first rough approach, a linear regression is proposed to define these relationships, cf. Fig. 5a. As shown in Fig. 5b, for ap > 0.1 × r, the chip is torn on the thinner side, i.e. where the cut thickness is lower and more brittle. On one hand, it is assumed that internal stress into the chip along the cutting edge is resulting from the cut thickness variation along the cutting edge itself. On the other hand, this stress is balanced by the tool nose radius which allows the chip to curve.
Fig. 5. Chip characterization: dc chip diameter (a), wt width of
chip torn zone (b) 4. Unified cutting force modelling 4.1. Chip flow modelling and identification
Chip flow direction angle observations sustain the Eq. 1 connecting the global chip flow direction angle and the depth of cut. However, this simple modelling can be improved in order to extend its application validity domain for different nose radii as Eq. 4 based on Fig. 3 observations.
-10 0 10 20 30 40 50 60 70 80 90 0 5 10 15 20 25 An gl e ( °) Test number
θ
Ff ,Fpξ
c,global measuredθ
maxθ
min ap ap ap apθ
h,wt,ave rε= 2 mm rε= 2.5 mm rε= 4 mm rε= 5 mm 0 10 20 30 40 50 60 70 0.1 0.5 0.9 c,g lob al (° ) ap/rε(mm) hmax= 0.1 mm 0 10 20 30 40 50 60 70 0.1 0.5 0.9 c,g lob al (° ) ap/rε(mm) hmax= 0.15 mm rε= 2 mm rε= 2.5 mm rε= 4 mm rε= 5 mm rε= 2 mm rε= 2.5 mm rε= 4 mm rε= 5 mm (a) (b) ε ε ε ε ε ε ε 0 15 30 45 60 0.1 0.5 0.9 dc /( ap /rε ) (mm) ap/rε 0 1 2 3 4 5 6 0.1 0.5 0.9 wt /( ap /rε ) (mm) ap/rε 0 15 30 45 60 0.1 0.5 0.9 dc /( ap /rε ) (mm) ap/rε 0 1 2 3 4 5 6 0.1 0.5 0.9 wt /( ap /rε ) (mm) ap/rε rε= 2 mm rε= 2.5 mm rε= 4 mm rε= 5 mm (a) (b)w
tIheb Chérif et al. / Procedia CIRP 77 (2018) 351–354 353
2 Iheb Chérif / Procedia CIRP 00 (2018) 000–000
As consequence, it leads to the mechanistic formulation with the third force component on cutting edge segment [8-9] also allowing to consider different tool nose radii [9].
Nowadays, cutting forces models considering the chip flow direction are theoretical and without any experimental validation. Some recent research work as [10] are proposing a chip flow direction analytical model, validated through the tool wear observation on the rake face. Previous contribution [8] proposes a chip flow direction (ξc,global) formulation presented in Fig. 1, depending on the depth of cut (ap), based on Eq. 1. 2 1 , c global k k
a
p
= + (1) As a consequence, it is of major interest to check the validity of the models proposed depending on operational parameters. Therefore, this study aims to improve the cutting forces modelling by taking into account, in a very accurate way, the chip flow direction better than the global forces resultant direction. A phenomenological model of the chip flow direction is proposed based on experimental and instrumented observations during turning operations under different cutting conditions among depth of cut, and with different tool nose radii. Furthermore, chip morphology in relation with its flow direction is expertized.2. Methodology & experimental details
Cutting tests are realised on an instrumented NC 2-axis lathe. The workpiece material is Ti-6Al-4V titanium alloy, which hardness homogeneity has been verified. Four Seco Tools MDT round cutting insert are used r = (18 ± 7) µm with four different tool nose radii r {2.0, 2.5, 4.0, 5.0} mm for cylindrical turning, which are representative of a simple contour turning test. Those inserts are constituted of uncoated tungsten carbide and the four tools present the same cutting geometry which is constant along the cutting edge (n = 7 °; n = 7 °).
The depth of cut is set to three levels corresponding to a percentage of the different tool nose radii (10%, 50% or 90%). In order to maintain the same evolution range of chip thickness regardless the cut depth, the tests were conducted with two levels of maximum uncut chip thickness hmax = {0.1, 0.15} mm. To achieve this, the feed per revolution was calculated as a function of the nose radius and depth of cut values, with the geometrical Eq. 2 deduced from [3].
(
)
2(
)
2(
)
22
max
p p
f = r − r a− − r h− − r a− (2)
Cutting forces are collected thanks to a Kistler 9121 piezoelectric dynamometer. The chip flow direct observation during machining is conducted using a Basler aCA2000-165um CMOS monochrome imager mounted with a 35 mm lens and extension tubes, its sensor resolution is 2048 × 1088 square pixels, and the image acquisition is configured at 100 frames per second rate with a shutter settled at 10 ms. No specific illumination device was required out of the embedded NC light. The imager position is insured thanks to a self-designed support fixed on the VDI tool holder allowing to set the magnification, image clearness and to follow the tool movements during machining. The cutting trials are conducted without coolant for the chip observation and with a Blasocut 2000 CF emulsion for establishment of
the cutting forces modelling; no significant effect being revealed comparing cutting forces and resultant force orientation with or without coolant. The cutting speed (vC) is set to 90 m/min. Table 1 resumes the experimental trials parameters, for: the four tools, different cutting conditions, and the chip flow direction measured after postprocessing of the videos recorded during each machining.
Table 1. Experimental plan: chip flow direction dependency with cutting conditions at vC = 90 m/min (refer to Fig. 1b for parameters description).
N° r ap hmax f h,wt,ave ξc,global (mm) (mm) (mm) (mm/rev) (°) (°) 1 2.0 0.20 0.10 0.26 13.6 13.4 ± 1.0 2 2.0 0.20 0.15 0.44 11.3 10.7 ± 0.2 3 2.0 1.00 0.10 0.12 38.1 36.3 ± 0.2 4 2.0 1.00 0.15 0.18 37.4 36.7 ± 0.0 5 2.0 1.80 0.10 0.10 53.3 51.2 ± 0.2 6 2.0 1.80 0.15 0.15 52.9 50.8 ± 0.8 7 2.5 0.25 0.10 0.25 14.4 12.3 ± 1.7 8 2.5 0.25 0.15 0.41 12.8 10.0 ± 0.4 9 2.5 1.25 0.10 0.12 38.3 34.6 ± 0.6 10 2.5 1.25 0.15 0.18 37.8 33.8 ± 0.1 11 2.5 2.25 0.10 0.10 53.4 51.0 ± 0.0 12 2.5 2.25 0.15 0.15 53.2 50.3 ± 1.1 13 4.0 0.40 0.10 0.24 15.5 15.2 ± 0.7 14 4.0 0.40 0.15 0.38 14.6 18.0 ± 1.0 15 4.0 2.00 0.10 0.12 38.7 36.4 ± 1.0 16 4.0 2.00 0.15 0.17 38.4 37.0 ± 0.4 17 4.0 3.60 0.10 0.10 53.6 57.8 ± 2.2 18 4.0 3.60 0.15 0.15 53.5 54.7 ± 1.1 19 5.0 0.50 0.10 0.24 15.9 12.6 ± 1.0 20 5.0 0.50 0.15 0.37 15.2 15.1 ± 1.4 21 5.0 2.50 0.10 0.12 38.8 38.2 ± 0.3 22 5.0 2.50 0.15 0.17 38.5 36.9 ± 0.3 23 5.0 4.50 0.10 0.10 53.7 57.6 ± 0.5 24 5.0 4.50 0.15 0.15 53.6 54.9 ± 2.3
Examples of chip formation images obtained are presented in Fig. 1a for different cutting conditions. Chips after machining were collected for the different cutting conditions considered and for their examination. Further analysis demonstrates that the chip flow direction is not affected by wear neither lubrication. Complementary investigations in face turning demonstrate the validity of results obtained in cylindrical turning.
(a)
(b)
Fig. 1. (a) Cut area observation (hmax = 0.1 mm), (b) chip flow geometrical parameters and cut area, during cylindrical turning with round insert.
rε= 2 mm, ap= 1 mm rε= 5 mm, ap= 4.5 mm ap= 0.9 rɛ r Chip Machined surface Tool hmax0.1 Pr Zone II Zone I Ff Fp Fc θmin = ε θmax = ε ξc,θmax ξc,θmin Δθ = θmax - θmin ξc,global θh,wt,ave θFf ,Fp hmax0 .1 ap= 0.1 rɛ
Iheb Chérif / Procedia CIRP 00 (2018) 000–000 3
3. Analysis of chip flow direction & formation 3.1. Chip flow direction analysis and parameterization
From the videos recorded, several specific instants are chosen where the chip is not disturbing the observation and during a steady cutting forces state as for the pictures shown in Fig. 1a. Pictures iare then analyzed to extract averaged over the different pictures some chip geometrical descriptors as the maximum, minimum, and average chip direction angles, respectively noted as ξc,min, ξc,max, and ξc,global. Fig. 2 presents all results including the force resultant and passive force angles taken in the reference plane, as defined on Fig. 1a.
Fig. 2. Chip flow direction ξc,global compared to the angular limits of cut area
and the force resultant direction angle Ff,Fp.
A first observation underlines that, for any condition, the chip flow direction angle measured in-situ is always contained in the angular limits [min ; max] of the cut section, which make sense when considering there is no obliquity angle over the cutting edge. The Ff,Fp angle follows the ξc,global angle which represents the effective measured chip flow direction, nonetheless it exists a slight difference between these angles. This difference can be explained by the fact that the force resultant angle includes also the edge effect and not only the cut effect; the latter being linked to the chip flow.
Fig. 2 also shows that the chip flow direction is mostly affected by the depth of cut ap for any nose radius r, and seems to not depend on the feed value. The evaluation of
ξc,global is analyzed on Fig. 3 as a function of the ap/r ratio for both maximum cut thicknesses. It demonstrates a rather linear relation of the chip flow angle with the proposed ratio.
Fig. 3. Global chip flow direction considering 4 nose radii for: (a) hmax = 0.10 mm, and (b) hmax = 0.15 mm.
The cutting geometry being constant all along the tool edge with no inclination angle, a new geometrical criterion is proposed to predict the chip flow direction. Eq. 3 defines
h,wt,ave, the average orientation angle weighted by the cut thickness. It is computed using the exact analytical
formulations of the cut thickness h defined in [3], and considering the circle to circle distance (zone I), and the circle to line distance (zone II), both pictured in Fig. 1b. The zone II cannot be neglected for low depth of cut and high feed, as shows the cut area in Fig. 2 (ap = 0.1 × r). Table 1 and Fig. 2, demonstrate that h,wt,ave geometrical criterion predicts very well the measured values of ξc,global angle; the absolute mean
error is around 2°, and 4° in maximum.
max max , ,
( ). .
( ).
min min h wt aveh
d
h
d
=
(3)These investigations are completed by the analysis of the chip morphologies presented in Fig. 4. Tubular chips are produced, with a pitch which is as smaller as ap/r ratio, in relation with low ξc,global angle.
Fig. 4. Morphology of chips generated during Ti6Al4V cylindrical turning with round insert (images with different magnifications).
Two chip geometrical criteria are characterized and exposed on Fig. 5: the tubular chip diameter (dc), and the width of chip torn zone (wt). Regarding dc, it appears an homothetic relation and the ratio (dc/(ap/r)) decreases with the (ap/r) ratio. As a first rough approach, a linear regression is proposed to define these relationships, cf. Fig. 5a. As shown in Fig. 5b, for ap > 0.1 × r, the chip is torn on the thinner side, i.e. where the cut thickness is lower and more brittle. On one hand, it is assumed that internal stress into the chip along the cutting edge is resulting from the cut thickness variation along the cutting edge itself. On the other hand, this stress is balanced by the tool nose radius which allows the chip to curve.
Fig. 5. Chip characterization: dc chip diameter (a), wt width of
chip torn zone (b) 4. Unified cutting force modelling 4.1. Chip flow modelling and identification
Chip flow direction angle observations sustain the Eq. 1 connecting the global chip flow direction angle and the depth of cut. However, this simple modelling can be improved in order to extend its application validity domain for different nose radii as Eq. 4 based on Fig. 3 observations.
-10 0 10 20 30 40 50 60 70 80 90 0 5 10 15 20 25 An gl e ( °) Test number
θ
Ff ,Fpξ
c,global measuredθ
maxθ
min ap ap ap apθ
h,wt,ave rε= 2 mm rε= 2.5 mm rε= 4 mm rε= 5 mm 0 10 20 30 40 50 60 70 0.1 0.5 0.9 c,g lob al (° ) ap/rε(mm) hmax= 0.1 mm 0 10 20 30 40 50 60 70 0.1 0.5 0.9 c,g lob al (° ) ap/rε(mm) hmax= 0.15 mm rε= 2 mm rε= 2.5 mm rε= 4 mm rε= 5 mm rε= 2 mm rε= 2.5 mm rε= 4 mm rε= 5 mm (a) (b) ε ε ε ε ε ε ε 0 15 30 45 60 0.1 0.5 0.9 dc /( ap /rε ) (mm) ap/rε 0 1 2 3 4 5 6 0.1 0.5 0.9 wt /( ap /rε ) (mm) ap/rε 0 15 30 45 60 0.1 0.5 0.9 dc /( ap /rε ) (mm) ap/rε 0 1 2 3 4 5 6 0.1 0.5 0.9 wt /( ap /rε ) (mm) ap/rε rε= 2 mm rε= 2.5 mm rε= 4 mm rε= 5 mm (a) (b)w
t354 Iheb Chérif et al. / Procedia CIRP 77 (2018) 351–354
4 Iheb Chérif / Procedia CIRP 00 (2018) 000–000
, ,2 ,3 p c global o ko a k r = + (4)
After ko,2 and ko,3 coefficients identification, it appears that the absolute mean error is around 2°, and 5° in maximum which is very near to the precision of prediction obtained with
h,wt,ave angle.
4.2. Cutting forces modelling with chip flow integration
The cutting edge discretization method is used combined with a cutting force mechanistic modelling approach and considering the chip flow direction. Fig. 6 presents the local force component on the jth segment of the discretized cutting
edge. The cut effect and the edge one induce the local forces {fv,j ; fh,j} modelled with a common Armarejo’s law [2] as described by Eq. 5. This force contribution does not provoke any force into edge segment direction.
, , ,
edge effect cut effect
i j e i c i hj
f = k +k (5) with i {v;h} = force components and j = segment index.
Fig. 6. Sketch of local force components {fv; fh; fo} direction adapted from [8].
Additional considerations are taking into account to enhance this model. There is one global chip flow direction, consequently it exists a 3rd force component, named fo, on jth
segment, linked to the side stress on the elementary chip, which imposed the flow direction. The appearance of this stress is also demonstrated by the chip morphology with torn zones (Fig. 5b). Then, the fo force component has to consider the shift between the segment orientation and the flow direction, and depends on the cut thickness. As a result, it is proposed the formulation expressed by Eq. 6 and Eq. 7.
-, , ,
c jlocal c global seg jlocal
= (6)
, ,1 ,
o j ko c jlocal hj
f = (7)
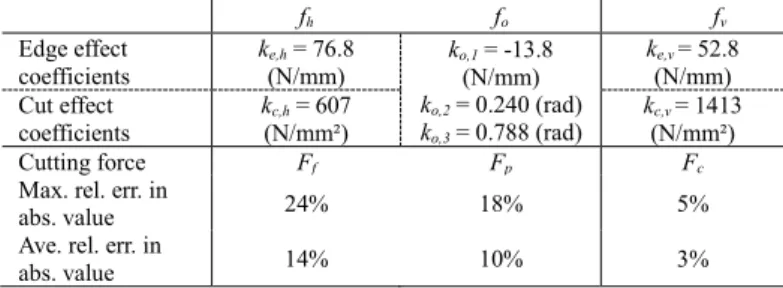
Table 2. Inverse identification results with enhanced mechanistic model.
fh fo v Edge effect coefficients k(N/mm) e,h = 76.8 k , (N/mm) = -13.8 k , = 0.240 (rad) k ,3 = 0.788 (rad) ke,v = 52.8 (N/mm) Cut effect coefficients k(N/mm²) ,h = 607 k(N/mm²) ,v = 1413 Cutting force Ff Fp Fc
Max. rel. err. in
abs. value 24% 18% 5%
Ave. rel. err. in
abs. value 14% 10% 3%
The global forces {Fc ; Ff ; Fp} are computed from the projection and the local force summation on any segment as practiced in [8]. The model inverse identification is achieved for each test, excepted the one with a tool nose radius
r = 2 mm because of a miss setting of the charge amplifier; Table 2 presents the results. The average relative error in
absolute is lower than 10% for all cutting force components; nonetheless for given conditions as points the maximum relative error value, the model is not always so highly accurate. Improvements of this model are possible because both the internal chip force and the chip flow direction into Pr plane were condisered. New enhancement could be brought using a finer approach based on local rake face referential.
5. Conclusion
This study brings new outcomes for cutting modelization useful for industry to improve the prediction especially required to machine fine parts that can deform during manufacturing. It is proposed a characterization and a phenomenological model of the chip formation/flow together with a cutting force modelling in turning of titanium alloy with round insert. The method is based on innovative experimental in-situ observation and brings enhanced phenomenological model of the global chip flow direction (ξc,global) in a large range of validity with consideration of 4 nose radii and small to large depth of cut. Furthermore, this study proposes h,wt,ave as a geometrical parameter to predict the chip flow direction.
The chip morphology and the appearance of torn zone demonstrate the presence of internal stresses. As consequence, effect of the tool nose radius and the dependence of edge segment in discretization method have to be considered to improve the force models and to reproduce accurately the global chip flow direction.
Further work would improve the physical understanding of the chip internal stresses, torn zone, and its curvature in Pr
reference plane in relation with the tool nose radius and the cut thickness variation along the cutting edge.
References
[1] Arrazola PJ, Özel T, Umbrello D, Davies M, Jawahir IS. Recent advances in modelling of metal machining processes. CIRP Ann Manuf Technol 2013; 62(2):695-718.
[2] Armarego EJA, Whitfield RC. Computer Based Modellign of Popular Machining Operations for Force and Power Prediction. CIRP Ann Manuf Technol 1985;34(1):65-69.
[3] Campocasso S, Costes JP, Fromentin G, Bissey-Breton S, Poulachon G. A generalised geometrical model of turning operations for cutting force modelling using edgediscretisation. Appl Math Model 2015; 39(21) [4] Wyen CF and Wegener K. Influence of cutting edge radius on cutting
forces in machining titanium. CIRP Ann Manuf Technol 2010; 59(1) [5] Campocasso S, Poulachon G, Costes JP, Bissey-Breton S. 2014, An
innovative experimental study of corner radius effect on cutting forces. CIRP Ann Manuf Technol 2014; 63(1):121-124.
[6] Molinari A, Moufki A. 2005, A new thermomechanical model of cutting applied to turning operations. Part I. Theory. Int J Mach Tools Manuf 2005; 45(2):166-180.
[7] Moufki A, Molinari A. A new thermomechanical model of cutting applied to turning operations. Part II. Parametric study. Int J Mach Tools Manuf 2005; 45(2):181-193.
[8] Dorlin T, Fromentin G, Costes JP. Generalised cutting force model including contact radius effect for turning operations on Ti6Al4V titanium alloy. Int J Adv Manuf Technol 2016; 86(9): 3297-3313.
[9] Dorlin T, Fromentin G, Costes JP, Karaouni H. Mechanistic cutting force model including the stress state induced by the chip flow contribution for cylindrical turning on Ti6Al4V alloy with two different nose radii. In. Proc. of the 8th Int. Conf. on High Speed Machining; 2016. Metz, France. [10] D'Acunto A., Le Coz G., Moufki A., Dudzinski D. Effect of Cutting
Edge Geometry on Chip Flow Direction-Analytical Modelling and Experimental Validation. In. Procedia CIRP 2017; 58:353-3
ap max min seg,j local c,global c,j local Workpiece jseg Global flow direction Pr