Technology researchers and makes it freely available over the web where possible.
This is an author-deposited version published in: https://sam.ensam.eu Handle ID: .http://hdl.handle.net/10985/12940
To cite this version :
Raphaël MOULART, René ROTINAT - Elasto-plastic strain field measurement at micro-scale on 316L stainless steel - In: Congrès Français de Mécanique, France, 2013-08-26 - Congrès Français de Mécanique - 2013
1
Elasto-plastic strain field measurement at micro-scale on 316L
stainless steel
R. MOULART, R. ROTINAT
Mechanics Surfaces and Materials Processing Laboratory (MSMP), Rue Saint Dominique – B.P. 508, 51006 CHÂLONS-EN-CHAMPAGNE CEDEX (France)
Résumé :
Cette étude traite de la caractérisation du comportement mécanique d’un acier inoxydable austénitique (316L) à l’échelle micrométrique. Pour cela, la méthode de grille a été adaptée à cette échelle. Les grilles de pas d’environ 5 µm sont obtenues par photolithographie interférentielle sur une résine photosensible préalablement déposée à la surface de l’échantillon. L’éprouvette est soumise à une traction par paliers de chargement permettant ainsi la numérisation des grilles à l’aide d’un microscope interférométrique en lumière blanche pour chaque pas de chargement. Ces images ont ensuite été traitées pour en extraire le champ de déformations plan (résolution inférieure à 2×10⁻³ pour une résolution spatiale de 20 µm). Ces déformations ont alors rendu compte de localisations des déformations compatibles avec les frontières des grains. Une tentative de détection de l’initiation de la plasticité locale a ensuite été mise en œuvre : à partir des courbes contraintes-déformations moyennes par grain, il est possible de définir une valeur de limite élastique σY (à 0,02 % par exemple) locale. Il a alors été constaté que ces valeurs de σY locales ainsi déterminées peuvent varier de +/- 20 MPa autour de la valeur macroscopique (180 MPa).
Mots clefs :
méthode de grille, échelle micrométrique, élasto-plasticité, acier 316LAbstract:
This study deals with the characterisation of the mechanical behaviour of an austenitic stainless steel (316L) at the micrometric scale in its elasto-plastic domain. For that, the full-field “grid method”, adapted to this scale, is implemented. The direct interferometric photolithography is used here to produce gratings (the pitch is approximately 5 µm) on specimen surface. The gratings are digitized at every step of the tensile loading thanks to a white-light interferometric microscope. The in-plan strain fields are then deduced from these grating images (resolution is closed to 2×10⁻³ for a spatial resolution of about 20 µm). The results show that the strain localisation is in accordance with the microstructure. Some considerations about the average strain within different grains of the steel sample are made to show how the plastic deformation begins locally before the global yield point σY. It was then observed that these local σY values thus determined may vary by +/-20 MPa around the macroscopic value (180 MPa).
Key words:
grid method, micrometric scale, elasto-plastic behavior, stainless steel1 Introduction
To be able to precisely predict the global mechanical behaviour of a material, it is necessary to understand the physical phenomena taking place at the scale of its heterogeneities. Indeed, once the local mechanical behaviour is known, it is possible to deduce the overall properties via homogenisation schemes [1]. However, the experimental determination of the local behaviour still remains challenging as the classical experimental procedures are not robust anymore at a reduced scale. Consequently, the development of quantitative displacement and strain field measurement techniques at this scale is an important field that very much remains an open problem. Only a few papers can be found in the literature. Some works studied the plastic behaviour of an aluminium alloy under tensile test from moiré interferometry [2-3] with a region of interest ranging from a few square millimetres to centimetres. The author managed to put in evidence the heterogeneous nature of the plastic strains due to the microstructure of the sample. More recently the
2
digital image correlation (DIC) technique is also applied to study titanium alloy [4] with SEM images. Another interesting studies couple full-field strain measurements (using DIC with a scanning electronic microscope) with grain orientations through EBSD [5-6].
The present paper uses an original alternative to the above technique, with the hope to reach the right compromise between resolution and spatial resolution to study the transition between elastic and local microplastic behaviour. In this context, this work is aimed at characterising an austenitic stainless steel sample (FCC crystal system) under tensile loading at the scale of its grains in its elasto-plastic domain. This is done by applying the experimental procedure initially developed in the study of a ferritic steel [7-8]. This methodology is shortly recalled before introducing the results on the stainless steel sample.
2 Methodology
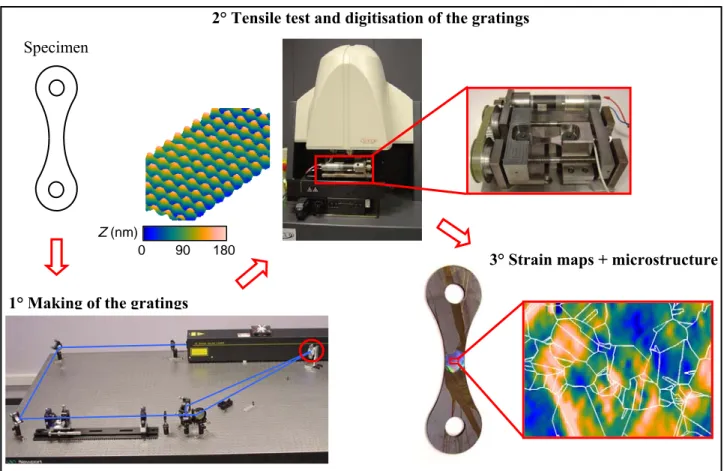
The micro-extensometric method used here has been previously developed [7-8]. It is based on the so-called “grid method” [9] which consists in analyzing the deformation of a periodic pattern deposited onto the surface to study by a spatial phase stepping algorithm here fitted to a micrometric scale. The overall procedure is schematically summarized in figure 1 and recalled hereafter.
FIG. 1 – Schematic summary of the experimental micro-scale full-field strain measurement procedure First of all, the samples are prepared: they are cut from a laminated plate of the studied stainless steel, then submitted to a recrystallization tempering heat treatment (to get bigger and equiaxed grains) and finally polished.
Cross-gratings (pitch: 5 µm) are then produced at the surface of the specimen by direct interferometric photolithography. This technique consists in recording the parallel interference fringes of two collimated laser beams on a photoresist layer spread onto the surface to study. Thus, the pitch can easily be adjusted depending only on the wavelength of the light and the angle between the two incident beams interfering on the sample. In order to obtain cross gratings (so as to have access to both components of the in-plane displacement), the process is simply repeated after rotating the sample by 90° (first step on figure 1). The deformation of the photoresist is assumed to follow exactly the one of the underlying substrate.
Then, the samples can be submitted to a tensile test thanks to a small home-made mini tensile machine. Its kinematic chain has been designed to be symmetrical with two mobile cross-heads in order to avoid as much
Z (nm)
0 90 180
1° Making of the gratings
2° Tensile test and digitisation of the gratings
3° Strain maps + microstructure Specimen
3
as possible the rigid body motion in the middle part of the sample. The gratings on the region of interest are digitized in-situ at every step of the loading with a white-light interferometric microscope. Based on short length coherence interferences concepts, it allows to digitize the 3D profile of a sample with a subnanometric resolution in the vertical direction and with a spatial resolution limited by the diffraction limit (second step on figure 1). In practice, pitches down to 2 µm can be used. It is important to note that the surface must also be reasonably reflective to use such a microscope. Another important feature is the fact that the measured profile depends solely on the internal distance in the lens between a semi-transparent lens and the imaging plane. Therefore, not only will the out-of-plane displacements be recorded at the same time as the in-plane ones, but the latter will be independent from the former. This is one of the main advantages of this procedure compared to optical microscopy where the very low depth of field is clearly a problem [10].
The profile images of the grating are then computed by the “grid method”, based on a windowed spatial phase shifting algorithm [9]. Indeed, considering the sample grating as a periodic signal, it is possible to compute the phase value of this signal for each period, leading to the displacement maps [7]. In this way, the spatial resolution of displacement is equal to the pitch of the grating These maps undergo a 2×2 “stitching” operation in order to enlarge the field of view (finally equal to 450×340 µm²).
From these fields and to get access to mechanical parameters, strain fields have to be calculated. For that, and considering that experimental data are noisy, it is necessary to use an appropriate smoothing procedure. Here, it has been chosen to use a diffuse approximation (DA) scheme [11-12]. DA is based on local weighted least-squares minimization using a polynomial diffuse approximation. It has shown that concerning the choice of the polynomial degree, the best compromise is 2 [13].The DA approach is powerful technique which provides stable results but is also a time consuming technique. The strain resolution is deduced from the displacement resolution. For a full-field measurement method, the latter is often considered to be the standard deviation of the noise. By applying a smoothing/differentiation algorithm to the noise maps, it is possible to determine the strain resolution as the standard deviation of the generated ‘‘noisy-strain” maps [14].
Finally, the observed microstructure of the region of interest is plotted on the strain maps to allow a comparison between it and the localizations of strain components. With this approach, it has been shown that the local strain resolution is inferior to 2×10⁻³ for a spatial resolution of 20 µm [8]. It has to be compared to the average size of a grain (≈ 100×100 µm²).
3 Results and discussion
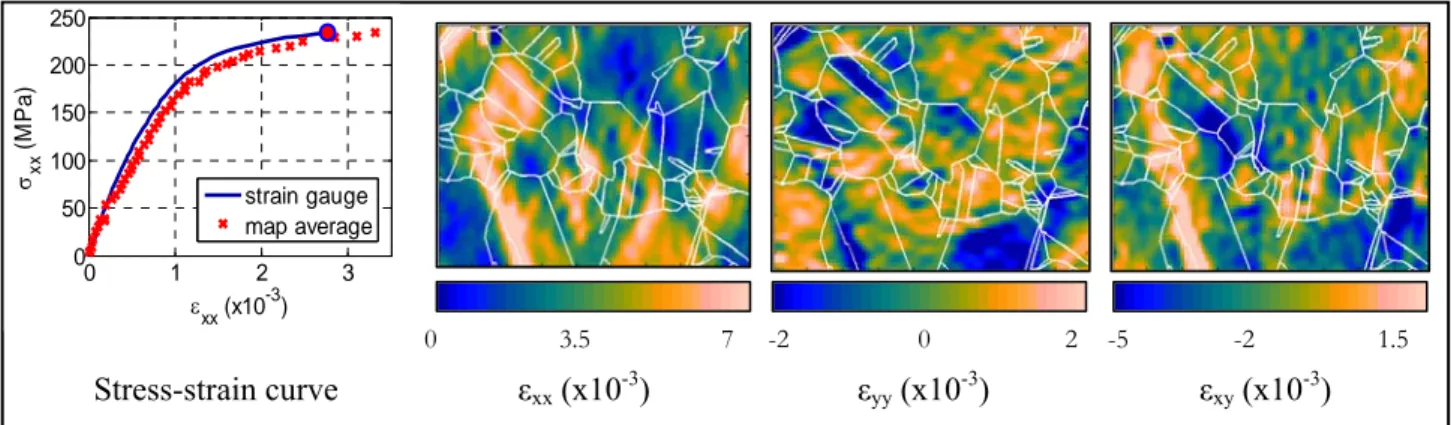
The mechanical test performed on the stainless steel sample has consisted in a 52 load steps tensile test. Fig. 2 shows the stress-strain curves obtained from both a gauge glued onto the back side of the sample and an averaging of the εxx maps on the whole surface of the region of interest. It also shows the three in-plane strain maps for the last stage of loading, once the material has reached its overall elasto-plastic domain.
FIG. 2 – Micro-extensometric results for the last step of loading From this figure, two main remarks can be made:
The two stress-strain curves are quite different. This can be due to two main causes. The first possible cause is that there was some bending moment superimposed to the tensile load during the test leading to different longitudinal strain components on the two sides of the sample. The second possible cause is that the size of the observed region is inferior to the one of the representative
0 1 2 3 0 50 100 150 200 250 εxx (x10-3) σxx (M P a ) strain gauge map average 0 3.5 7 -2 0 2 -5 -2 1.5 Stress-strain curve εxx (x10-3) εyy (x10-3) εxy (x10-3)
4
volume (which is possible considering the total number of grains).
The different strain maps for the last step of loading show localizations that are in accordance with the positions of the grain and twin boundaries. It has to be noted that on the micrograph made after the test on the sample, some slip lines can be seen on some of the regions where εxx is maximal. This reinforces the confidence and relevancy of the obtained strain maps.
One way to exploit these full-field data in order to characterize the onset of micro-plasticity is to perform an averaging of the strain values over the surface of a single grain or a single twin (considered here as the same kind of “unitary cell” of the microstructure). The averaging has two main advantages:
– it gives access to a single representative value for the whole grain;
– on a metrological point of view, the averaging increases the signal to noise ratio.
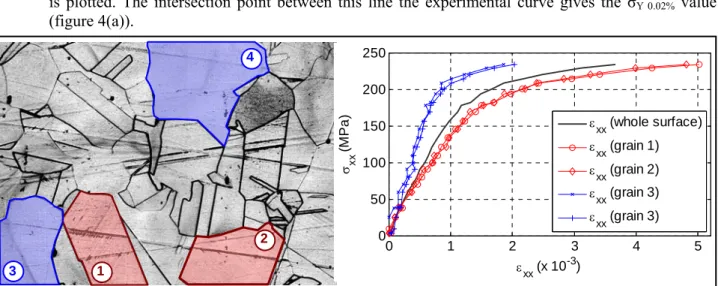
This allows plotting a stress-strain curve per grain. figure 3 shows such curves (grains 1 and 2 are grains that are submitted to large plastic deformation, showing slip lines on the micrograph whereas grains 3 and 4 are grains that are less deformed; see figure 2 ) to be compared to the one obtained for an averaging on the whole surface of the region of interest.
These curves show that, for this stainless steel sample, the local strain can vary of a 2.5 factor from a little solicited grain to a hugely solicited one. From this observation, it can be asserted that the proposed technique should be able to give information about the local onset of micro-plasticity.
To this purpose, two semi-automatic procedures of determination of a local yield point have been implemented.
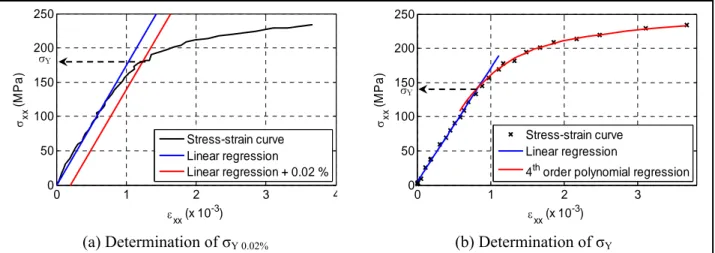
The first one is simply based on the transposition of the normalized value calculation of the yield point to this scale: a value of the “0.02% yield stress” is thus proposed for the considered local regions. For that, a linear regression is made on the first value of strain/stress (up to a stress value equal to 100 MPa, to be sure to stay in the elastic domain while having enough experimental value to get a relevant regression law). Then, the deduced straight line, shifted by a value of 0.02 % in strain, is plotted. The intersection point between this line the experimental curve gives the σY 0.02% value (figure 4(a)).
FIG. 3 – Average stress-strain curves for several grains or twins of the sample
The second one consists in finding the intersection between the regression line previously obtained from the first sets of values, and a 4th order polynomial curve computed by regression on the last stages of loading. This allows getting rid off the possible influence of the noise affecting the experimental data on the determination of σY 0.02% by the previous method and to get a closer value to the local loss of linearity (figure 4(b)).
1 2 3 4 0 1 2 3 4 5 0 50 100 150 200 250 ε xx (x 10 -3) σ xx (M P a ) ε xx (whole surface) εxx (grain 1) ε xx (grain 2) ε xx (grain 3) εxx (grain 3)
5
FIG. 4 – The two ways to determine the local yield point
Thus, two values characterizing the onset of micro-plasticity are available. They, and the difference between them and the reference value obtained for the whole surface of the region of interest, are given in table 1.
Whole
surface Grain 1 Grain 2 Grain 3 Grain 4
Average / 4 grains
σY 0.02% 180 MPa 164 MPa 164 MPa 211 MPa 204 MPa 185 MPa
Difference from
the whole surface - – 16 MPa – 16 MPa 31 MPa 24 MPa 5 MPa
σY 145 MPa 122 MPa 105 MPa 195 MPa 171 MPa 148 MPa
Difference from
the whole surface - – 23 MPa – 40 MPa 50 MPa 26 MPa 3 MPa
TAB. 1 – Values of local yield points for different grains of the sample
One can conclude from this table that grains 1 and 2, which are more solicited, are entering in their plastic domain earlier that the whole observed region (for a nominal tensile stress ≈ 20 MPa lower). On the contrary, grains 3 and 4, less solicited, are entering in their plastic domain later (for a nominal tensile stress ≈ 30 MPa higher). The difference of values for grain 2 and grain 3 between the two values of σY 0.02% and σY can be explained by the noisier experimental data for these grains.
4 Conclusion
The exposed study, based on a full-filed micro-extensometric methodology, has been applied to a austenitic stainless steel sample submitted to a tensile test.
The proposed experimental procedure has confirmed its robustness and relevancy to measure local small strains (strain resolution ≈ 2×10⁻³ for a spatial resolution about 20 µm). Moreover, it has allowed showing that the plastic domain starts earlier than the macroscopic yield point (which can be considered only as an average value of all the local yield points). This was known for a long time (especially, once studying fatigue behaviour, the permanent deformations appearing before to reach the macroscopic yield stress are decisive) but has hardly been experimentally measured.
Equipped with this method, a possible continuation to this work could be to combine it with thermographic observation to link the local measured plastic strains to the heat dissipation of a studied material and, thus, develop a tool to better characterize the endurance limit.
0 1 2 3 0 50 100 150 200 250 εxx (x 10-3) σxx (M P a ) Stress-strain curve Linear regression
4th order polynomial regression
σY
(a) Determination of σY 0.02% (b) Determination of σY
0 1 2 3 4 0 50 100 150 200 250 εxx (x 10-3) σxx (M P a ) Stress-strain curve Linear regression Linear regression + 0.02 % σY
6
References
[1] Qu J. and Cherkaoui M. (2006) Fundamentals of Micromechanics of Solids, Wiley.
[2] Nicoletto G., On the visualization of heterogeneous plastic strains by Moiré interferometry, Optics and Lasers in Engineering, 37, 433-442, 2002.
[3] Guo Z., Xie H., Li, B., Dain F., Chen P., Zhang Q. and Huang F., Study on deformation of polycrystalline aluminum alloy using moiré interferometry, Experimental Mechanics, 46, 699–711, 2006.
[4] Lagattu F., Bridier F., Villechaise P. and Brillaud J., In-plane strain measurements on a microscopic scale by coupling digital image correlation and an in situ SEM technique, Materials Characterization, 56, 10-18, 2006.
[5] Héripré E., Dexet M., Crépin J., Gélébart L., Roos A., Bornert M., Caldemaison D., Coupling between experimental measurements and polycrystal finite element calculations for micromechanical study of metallic materials, International Journal of Plasticity, 23, 1512-1539, 2007.
[6] Padilla H.A., Lambros J., Beaudoin A.J. and Robertson I.M., Relating inhomogeneous deformation to local texture in zirconium through grain-scale digital image correlation strain mapping experiments, International Journal of Solids and Structures, 49, 18-31, 2012
[7] Moulart R., Rotinat R., Pierron F. and Lérondel G., On the realization of microscopic grids for local strain measurement by direct interferometric photolithography, Optics and Lasers in Engineering, 45, 1131-1147, 2007.
[8] Moulart R., Rotinat R. and Pierron F., Full-field evaluation of the onset of microplasticity in a steel specimen, Mechanics of Materials, 41, 1207-1222, 2009.
[9] Surrel Y., Moiré and grid methods: a signal-processing approach, Proc. of Interferometry ’94: Photomechanics, Vol. SPIE 2342, 1994.
[10] El Bartali A., Aubin V. and Degallaix S., Fatigue damage analysis in a duplex stainless steel by digital image correlation technique, Fatigue and Fracture in Engineering Materials and Structures, 31, 137-151, 2008.
[11] Cleveland W. and Devlin S., Locally weighted regression: An approach to regression analysis by local fitting, Journal of the American Statistical Association, 83 (403), 596–610, 1988.
[12] Nayroles B., Touzot G. and Villon P., La méthode des éléments diffus. Comptes rendus de l’Académie des Sciences, série 2, Mécanique, Physique, Chimie, Sciences de l’Univers, Sciences de la Terre 313 (2), 133–138, 1991.
[13] Avril S., Feissel P., Pierron F and Villon P., Comparison of two approaches for differentiating full-field data in solid mechanics, Measurement Science and Technology, 21(1), 015703 (11pp), 2010.
[14] Pierron F., Green B. and Wisnom M.R., Full-field assessment of the damage process of laminated composite open-hole tensile specimens. Part I: methodology, Composites Part A: Applied Science and Manufacturing, 38 (11), 2307–2320, 2007.