Record Number:
25550
Author, Monographic: St-Hilaire, A.//Massicotte, B.//Bobée, B.//Ouarda, T. B. M. J.//Arsenault, É.//Chiasson, A.
Author Role:
Title, Monographic:
Summary of water quality analyses Peticodiac watershed
Translated Title:
Reprint Status:
Edition:
Author, Subsidiary:
Author Role:
Place of Publication:
Québec
Publisher Name:
INRS-Eau
Date of Publication:
2001
Original Publication Date:
Juin 2001
Volume Identification:
Extent of Work:
iv, 98
Packaging Method:
pages incluant 3 appendices
Series Editor:
Series Editor Role:
Series Title:
INRS-Eau, rapport de recherche
Series Volume ID:
588 b
Location/URL:
ISBN:
2-89146-489-3
Notes:
Rapport annuel 2000-2001
Abstract:
En collaboration avec Roche Ltée
Numéro de rapport et ISBN demandés par Martyne Charbonneau et fournis par Jean-Daniel le
24 juillet 2002
15.00$
Call Number:
R000588 b
SUMMARY
OF WATERQUALITY ANALYSES
PETITCODIAC WATERSHED
© INRS-Eau, 2001 ISBN 2-89146-489\-3
ROCHE LTÉE, GROUPE-CONSEIL
INRS-EAU
Summary of water quality analyses
Petitcodiac Watershed
l;t-I3:IJ
N/Réf. : 21654-001REPORT
JUNE 2001
3075, ch. des Quatre-Bourgeois Sainte-Foy (Québec) G1W 4Y4 Téléphone:(418) 654-9600 Télécopieur: (418) 654-9699
INRS-Eau
Chaire en hydrologie statistique 2800 rue Einstein, C.P. 7500 Ste-Foy, Québec,
TABLE OF CONTENTS
LIST OF TABLES ... 11
LIST OF FIGURES ... 111
PROJECT TEAM ... IV
1.
INTRODUCTION ... 1
1 . 1
Context ... '" ...
1
1
.2
Objectives ... 1
2. METHODOLOGY ... 3
3. RESUL TS ... 4
3.
1
Jones Lake ... 6
3.2
Humphreys Brook ... 7
3.4
Memramcook River ... 7
3.5
Fox Creek ... 12
3.6
Jonathan Creek ... 12
3.7
Rabbit Brook ... 12
3.8
Mill Creek ... 12
3.9
West Branch Halls Creek ...
19
3.10
Other tributaries with relatively high bacterial counts ...
19
3.11
Other tributaries with relatively high organic parameters ...
19
3.12
Relatively pristine tributaries ... 23
3.13
Seasonal variability ... 23
4. LAND AND WATER USES ... 27
5. CONCLUSION ... 29
6. REFERENCES ... 30
Appendices
Appendix
1
Appendix 2
Appendix 3
'i
1eX
3:lj
O/Ref.: 21654-001Inventory of point and non point pollution sources in the Petitcodiac
watershed
Water quality data from the Petitcodiac watershed,
1975-1999
List of water quality sampling stations
i
-INRS-EAU, CHAIRE EN HYDROLOGIE STATISTIQUE
Petitcodiac Watershed Monitoring Group Water Quality Analysis
LIST OF TABLES
Table 1
General appreciation of water quality in the different water bodies of
the Petitcodiac watershed ... 5
'jt·xemj
O/Ret.: 21654-001 ii
-INRS-EAU, CHAIRE EN HYDROLOGIE STATISTIQUE
Petitcodiac Watershed Monitoring Group Water Quality Analysis
LIST OF FIGURES
Figure 1 Total coliform concentrations for Jones Lake (1998) ... 8
Figure 2
Lead (Pb) concentrations in Jones Lake (1997-2000) ... 9
Figure 3
Iron concentrations in Humphreys Brook ... 1 0
Figure 4
Zinc concentrations in the Memramcook River, 1997-2000 ... 11
Figure 5
Total coliform concentrations and E. coli concentrations in Fox Creek
between 1998-2000 ... 13
Figure 6
E. coli concentrations in Jonathan Creek, 1999-2000 ... 15
Figure 7
Total coliform concentrations at two stations (Mapleton road and near
the mouth) du ring 1998 ... 17
Figure 8
Aluminium (AI) and Iron (Fe) concentrations in Mill Creek, 1997-2000 ... 18
Figure 9
E. coli concentrations in the West Branch of Halls Creek, 1998-2000 ... 20
Figure 10 Total Coliform concentrations at five stations in the Petitcodiac River,
1998 ... 21
Figure 11 Map of the Petitcodiac drainage basin showing regional distribution of
the four categories of water quality ... 25
Ijt
e
X3:14
O/Ref.: 21654-001 iii
-INRS-EAU, CHAIRE EN HYDROLOGIE STATISTIQUE
Petitcodiac Watershed Monitoring Group Water Quality Analysios
PROJECT TEAM
PETITCODIAC WATERSHED MONITORING GROUP:
Éric Arseneau, M.A.
Coordinator
Alyre Chiasson, Ph.D.
Technical Advisor
ROCHE
L
TÉE, GROUPE~CONSEll:Bernard Massicotte, M.Sc.
Biologist
INRS-EAU, CHAIR IN STATISTICAl HVDROlOGV:
Bernard Bobée, Ph.D.
Director
Taha Ouarda, Ph.D.
Professor
André St-Hilaire, Ph.D.
Research Associate
Reference to be cited:
St-Hilaire, A., B. Massicotte, A., B. Bobée, T. Ouarda, E. Arseneau, A. Chiasson.
2001. Petitcodiac Watershed Monitoring: Summary of water quality analyses.
Report produced by Roche Ltée, Groupe-conseil and INRS-Eau on behalf of the
Petitcodiac Watershed Monitoring Group. 30 p.
+
appendices.
'it
eX3:j:1
O/Ref.: 21654-001 iv
-INRS-EAU, CHAIRE EN HYDROLOGIE STATISTIQUE
Petitcodiac Watershed Monitoring Group Water Quality Analysis
1. INTRODUCTION
1.1
CONTEXT
The Petitcodiac River is located in Southeastern New Brunswick. It has a drainage
basin area of 1999 km
2,and is home to approximately 120 000 people, most of
whom live in the Greater Moncton area.
One of the main features of this river system is the presence of a causeway. It was
built in 1968 when it became obvious that the Gunningsville Bridge could not sustain
the growing traffic between Moncton and Riverview. The presence of the causeway
has changed the hydrodynamic conditions in the river system. A debate on how to
best manage these changes and their effects has been ongoing for a number of years.
For this reason, a lot of attention has been devoted to this river system by the media,
various government departments (both federal and provincial) and the scientific
community in recent years.
ln 1997, the Petitcodiac Watershed Monitoring Group (PWMG) was founded with a
mandate to establish and support a network of volunteers who will conduct long-term
water quality monitoring in the Petitcodiac watershed (Frenette, 2000). Since then,
water quality data has been gathered by the PWMG, in partnership with the New
Brunswick Department of the Environment and Local Government (DELG) at various
locations in the watershed. The PWMG has also compiled historical water quality data.
These past and more recent data allow for spatial and temporal analysis of the water
quality in the Petitcodiac drainage basin.
The Petitcodiac Watershed Monitoring Group has therefore hired Roche Ltd, with the
assistance of the Chair in statistical hydrology (lNRS-EAU, Université du Québec) to
produce a report on water quality data measured on the Petitcodiac watershed.
1 .2
0
BJECTIVES
A first technical report (St-Hilaire et al. 2001) was produced with the objective of
providing a statistical study of the water quality and hydrology of the Petitcodiac River
and some of its tributaries. This report provided a comparison of recent water quality
'jt.I3#1j
O/Ref.: 21654-001 1
-INRS-EAU. CHAIRE EN HYDROLOGIE STATISTIQUE
Petitcodiac Watershed Monitoring Group Water Quality Analysis
analyses with historical (1975-1977) data. In order to facilitate the interpretation of
water quality data, an analysis of the prevailing meteorological (i.e. rain and air
temperature) and hydrological (i.e. freshwater flows) conditions was also included.
This second report focuses on recent (1997-2000) information and provides a general
description of water quality in each of the sam pied rivers and tributaries of the
Petitcodiac drainage basin.
'jt.I3:IJ
OIRet.: 21654-001
2
-INRS-EAU, CHAIRE EN HYDROLOGIE STATISTIQUE
Petitcodiac Watershed Monitoring Group Water Quarrty Analysis
2. METHODOLOGY
ln a previous report, St-Hilaire et al. (2001) calculated mean values of water quality
parameters for each station sampled by the PWMG. From these data and other
analyses detailed in the first report, a list of tributaries and rivers with potential water
quality problems was established.
When possible, the criterion for comparison was a mean value exceeding the Canadian
Water Ouality Guidelines (CWOG). This was not the only criterion, however. Although
many values are above the Canadian Water Ouality Guidelines, parameters were not
selected based solely on these guidelines because they don't exist for ail variables. For
each water body, the parameters indicated are those that demonstrate high values
compared to values generally observed in the watershed from 1997 to 2000. These
values are considered as elevated relative to the mean of measurements taken on the
watershed.
Water bodies have been classified on a relative basis using an arbitrary code ranging
from 1 (best water quality) to 4 (worst). The codes have been attributed based on the
number of elevated parameters and on their average value during the 1997-2000
period. The codes have been attributed as follows :
~
1: average values ail below CWOG, no parameter in elevated concentrations
compared to the regional values
~
2: one parameter above CWOG or above regional average
~
3: five or less parameters above CWOG or regional values
~
4: more than five parameters above the CWOG or regional values
I;t.I3:tJ
OIRet.: 21654-001
3
-INRS-EAU, CHAIRE EN HYDROLOGIE STATISTIQUE
Petitcodiac Watershed Monitoring Group Water Quality Analysis
3. RESULTS
Table 1 presents the results of the classification of the waterbodies and indicates the
parameters that were found in elevated concentrations in each case. The table also
presents preliminary data on point and non point pollution sources located so far in
each waterbodies (number of liquid effluents, agriculture sites and bank erosion sites).
It should be noted that this inventory is in progress and has not been completed yet
for ail waterbodies. This partial information is nonetheless presented as it provides
basic information about possible causes of water quality degradation in each
waterbody. Maps indicating the location of these point and non point pollution sources
within the various subwatersheds are presented in appendix A.
Jones Lake, Humphreys Brook, Rabbit Brook, Fox Creek and the Memramcook River
are areas of concern (category 4 in Table 1). In these sub-basins, high bacterial
counts, as weil as elevated aluminium and nutrient concentrations are indicative of
water quality degradation.
At the other end of the spectrum, the first category in Table 1 includes the more
pristine sites, for which none of the water quality parameters measured showed
concentrations greater than the CWQG or greater than the mean concentration for the
watershed. This category includes Little River, the North-West Branch of Halls Creek,
Pollett River and Prosser Brook.
A description of temporal and, wh en available, spatial trends is given for individual
rivers and tributaries in the following subsections.
1;!·Iit:lJ
O/Ref.: 21654-001 4
-INRS-EAU, CHAIRE EN HYDROLOGIE STATISTIQUE
Petitcodiac Watershed Monitoring Group Water Quality Analysis
Table 1
General appreciation of water quality in the different water bodies of the
Petitcodiac watershed
Note:
For each watershed, the parameters indicated are those that demonstrate elevated
values compared to the Canadian Water Quality Guidelines or to the average values
observed in the watershed.
WATER BODY CODE LAND USE STATISTICS NUMBER OF SITES LOCATED
Agriculture Erosion Effluents
Anagance River 2 Bennett Brook 2 Fox Creek 4 3 Halls Creek 2 21 81 271 Humphreys 4 7 23 Brook Jonathan Creek 2 1 7 Jones Lake 4
'jt.Ië!:IJ
OlRef.: 21654-001PARAMETER UNIT MEAN VALUE
1997-2000 (NUMBER OF OBSERV.) Iron mg/l 0,82 (34) Total Coliforms MPN/100 ml 3574 (9) Aluminium mg/l 0,42(17) E coli MPN/100 ml 1435 (17) Iron mg/l 1,15 (17) Nitrates mg/l 0,33 (17) lead Jlg/l 1,35 (17) Total Coliforms MPN/100 ml 5686 (9) Total Kjeldahl nitrogen mg/l 0,63(17) Total organic carbon mg/l 13,3 (17)
Ortho-phosphates mg/l 0,06(17)
Turbidity NTU 16,8 (17)
Nitrates mg/l 0,35 (2)
Turbidity NTU 9,2 (2)
Aluminium mg/l 0,27 (26)
Fecal coliforms CFU/100 ml 350(18)
Iron mg/l 0,94 (26)
Ammonia mg/l 0,09 (26)
lead Jlg/l 1,48 (26)
Total Coliforms MPN/100 ml 5181 (18) Total Kjeldahl nitrogen mg/l 0,62 (26)
Total organic carbon mg/l 12,9 (26)
Ortho-phosphates mg/l 0,05 (26)
Turbidity NTU 8,28 (26)
Fecal coliforms CFU/100 ml 668 (9)
Aluminium mg/l 0,73 (16)
E coli MPN/l00 ml 1753 (16)
Fecal coliforms CFU/100 ml 539 (9)
Iron mg/l 1,70(16)
Ammonia mg/l 0,04(16)
lead Jlg/l 3,89(16)
Total Coliforms MPN/100 ml 5773 (9) Total Kjeldahl nitrogen mg/l 0,85(16)
Total organic carbon mg/l 10,3 (16)
Ortho-phosphates mg/l 0,10(16)
Turbidity NTU 26,4 (16)
Zinc Jlg/l 19,2 (16)
5
-INRS-EAU, CHAIRE EN HYDROLOGIE STATISTIOUE
Petitcodiac Watershed Monitoring Group Water Quality Analysis
WATER BODY CODE LAND USE STATISTICS PARAMETER UNIT MEAN VALUE
NUMBER OF SITES lOCATED 1997-2000
Agriculture Erosion Effluents (NUMBER OF
OBSERV.)
Little River 1 (None)
Memramcook 4 3 2 Aluminium mg/l 0,30 (14)
River Iron mg/l 1,93 (14)
Ammonia mg/l 0,05 (14)
Total Coliforms MPN/l00 ml 3656 (6)
Total Kjeldahl nitrogen mg/l 0,59 (14)
Total organic carbon mg/l 17,9 (14)
Ortho-phosphates mg/l 0,07 (14)
Zinc /lg/l 74,3 (14)
Mill Creek 3 1 Aluminium mg/l 0,21 (16)
Iron mg/l 1,14 (16)
Total organic carbon mg/l 15,6(16)
North Branch 1
2
18'
27'
(None)Halls Creek
North River 2 Total organic carbon mg/l 10,9 (76)
Petitcodiac River 2 4 Total Coliforms MPN/l00 ml 2679 (50)
Pollett River 1 (None)
Prosser Brook 1 (None)
Rabbit Brook 4 E coli MPN/l00 ml 4375 (25)
Fecal coliforms CFU/l00 ml 1733 (181
Iron mg/l 0,76 (25)
Ammonia mg/l 0,76 (25)
lead /lg/l 0,89 (25)
Total Coliforms MPN/l00 ml 14567 (181
Total Kjeldahl nitrogen mg/l 0,59 (25)
Ortho-phosphates mg/l 0,06 (25)
Turbidity NTU 13,3 (25)
Zinc /lg/l 19,0 (25)
Turtle Creek 2 Ammonia mg/l 0,08 (9)
Weldon Creek 1 (None)
West Branch 3
2'
8'
27'
E coli MPN!100 ml 2209 (231Halls Creek Fecal coliforms CFU/l00 ml 390 (18)
Nitrates mg/l 1,19 (23)
Total Coliforms MPN/l00 ml 5101 (18)
Turbidity NTU 11,5 (23)
Values are for the en tire Halls Creek watershed.
3.
1
JONES LAKE
Jones Lake showed high mean concentrations of bacteria
(E.coli,
Fecal Coliforms and
Total Coliforms). Mean Total Coliforms in the. lake was calculated to be 5573
MPN/100mL. Figure 1 shows the evolution of coliform concentrations during the
summer of 1998. It shows the Total Coliform (TC) concentrations increasing from
lit-XÎW:W
O/Ref.: 21654-001 -
6-INRS-EAU, CHAIRE EN HYDROLOGIE STATISTIQUE
Petitcodiac Watershed Monitoring Group Water Quality Analysis
1660 MPN/1 OOmL in June, just after the spring freshet, to 12030 MPN/100mL in
October.
Heavy metals, such as Lead (Pb) are still a cause for con cern in Jones Lake. Although
the extreme values
(>20 pg/U measured in 1 977 (see Figure 2) were not found in
more recent samples, the overallaverage (3.89 pg/U remains higher than the CWQG
(1 pg/L).
3.2
HUMPHREYS BROOK
Humphrey's Brook was also characterised by high bacterial counts (mean Total
Coliform concentrations of 5181 MPN/100mU and high heavy metal concentrations
such as AI (0.24 pg/U. The mean iron (Fe) concentration in Humphreys Brook
(0.94 mg/U was nearly twice the mean concentration for the entire Petitcodiac
watershed (0.49 mg/Llo A very high measurement (7.9 mg/L) measured at station 1 in
Humphreys Brook on July 15
th,
1997 is the main reason for such a high mean value
(see Figure 3).
3.4
MEMRAMCOOK RIVER
Mean Total
Coliform concentrations
calculated
for the
Memramcook River
(3656 MPN/100mL) were slightly higher than the mean for the entire drainage basin
(3430 MPN/1 OOmL). Metals such as zinc (Zn) and iron (Fe) were found in relatively
high concentrations. The mean concentration of ZN was 74.3 pg/L, which is more
than twice the CWQG maximum standard. This high mean concentration was caused
by one sample with a very high Zn concentration (906 pg/L, perhaps an outlier value),
taken on September 14
th ,1997 (see Figure 4). Aluminium (AI), was also measured in
high concentrations in the Memramcook River (mean value of 0.3 mg/Llo The CWQG
standard for this metal is 0.1 mg/L.
O/Ref.: 21654-001 7
-INRS-EAU. CHAIRE EN HYDROLOGIE STATISTIQUE
Petitcodiac Watershed Monitoring Group Water Quality Analysis
14000,---,
12000+---~---~---10000
.-~E
0 0...
8000
-D.. Z~
E
..
g
"0
6000
0S
01-4000
2000
+---~----~---j0 +
-1998/06/18
1998/08/13
1998/09/13
1998/10/12
Date6Z/0l/00OZ
tZ/60/000Z
Çl/80/000Z
l~/Ol/666l ~O/Ol/666l6Z/80/666l
8Z/LO/666l
...---0 0Zl/Ol/866l
N 0 III 1 QIr--.
-
ca 0') C 0') ~l/60/866l..-
...
ID .::.t. ctl~l/80/866l
....J (J) ID C 0-.
8l/90/866l
c
(J)c
0 ~l/Ol/L66l +=i ctl....
+-' C IDu
tl/60/L66l
c
0u
...---..c
i:l/80/L66l
a..
...
"'0 ctl ID ....J9l/LO/L66\
N ID....
:::JÇO/90/L66l
iL
Cl U") N (,/6n) qdFe (mg/L)
0) -.s co V> J>. U'-\
0 N 1 1 1 1\
1 \\
\
ï1cë
"
c
~ (1) v.>1997/08/12
~ 0 ::J (")1997/09/14
0 ::J (")1997/10/13
(1) ::J...
~w
...
ë>
::J Cf) ::Jo
1998/08/13
III:I
CD
C III3
1998/09/13
-0 ~ ~ (1)1998/10/12
'< Cf) OJ ~ 01999/06/22
0 "7'"1999/09/01
1999/10/03
1999/10/31
1999/11/02
2000/08/15
O
.
2000/09/24
r-
I
-1 Cf) ~!() ni
==
\
I
g
"
::0 ~ CL ~OJ....
2000/10/29
'--
.
.
.--1
1 \ <00:
CD100
906 ug/L
90
80
70
60
::J
-
CI50
.2-
- - - .-c
N40
30
20
10
0
r--- -g- cr) C'J C'J=
CD CD cr) Ln -g- -g- 0 ) ,--J C'J c---J c---J=
cr) cr) c---J c---J C'J ---~---
---
---
---
---
---~'---
---'---. ---~~ ~---=
CD 0 )=
CD r---=
=
=
=
=
=
0 ) 0-'=
=
=
=
=
=
=
=
=
=
=
---
------
---~---
~------
---
---
------
---
---r--- r---=
=
0 ) 0 ) 0 ) 0 ) 0 ) 0 ) 0 - ,=
=
=
0 ) (7) 0 ) 0 ) 0 ) en 0-, 0 ) 0-, 0 ) 0-,=
=
=
CD 0-1 CD 0-, 0 - , (7) 0-, 0 - , 0-' 0 - , 0-,=
=
=
c---J c--.J ,--J Dates3.5 Fox
CREEK
Fox Creek also showed high concentrations of coliform
(E. coli and Total
Colifo~m),with Total Coliform values reaching 24190 MPN/1 OOmL on October 12
th,
1998
(Figure 5).
E.coli concentrations were also high during the summer period (August and
September) of 2000 (Figure 5). Mean lead concentration in Fox Creek was calculated
to be 1 .35 j1g/L, which is a value exceeding the CWOG of 1.0
j1g/L.
3.6
JONATHAN CREEK
High bacterial concentrations in Jonathan Creek remain a cause for concern (Figure 6).
A large number of samples taken in 1999 showed high concentrations (i.e.
>
648 MPN/100mL, which is the watershed mean) of
E. coli. There appears to be a
decreasing trend in the mean concentrations of
E. coli, as The high values measured in
1999 were not found as often in 2000 (Figure 6).
3.7
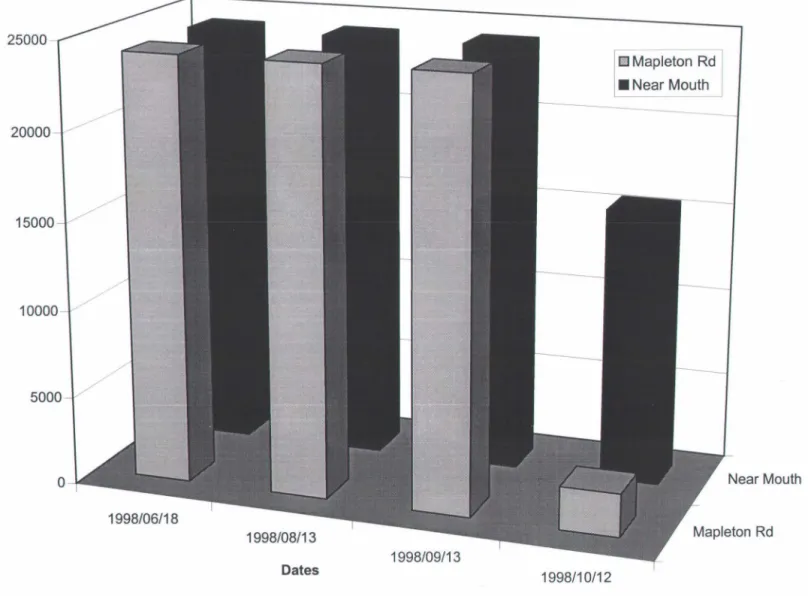
RABBIT BROOK
Total Coliform counts were only measured in 1998 in Rabbit Brook (Figure 7). Both
stations (i.e. near Mapleton Road and near the mouth of the brook) showed high
concentrations
(>24190 MNP/100mL) throughout the summer of that year, but
decreased in the fait (Figure 7). Metal concentrations (Fe, Zn) were generalty lower
that the CWOG standard but higher than the mean for the entire drainage basin.
3.8
MILL CREEK
Aluminium (AI) and iron (Fe) mean concentrations in Mill Creek both exceeded the
CWOG standard. Aluminium concentration reached a maximum of 0.95 mg/L in
October 2000. It should be noted that , for the same sample, Suspended sediment
concentration and turbidity were also very high. It is possible that some of the
sediment may have contaminated the water sample. The CWOG standard for AI
concentration is 0.1 mg/L. The maximum measured iron concentration was 2.1 mg/L,
nearly seven times the CWOG standard (Figure 8).
'jt.I3:IJ
O/Ref.: 21654-001 12
-INRS-EAU, CHAIRE EN HYDROLOGIE STATISTIQUE
Petitcodiac Watershed Monitoring Group Water Quality Analysis
25000
DE. Coli
•
Total Coliform
20000
:J'
E
015000
0 ~Z
Q.. ~..-E
...
10000
g
"0
()5000
0
.-(0.-
ro
.-
N 0m
.--
0è3
(::! 1"-coro
0 (::! Ol Olro
.-<.0 (::! Ol Olro
e
1"-.-
Ol Ol 0 co.-
Ol Ol Olm
0 .-'<t.-
Ol Olm
.-
ro
(::!.-
Ol Olm
.-.-
Ol Olm
0 Ol.-
Ol Olè3
e
Dates .-Ol Ol.-.-
Ol.-
0 0 0 0è3
N 0 N 0 0 N::r
E 0 0...
Z
Q.!.
"0 () u.i1400
1200
1000
800
600
.,....-
.,.... 1'--
.,....e
co -0 0> 0>-
0 0> 0> -0> 0> 0> 0> 0> 0> Dates- - - _ . J
O Before Centennial
•
Rogers Road
- - - l
o
Berry Mills Rd
~--_-_ _ _0 Landfill Rd
•
below Horsman Rd
- - - '
0 Wheeler
•
McNa
School
McNaughton School Wheeler Before Centennial 1'-.,.... .,....-
0 Oi co -0>-
0 0> 0 0> 0 -0 0 0 0 N 0 N25000
o
Mapleton Rd
• Near Mouth
20000:r
E
0 0,..
-
a..
15000z
~
1/1E
...
g
; ;'0
10000 0iii
...
0 ~ 5000 1998/06/18 1998/08/13 1998/09/13 Dates 1998/10/126Z/0l/000Z
vZ/60/000Z
Çl/80/000Z
a/Ol/666l
LO/Ol/666l
lO/60/666l
ZZ/90/666l
Zl/Ol/866l
rl/60/866l
Zl/80/866l
VI.S!
111Ll/90/866l
Crl/Ol/L66l
vl/
6
0/L66l
ll/80/L66l
Çl/LO/L66l
o
o
o
C'\I 1 "-Ci) Ci) T'""c
CI)c
o
:.;.~
...
C ID U Co
u
...-...
IDu..
...c
e
"'0 C CU...-...
«
...E
o~c
°
E
::J«
CO~
::J 0)iL
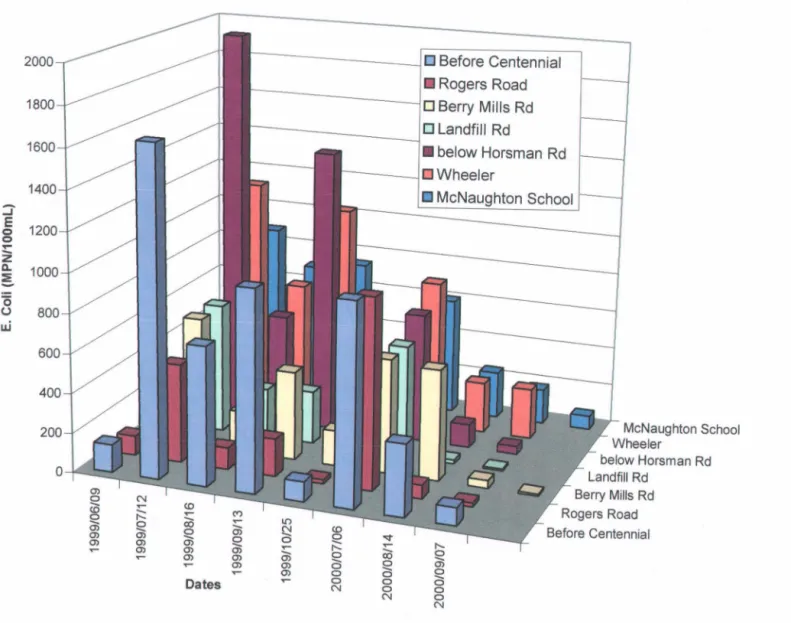
3.9
WEST BRANCH HALLS CREEK
This portion of Halls Creek was shown to have relatively high coliform counts
(E. coli,
Fecal Coliform and Total Coliform). Two stations (Briardale Street and Wheeler
Boulevard) were sampled in Halls Creek in 1998 and 1999, while only the Wheeler
Boulevard station was sampled in 2000 (Figure 9). In 1999, the Briardale Street
station showed higher
E. coli concentrations that the Wheeler Boulevard station. In
2000, the Wheeler Boulevard station showed very high
E.
coli counts, reaching a
maximum value of 24190 MPN/100mL on September 24
thof that year. Nitrates were
also found in high concentrations in this tributary. The mean concentration of N03
(1.2 mg/L) was nearly 10 times greater than the average for the watershed
(0.15 mg/Llo
3.10
OTHER TRIBUT ARIES WITH RELATIVEL
y
HIGH BACTERIAL COUNTS
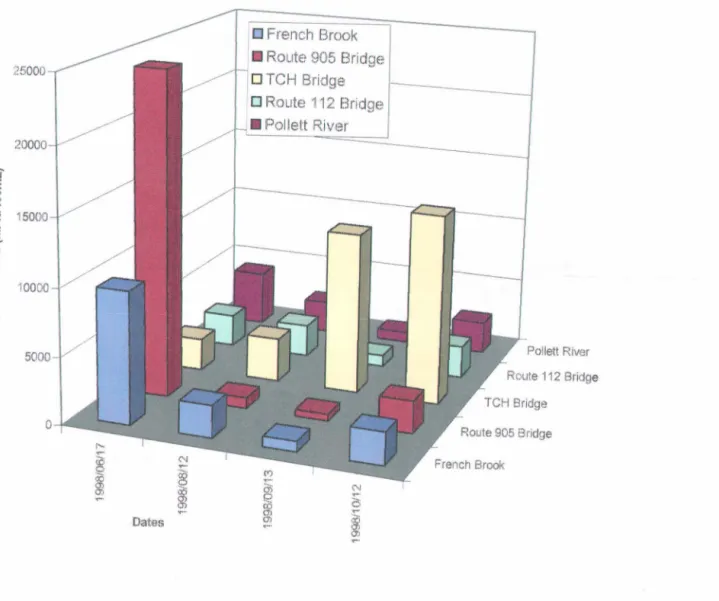
Stations on the Petitcodiac River showed relatively high Total coliform counts, with a
mean Total Coliform concentration of 2679 MPN/100mL. In 1998, the highest Total
Coliform concentration (24190 MPN/1 OOmU was measured at the route 905 station,
in June. In September and October 1998, the highest concentrations were measured
at the TCH Bridge station (Figure 10). Benett Brook also showed relatively high Total
Coliform concentrations, with a mean of 3574 MPN/1 OOmL. Measurements were only
taken in 1998 and reached a maximum value of 17330 MPN/100mL in October of
that year.
3.11
OTHER TRIBUTARIES WITH RELATIVELY HIGH ORGANIC PARAMETERS
ln the North River Total Organic Carbon (TOC, 11 mg/L) was found to be higher than
the mean concentration for the watershed (8.2 mg/L), although not as high as some of
the tributaries considered to be polluted (e.g. TOC in Fox Creek
=
13.3 mg/L, TOC in
Humphreys Brook
=12.9 mg/Llo
Halls Creek showed relatively high Nitrate (N03) concentration (0,35 mg/L), compared
to the mean watershed concentration of 0.15 mg/L. This mean concentration is based
only on two measurements taken in 1999.
Ijt.I3:jil
OIRe!.: 21654-001 -19
-INRS-EAU. CHAIRE EN HYDROLOGIE STATISTIQUE
Petitcodiac Watershed Monitoring Group Water Quality Analysis
E. Coli (MPN/100mL) "'Tl
cë·
e
-" l'V eN -"" (J1 0> -.J CD CD 0....,
0 0 0 0 0 0 0 0 0 0 0 0 0 0 0 0 0 0 0 0 0 C) 0 C) 0 0 0 C) 0 C) 0 (1) COm
() 0 0 1998/08/13 01 1 1 1
::J1
~ ~
0 (1) -" ":::I" ::J 1998/09/13 ~ CD -0. CD....,
W III _ -CD CD...,
cn~-
<
0.-
ë)"
::J 1998/10/12 (J) ::J-
0 ::J" AI (1)iD
1998/10/12~
IR (1) (J)-
1998/10/12OJ
....,
W ::J 0 ::J" 1999/10/07 0-I
~ 1999/10/07 (J) ()....,
(1) (1) 1999/10/31?'
...
CO CO ex> 2000/08/15 1 N1
0'
1
l'V ~ - " 0 0 2000/09/2425000 20000
:;
E CI CI....
Z
15000 a..:i
Ë
g
(5 10000 0ra
~
5000""
,
~ 0~
N ...~
~
Dateso
Fren
c
h Brook
•
Route 905 Bridge
O
TCH B
r
i
d
ge
("') ~ N a ...ro
ô Ut~
Ut ~ Pollet! River French BrookTurtle Creek was characterised by a mean Ammonia concentration of 0.08 mg/L,
which is lower than the CWQG of 1.37 mg/L, but higher than the mean watershed
concentration of 0.03 mg/L.
3.12
RELATIVELY PRISTINE TRIBUTARIES
Data gathered on a number of rivers and brooks in the Petitcodiac River did not show
any water quality degradation. They include Little River, the North branch of Halls
Creek
,
Prosser Brook, Pollett River, and Wei don Creek.
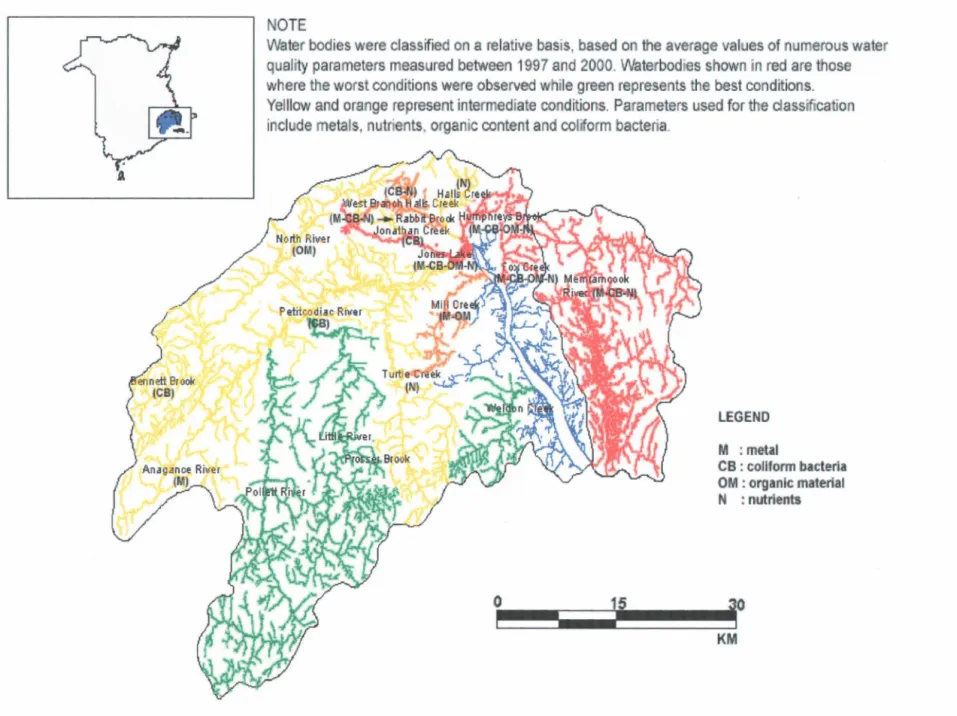
Figure 11 shows the distribution of the four relative categories of water quality in the
Petitcodiac drainage basin
.
3.13
SEASONAL VARIABILITY
Many parameters showed important variations over months. Aluminium concentrations
were higher in June and October and lower in August and September. The same
pattern is observed for E.
coli,
iron, ammonia and ortho-phosphates. By contrast,
conductivity and pH showed opposite trends, with maximum values in mid-summer.
These trends are directly related to the hydrological regime in the watershed. August
and September are the months where the lowest flows are observed in the Petitcodiac
River. In baseflow conditions, the relative importance of groundwater flow is greater
as dilution from rainfall is minimal. Groundwater typically demonstrates higher
concentrations in major ions (e.g. Ca
,
Mg, K) which translates into higher electrical
conductivity. Similarly, pH is generally higher in groundwater and greater pH values
are thus expected in baseflow conditions. On the other hand, many pollutants,
especially nutrients, are significantly related to precipitation and storm events and are
expected to reach maximum values at high flows. Although the months at which
observations are available do not cover the months of highest discharge (April, May),
the data suggest that various parameters, including aluminium, iron and E.
coli,
are
sensitive to seasonal variations in discharge. It cannot be excluded that high
concentrations of various parameters, especially aluminium and nutrients wou Id be
found in maximum concentrations during the spring freshet and storm events.
Sampling during these events could provide additional information about the general
state of the watershed and potential sources of contaminants of the Petitcodiac River.
lit.I3
:IJ
O/Ref.: 21654-001 -23
-INRS-EAU. CHAIRE EN HYDROLOGIE STATISTIQUE
Petitcodiac Watershed Monitoring Group Water Quality Analysis
NOTE
Water
bodies
were classifie<! on a relative
bas
is,
based
on
the average values of numetous water
qual
i
ty
parameters measured between
1997
and 2000. watetbod
i
es shown
i
n
red
a
re
those
where the worst conditions were observed while green
represents
the oost conditions.
Ye
l
liow
and
ora
nge represent
inte
rme
d
i
ate
conditions.
Pa
r
ameters
used
for
the dassification
include
me
ta
ls,
nutrients
,
organ
i
c
content and coliform bacteri
a
.
Petitcodiac Rivar
)
Figure 11 Water quality in the various sub-basins of the Petitcodiac Watershed
LEGEND
M
:
metal
CB
:
collfonn bacterla
OM
:
organlc
materlal
4. LAND AND WATER USES
The City of Moncton Engineering Department has collected land use data for the
Greater Moncton Planning district. These data have been used in a Geographical
Information System (GIS) to produce land use maps. The information found in these
maps is summarized here.
The Petitcodiac watershed is mostly a forested territory, especially in its southern
portion. Logging is an important industry in the area. Older forests can usually be
found in the upper reaches of the tributaries located on the south shore of the
Petitcodiac. The lower reaches have been subjected to logging. The forest in the lower
portion of these sub-basins is therefore mostly composed of plantations, young forests
and regenerating areas.
Agriculture is concentrated along the shores of the Petitcodiac and its tributaries,
especially in the northern portion of the basin. Lands in the vicinity of the Anagance
and North Rivers are mostly agricultural. There is also some agricultural activity along
the Pollett and Little Rivers. Turtle Creek is used as the main freshwater source for the
Greater Moncton area (Moncton, Dieppe and Riverview). Most of its drainage basin is
forested, except for the lower reaches near its confluence with the Petitcodiac, which
is agricultural.
The largest urban area is the Greater Moncton area with a total population nearing
100 000. It surrounds the lower reaches of Halls Creek and Jonathan Creek in
Moncton, as weil as Fox Creek in Dieppe. The presence of an old dumpsite on the
north shore of the river between the Gunningsville Bridge and the causeway, has
recently been a cause of concern and was mentioned as a potential threat to water
quality, should there be a major erosion of the river banks at the site. Two other
urbanized areas are found upstream of Moncton, along the shore of the Petitcodiac.
The town of Petitcodiac is located near the confluence of the North and Anagance
Rivers, and the town of Salisbury is located near the confluence of the Little River and
the Petitcodiac River.
'jt.I3:i='
O/Ret.: 21654-001 27
-INRS-EAU. CHAIRE EN HYDROLOGIE STATISTIQUE
Petitcodiac Watershed Monitoring Group Water Quality Analysis
Water quality in the upper reaches of Turtle Creek is of the upper-most importance,
because it is the main source of drinking water for the Greater Moncton area. In the
city of Moncton, Jonathan Creek has an important recreational mission. The creek is a
central feature in Centennial Park and water quality in Halls creek has been a cause for
con cern in the pasto
Upstream of the Petitcodiac, Lake Petitcodiac (the reservoirl is used by boaters for
recreational purposes. Angling (mostly for troutl is also popular throughout the river
system, upstream of the causeway.
Downstream of the causeway, on the south shore, the collected sewage of the cities
of Moncton, Riverview and Dieppe is received in the tidal portion of the river. There is
some seasonal commercial fishing (gaspereau, shad and smeltl downstream of
Moncton, in the estuary.
';1-Iil:14
O/Ref.: 21654-001 -
28-INRS-EAU. CHAIRE EN HYDROLOGIE STATISTIQUE
Petitcodiac Watershed Monitoring Group Water Quarrty Analysis
5. CONCLUSION
Recent water quality analyses in the Petitcodiac river watershed show that water
quality degradation is apparent in various tributaries of the Petitcodiac River. A
classification of the various waterbodies within the Petitcodiac watershed, based on
the number of water quality parameters exceeding CWOG or regional levels, was
established in order to discriminate between rivers or reaches which are relatively
more pristine than others. Fox Creek, Humphreys Brook, Jones Lake, the
Memramcook River and Rabbit Brook ail had six or more parameters exceeding CWOG
or regional levels. Weldon Creek, Prosser Brook, the Pollet River and the Little River
were categorized as relatively pristine, with no parameters exceeding CWOG. The
classification shows that water quality degradation in the Petitcodiac watershed
prevails mostly in the tributaries in the vicinity of Moncton, as weil as in the
Memracook River. In the Petitcodiac River itself, only one parameter (total coliforms)
was found in high concentrations relative to the regional levels. This can be due in
part to the fact that most sampling stations in the Petitcodiac River were located
upstream of Moncton and do not reflect the possible influence of the tributaries on
water quality and also to the dilution of the contaminants in the river.
Temporal variations appear to be important for a number of parameters. Many water
quality parameters show increased concentrations during periods of increase runoff
(e.g. AI, Fe, E. Coli, ammonia, and orthophosphates during the months of June and
October). Others seem to be diluted or decrease with higher discharge (e.g.
conductivity and pH).
Spatial variability is also important. As seen with the classification scheme, some
sub-basins appear to be more problematic than others (classification 4 in Table 1). Some
of the figures presented in this report also showed spatial variability within the same
watercourse. Jonathan Creek for instance, shows higher E. Coli upstream of Centenial
Park than near Berry Miiis Road.
Ijt.I3:IJ
O/Ref.: 21654-001 -
29-INRS-EAU, CHAIRE EN HYDROLOGIE STATISTIQUE
Petitcodiac Watershed Monitoring Group Water Quality Analysis
6.
REFERENCES
CCME (Canadian Council of Ministers of the Environment). 1999. Canadian water
quality guidelines for the protection of aquatic life: Summary table. In:
Canadian environmental quality guidelines 1999, Canadian Council of Ministers
of the Environment, Winnipeg.
Frenette,
1.
2000. Petitcodiac Watershed Monitoring Group. Progress report: 31 p.
Geological survey of Canada (1982). Geological map, #1594A.
New Brunswick Department of Natural Resources (1979). Surficial Geology,
map #NR-1.
St-Hilaire, A., B. Massicotte, A., B. Bobée, T. Ouarda, E. Arseneau, A. Chiasson.
2001. Petitcodiac Watershed Monitoring: Water quality and hydrological
analysis. Report produced by Roche Ltée, Groupe-conseil and INRS-Eau on
behalf of the Petitcodiac Watershed Monitoring Group. 46 p. 2 appendices.
l;t·Iït:lJ
O/Ref.: 21654-001 -
30-INRS-EAU, CHAIRE EN HYDROLOGIE STATISTIOUE
Petitcodiac Watershed Monitoring Group Water Quality Analysis
APPENDIX 1
Inventory of point and non point pollution
sources in the Petitcodiac watershed
,
Rabbit Bro k
Â#
À
EFFLUENT PIPE SITES
 Point
SAMPLING SITES
• PWMG sampllng site
SEWAGE TREATMENT PLANT
Appendix 1
EFFLUENT PIPE SITES
.. Point
SAMPLING SITES
• PWMG sampllng site
SEWAGE TREATMENT PLANT
Appendix 1 (continued)
A
gricult"
'-' Q'~
1
lr
~
... ' ...
( ' .b'{!'J,~
·.·.rY
..
···'·e
...
V .. -..
t1.~9
....
..
I'· . . . .!)
.d .. ·,·.·.·.'.·.···
"]
.
~~
1JJ~>
. .
.
~r
·-W~'"
c::::..-.:...r~
AGRICULTURAL SITES • Non Point SAMPLING SITES • PWMG sampllng site Map created by PWMAppendix 1 (continued)
,
AGRICULTURAL SITES
SAMPLING SITES
• PWMG sampllng site•
Appendix 1 (continued)
DRAINAGE DITCHES
SAMPLING SITES
~j
~~~~~~~~5
Appendix 1 (continued)
v
~'Bank~lirosionSurvey,1
d
~.
.--z;::~"'-L~~
SITES OF EROSION
• PoInt • Non PoIntSAMPLING SITES
Appendix 1 (continued)
SITES OF EROSION • Point • Non Point SAMPLING SITES • PWMG sampllng site
Appendix 1 (continued)
APPENDIX2
Water quality data from the Petitcodiac watershed
Appendj)/ 2. Water quality data fram the Petitcodiac watershed, 1975·1999
____ ~~J!'J~~~y _________________ ~~!I~~~_.=_-=.~~_===_-_. . ·.I~!~~ ~~g '! .:~.!~~Q.l.li!. ~!I!~ ~~ .fJefffJ.~~'?~J _ A!-(rngiL) JALK--:O~~ (mQfl:Ü .. ~s !~9JLTlè0!'-ffm~Ql qa_ (mg/[fl ç:d (\Jg~q f'.2!!_!.tR!y~ ___ ~ ___ , ~l~JI RJv8!.@~L_. _______ . __ ._ . __ .. _ .. _. . _~~~~ _. _ .. __ ~ 1~!? _~:7.~~,~_~~_
~~d~~v~~-=--=_.~~~~~B~EI!!.!
..
~=~==~~.~~=-=~~==·:·.
_
--~~=_~~-~,~
..
~- ~f.~i ~.~: ~~f: ~~~f~~~~-
1:-~'~1_
~v_~E.~~~I~.!'r." __ ._ .. _ .. t;:Ey~~!.~~!f-,gt~t!!J_. __ . _____ .. __ . _____ ._. __ ._. ___ ._ .. __ . ~!~.~~ ... __ ~ 1~.?Ê ~~.:~~_94~~ 11 ~~,i~I~f_!r~=~~~~~11!4lUII:;~
r;1[:.~~~=~~ :~~~~~i~~~l:~J·::~~~:~~
.. _. _
_
_~. ~~t@~ .-_.~_;
f;j:
:~~;~;~i...
.
"~~:~[-~~Ji~~i_!?_~!~. _' .. p~Jt~!.~J3tv!!J~.~ln ~ .... _ ._ .. _.. . _ ... __ ~ __ ._. 197~O§J'?~ ______ 5_ ~~?~ ~!~:~~~__ 3~i3~_ f~~:}if~~iy!~--. -
~~~i~~r~·f!~·L.---.--_.--- --- ---. ---.--.---.
~~~~:---
~ ~~~~. ~i:~~:~~ ~~.~.~.L_
~f~~~;~-g!i~~~t1:~~~:~--~~~====~::_-~~:~~jj~iil :i~l iif~!:
-li~1
tt_~~ ~~~ ______ ._ H!!!.~ BrookJt§.!!!..!._. _ _ _ _ . ___ ~_.____ _._ .. _ ~~_~ __ .? .!~l.~. ~~!~~~Q __ , __ ,._. __ ._4..1:~8
~~~:C~ it~-i!~:t:..
Of~~~~-:=-====-===_
-===-=
1:t-~~ :~{ ii~ ~i~~--=-n-- -=~
3iif
~-=:-~=~:n
!~~I::~:;!
....
_~~:~.:CrZast st~~-~-~---r···---
~:~9 --~ ~:~: ~~~-:~~-
-·-·----1~3--- -~--- -- - ---
---"---~~~~~=-~~~~~jP_~~==__=~_=_ =~-_=~-=-.=' fu~~
__
J
_~;~ ~~}~~t_·~~~~~=--- ---~~;t~.
~~2.~~:~5-~~I~~~ii~~c=1··
•..
i··
~t~g:E==:~~~i=~;,~4~~~==--~~~===~- li~~~1i~_ijtÜ~-~~
----) __
:!~I-~~:.,~~II!_--~ ~~;im~ RN~~f.!!!L_---.. --.---.--. ______ .. ____ .. " ~~.~ _" __ .~ ~~~: ~:~~~~~_-_ ... ____ __ _ _~~"3---"---- --~--- --- --- ----"--"--- --- --- ---~~~:~.--- ~~T~~~~---·--~-·~-·--- '}~~i09 --~ }~~ :~~~:·~~~i-··-
- - -
-
44\
-~~;f~~·~~~~-_=-
...
:.;;;;~~;~~~~~e
______ . ___ .
-==-==.
f:~~~ ~1 ~
~lt~~~~
__
~
--.. _
~~~~~-.=~~·;t···
1_~_~~C!.8:!!.~~_. __ ._ C:c?Yerdeie RiverjL ~.I!!.!. ___ . ____ ... _______ .,, _____ . ____ 1~~~10 _ _ ~ .1~7.! ~2..:I~:~00534 _ .J_?.~
~~~~""~"~~-=ijli~~~-~ -~===-=~=-=-- ~="=~~-~."i:!!i~-~ :~iijp!~~-.~==~-..
~]-i~--~~;.~~-.. ----~~~@~~----.--~,--- ---.----~:~:~-.--_f ~:~: ~~}:-:~~--.-
--...
-
]:3-Haii.erôok--- -.--- - Halls Brook (fi) Sin 2 . - - - -1076xj7l07'- 7 1976 52-78-9400581" 651 ,BJ!!1i_~=-=--=~~:_ !i!il!-~~~ ______ . _______ .. _ _ _ _ ....
==-:==--=_ ..
~ 19761Oj~ '.~ ___ ~_1J.!~ ~?:~~~~ =~~~:-_-___ .... __
~~_~~~}~~~~~=:
-_
~~;-JrJ-~L=-~-~~~_~~~~:~:~ ~~=~=: m~~~ :~d"~~ ~l-EI-~:_m -:-=:-:~::~l
~~n.!~_~_~!'!~ ____ ~~_nl!I!!!'!9!!!Ml~!~_~~!l!~_~.!'!:!I: ___ . ___ . __ .... ____ .. _. __ ~.!~~.!!~!~ __ .!' 19.B1 ~:l~:~~!1..~ _____ ._ ..
~~;1~
6:::,---,-
~~~~~.~-.---_.- --. ----.. -.. -._ ...
f~ft~:"-H-
~:~%- :~:~~:~--.- --,.
J~~I!i.~_~~~=_._ ~ëlh8nëf"k e8IO~~~~_·~fy~~:_~ _ _=_-~=__=~:==_ '-.~-=:~=~_ '1976111/16 _=~~[j_ f976 §f:~94~-=-~'-_ .... --- . Jonathan Creek Jonathan Creek Below Park CUlvertl 1976/11/16 11 1976 52·76-9400818
JOriiïthancr;ti-'---'- J"Onalhan Cree6( BelowslormsiNef'--'-'--"--- '-. ----.-.-.-1976Î11i18 --11 1976'
62:76-:9400807--~~:;~;~~~=~~ ~~~~~~~Jg~f~~~~~===~=:= -.=----==.~.~ .{~~We =~~'IT. ~;~ ~:~~~~if~~·
___
~bbll B!~! _____ ___ .. R~blt ~_~~.L ________ . __ . _ _ _ .. ___ ._ ... ____ ... _._._._ .... !!7~J.1!.!~ . __ 11 1Ql!! ~_~:!.~.94008Q9 ._~ ...
~It Br~~ ____ . ____ . ~!!l.~l..~k @Stn2. ___________ . _ _ _ . __ .. __ .~ __ ... _ ... :'J?~~1I1~ _._:~J 19~ ~:?.~.~~1f) __
~~!I Brook __ . ____ R~~OOk @ Sin L ____ ~_. _._. ___ ,,___ . ___ .. ____ ~ __ ~_~!.~.!.1tt!! __ ~ ~~. ~~:76:.94~~ !.._
~!~"I&.f!3r~~~ ____ -' __ ~~~~!.~ ___ . ___ .. ______ . __________ ._ 1.~~111/16 ._.~!!!rr6 ~:!~~_~1~. ~rdale.~lY~. ____ ~:!!'~~LRke!~....! _______ . _ _ _ .. _. __ . ______ . 1!!!.~~ __ 2 ~!1 6~:1!.:~_~~.? ___ ..
;·t:-h~f!ckRiv«---~_ir~~~----"---r-·---· ~f~-H
-.. -: ~:~~
~~~)~=~%--~.-pitiiëOdj8ëRiV"ëf~'--" Petltcodlac RlveL@LSln7 . :.--"-1977ië5i11 ~ .... 6 1977 62:7=;=-9400520" ...._-~~t~:{-~~~:=~: ~~:
22 _______ -.=-=-~~~~ J~~~J ~~~ ~
~J~~~~;~~~.~---~
.. ---
.-ï~lS~E~=~~;.~~~I~~~~t~~~~~==~ =-~-==-u_ m!l~--i ~ iit~?
JE!".~h.!!!.9.~4!!~ _ .-!~~~.!!an_C!!!~_~aal ~.~lll~_. ____ . ____ ._. ____ ... _ . __ ._ _~~Ty~.12 ... __ ~ JJ..?! 62.:n·~~6.
Pehlcodiac River Petllcodiac River@ Sin 1 1977/05112 5 1977 52-77·9400529
3 601 56i 4'
:~I
-i51 C'("gll)_-__ J
'Û (mg/L) Cllenl-II i, "--'0"
i,,.
"
,
Appendix 2. Water qua lit y data fram the Petitcodiac watershed, 1975·1999
Appendix 2. Water quality data from the Petitcodiac watershed, 1975·1999
__ ,~ __ ~!.t.~_~l ~-_.l~_. __ ... ____ ~atlo_n _ _ . _ _ _ _ _ _ .r~!!!~~.F:Y:!.f:!<~J_ ~romD~~~~.year~%_ Num~ ~it~~f:-·~~:
- --
~~::::.~: ~~':
~~~pt!~~- ~-.'-'-- ---.-. -.~, !rf:if~~~~: -~ ---1-~:t ~:1:~~~-·-·~~~i[~~:~".- _~=_ ~~reroo~~~R~-~~.~=-=~~==-, ='.~~=~= ~~ .~~J!Ql!t~
_=.11~~? F-~f~lll='
__Rabbi' Brook Rabblt Brook near Mouth PWMG 24 24 1997107/15 7 1997 54·97·209 ~_~.~C?n-9:~k~. _ . __ .~!1~~.Ç!!!~_q~..!~~;i~PN~~~?==·~._. -·_.=.-_-~_~==3~2. :1~r~!1§.:-.-~I f~? ~:~l.i~I-__ .
!<~ltJ ]BOOjm9lLl[<;:;>Jmg'bl.19'J"QILl CI (mg/~l ]CLRA CTCU)]CONO ("SlEiC",11-9-(l.97t.fi _Cu l"SIL) jOOCmglL) CI,en,·n
- __
~!'
::: --f·-
-J~~I-·~:
-
:~-!I
-
5~
i-~
---
---f··--
~7L_
005 705 0 11- 1 72 61 3
°1~ --~-:-
- - _--:~-~~i
_
~05
-i:-11
3~
.. _~~~
_- _-~~~-~
02/si Jonathan Oeek Below Horsman Raad P'NMG 23 (enj~r;~~?--~.~- --~,d;LikepWMG22--'---'-'
--'--"-'-'--;l-}~}]-~H: --f~~~M:-97.216-·
o~~
~7~
t
--2~Jè
'6-0· -- ..~~~-.
1~
-~2~1~-~It~~~~-:~~:~~~~t~1rr~~ii~~i;~:·~ -:~~:~=~~j ~~!~~:1!~rhi~-·· ]i~!J
_5j··-:·:~~ -~~~~:
.
05·~:
-{!
:d-Pelilcodiae River PeUlcodiac River ne.,. moulh of PoIlelt R PWMG 10 10 1997/07116 7 1997 54-97-204 0.0572 36, 297 336 2.4
~![~-.~~:~ ~I~T~~~i~i~E~~~-:~-~-;~=Jd l5!~r~~~ '~~~i~-. ·~!~H
.... .
...
~~
-
.. -.
~= :-~-·~if
···lkn
~~~~~---
.. _-
~i~R~:~a:::~~~ ~Se~e~~_~_~_!2.-___ .. ----.-...
-.--{~"+:~~~~ij ---~ ~~~ ~~i:J~j.. -- --
-~..
~~. ~:,~-_ .. ---._- --
-~:~ :è~; ~:~5_._--_
...__
._._- ...__
. __ ._---- --_._-- ._--_
.. -;;:-;-- .-_._-. . . _ ... -.-. . ... - _. .._._- -- ._.- . . . -,"~_r:!l~ i=ree~~._, __ ~~ Cree~hannel _ _ . _______ ~____ 1.~10711.~ . ___ ?. ~7 ~-!?:~~._.. .0.~Q372. .-_~~ .- _ _ . ___ . __ "._. __ . ____ ? __ .. 4~.:.~ . 021
5 ~...!!I_~!!!C~!!.~!_~ W~a1I.Ct"k@Briardal~r:'WMG.n _________ ._, .. ~ 1~7107116 _,._.r~ ~_~!:-~~. __ . ___ .. ~~~~3 . __ . ~~:! _. ____ ~~:.~ ~.13. ~ ~n~.:.":v'!~!!·9~~_;aaneh:!oc:-~~~M7, ~Vd PWM9_~~. _ _ _ _ ;Z~ }:~~~~t-..
--t
~~~ ~H~~'--. . ..
-K~~::. ---
9!~~ - -4?~. -. -·91.~ ~§
~!gi~·RIvor::~=- A~nco RIver Above RI. 895 Br~~__ ===='~...!)
__
~ ~l~mc :~.·Jj~1 .}L .. .... °25BennellBrook Ben .... U Brook PWMG 8 8'1997108111 8199754-87-336 0.0156 142 2
~ïJft;;-=~-=-~=-~::::a~~~20
--~-
..
~~ ~:~::~~
:
~:~ :::~:~- ~'._'~~-~.~-~.~
-·"'"'--·~~·r~~-~----Ki5·
--
-~~--1ilii1t1R~:':::- -=~~ti!\~~~(Fowcell.Whe.lon SelI~~L.: _:=~:: .. __ . .! 1~..!~J~ __ ~i ~ ~4::~~33j-':-: ··~=(62~ _:':-··~i6i7 : .. -
-'o:.e __
~fi~~~:Rjver ----~~:=_A:.~~~~~5---··- ···-·---··-1:~t~~ -·~-~~~W~---·-·---g~·---
.,
:~~0.2
-'~~~I--~~~:~~Z=~.~~:~~@~ki~~7"~~=~~:.:::.:=:~~~~ =:~; ~ ~~~=~ ~3~~-_::-)~
~:~:~._~:
f::
:~1J
~:~=:~~~-"--~::::::~:;Wr!~h1~~~R~~d~-··- ---~~~1:~~---i ~~~~t~t_-
-...
--~g~~-------1-'
··--t:
l .POIteiïRiV.r --.---.-~1vër1kMAbOV;MOüthFiiiVMG11-'---'-- -'~---11' 1997108111 -8'~ 54=97~343----_ .. ·--ë.027-_o. - -. -- -0.7
poiT.iIRiViW-·-·-·-M~tI Rtver@Church'.Corner P'vVMG 14' ---- ---14t1997108Ï11---8 fg97~97:338- ---'6~éi262 --, . _ 8.1.4 0,06 -~ ..
o~~I-POiïaIIRlver---·-n PoII.ItRlver@Mapieton~.P'vVMG13 .----13~ aoof5:;t-97.339-- .u~-··~~ô3:f6 -·_·-~----,-11-·~.--O:05 44. - '~25
~!K River ~.= ~kvl!.. •• st ~~Iell R SeWement ~~~= ===~--1-~~,t---e 1997 54-97-340 -= :'.-~~0176
_-= ___
-·~.~~.5~ ~~_=·-o~_____
.~_..___ ___
. ____
._Ji.- .. ':~:~~~!C:k ~:-:.~r:::':U~~~G18 18~:~::~~ :~:~::~::!--
__ ..
~..
~--_-_-_-~1 ___+
.
__ . ____
~9~ 1.1~~nCt"k WeldonCrook OIS '",m Sol.." PNMG32 32_ 1997108111 8 1997 54-~~ ~~-il:O}42 --::~~'::--=·~~.4 - - - - , .
Fo)( Creek Fox Crelk et roula 1015 FYlMG 31 31 1997J08J12 8 1997 54-97·360 0.0725 87.6 0.05 Humphrel"'Blook. Hum_Blook@MiI'RdBlIdg.PNMG29 291997108112 81997 54-97·381 _...:.O~1 ~.::=)6:6 - O,QIi ~.!ï' Brook Humphreya Brook a TeH PNMG 30 30 1997toa112 8 1997 54-G!-366 0.032 51. 0,
Jonalhanërëëk-- JonathanCreekBelowHomnanRoadPNMG23 _ _ _ _ _ ~~12 81997 54-97:-i4Ç=_.0.11 ---="~=-~:~
__
--0.-Jonas Lake Jones Lake MMG 22 22 1997/08112 8 1987 54-97.35S1 0.221 66 7 1.4 ~tc!1!..1!!<.!! ~!'!. C!.."!~h Hall. Crook PNMG 28 28 1997/ot!I12 8 1997 54-97:355--· _ •• oc:ooré ... ~:':::::·~~8 .~::-.:-:.!>,<l6 ____ ._._ .... ~;~~- --
~~-~~-f~~~~~t/1u1r;c~~~~~SI
:
~::~=~~:
~~ ::~::; O~t~ _.~_._n. ___ 71~~ -~..
,+!
--.--.----~!!~~.F!i.--._ ~~oodlac RIver@ c.u-.vây ~_~_~.1.!... _ _ _ _ _ ~ .!~97108112t-8 1907Fs4:97-~-=-_ ==_~rf~5
--
---~~--25.3 .--~. _~ _=--=~.___
....
_~ .~:::!=--- ~::::::!~~:'~~~-25---.- ---.-~+::~~~~:
~:~ :~t~*--,--
0%&
-·---·----~·t~-
--'-o.~~ .----'" ·~-~o-.-- .•. -.--... _ -.-- -.-- . -.-- -.-- . - - - , - : .•... ". _ .... _ .. ---- f--._-~ '"... • . ..c •• ~=; .. -- ;;"".. . ... ".-. ... ,,";,.-.-.-... . .... -;" 2. ~2~2l-__ ._ 16.1 '2,1 -~.25r 16.1 0.25 ···c[i' 2~f" 26 Il 2500 ·0.91 -11.4 -. . 19.6i 6~8 - 0.25' -'-_ .... ________ ._--'----"~_~ _ _ _ _ _ _ _ _ _ _ . __ ~__ ~ . ___ . ____ .. _. ______ .__ _ __ . __ ._. __ . .~_". .'_ _.... ·,·1.~ 2.1
~~~l!!.I!!!.Q"~~__ Jonatha!!.Çr . . k7-Bel~~~ad~~g_~1 ____ 33 ~99710Qf14 91997 5±.~~~ _____ ._ ~E9 _ <~!,7 _.. __ .~~. 005 _?~7 _ . . . . __ .. _'.. . __ n' iftr.-R~---·---- ~ir.·~::~::'~PWMG 17 ---.-~ ~~~~: - - : ~:~ ~1fe-'-
-...
~ -o%~.__
._~4 - --... _~~.~ ._- . ~-~ ·i1~~ '.~ ".6.~~· -:-0~2~1~~=~~=~
..
:::::=:=::g:;n;~t!~~~-==~.
----:
';:~=;~_-=--1 ~::~ :~~:=~ ~~~~J:~~-~~:~.~~:=_~
~.~.~~;!
:~~=.-:_~~~'J~
..
~.~~.=~~~..
'-21~'-Millereek Mill CreekbelowreservolrPWMG20 20 1997/09J14 9199754-97-429 0.107 22. 11.1 281 0.7
8:
8 8. 91 7 8 "8400c 1-5 9" 9 .•
'7.NOrth ëf&neh HallsOee Nor1h BranchHailaCrMkPWMG 28 ----281997/OQ/14 0199754-97430· '-'0.0461 -"--·87.1 -22~1 ---197· . - - .. -{"-- 8':'
·Norlh~iY.r-==-=- North Rlv.AboveRie 886 BtldaePWMO6 __ .==~~ .1997109114 -'9 1~7 64-97~-- _~=~~:.~2 -_==:~=--~~:4
__ . ___
~.__
.~___ .
~~:.~-=.=·_"29.7 ~-·_·_--o:- ~__
-9:~itcodia.:c_~!" __ .... PeUicodiac Rlver@ CII!:JNWal Fi~.ï.PWMG 2~__ __.?1 1997/~14 9 1997 54-97:!4..Q___ _ ___ 0~2? . ______ 3.~ ________ .~: 1 ._".}~_~ _._. __ .Q:!, _ . ___ .. _.~.:~
P.Uleodiac River Petltcodlac River Abova French Brook PWMG 15 15 1997109114 9 1997 54--97-437 O. 33 1.1 28 1.4 ~~~[~~l~==- P~]fcOdiac RIver Selow Rie 112 ~~MG~ .-~~_ _=~_~-=16 ~7roaï~
=1"
~7 ~~i-.~~_~· .. ~ ~~.'~.]:Q~_~ ~·~:~ .. ~·:~·~~4 -~-==. ~---.- __
~:-. :_:=~~? Q~. -".~lItcodl~~.jy!!'_~._. __ ~ilcodlac River near mouth of PtWleU R ~.~9....!QJ!.,:,."lrll _ _ . ___ . .!~ 1997/0911.:4 __ ~ 1997 _ _ .__ ~'~.!~~~ _ .. 1~;~~~J _~:,,!3~~~333 ? .. ~:?.3.~3~? __ .. . ____ ~:.~ .
Pon.n River PoII.1t Rivel1km Above Moulh FYlMG 11 11 19971OQ114 9 1997 54-97-441 0.021 le,. O. 7.6 1.4
~l!~B!Y.~~ .-_ .. ~ -~~~_~Iv!!.@_~_~~~~NII ~MQ_ ~~=-=~. -.--.~-=~ .!~?!~~~ __ .~ .~~~ .~~~-=~. ~ .-= -·A·~i_f~ _ ~ ·~~~:83
_. __
~--2]6 ~~~-.. - .. ~_IJ .... '--_.}.~~" -9Appendix 2. Water qua lit y data trom the Petitcodiac watershed, 1975·1999
10;:"_,, '~f=""">--1 __ "_,, _c. __ u_. _. ft_,,_,:,,~-!U~... u' _ .... f t . _ • ·---f"''''~!:!'~~~~=:.1 ""'''~I :_-::'I.':,"";;';~~~+~ .,,~
",
Appendix 2. Water qualitydata fram the Petitcadlac watershed, 1975·1999
Appendlx 2. Water quality data from the Petitcodiac waters.hed, 1975·1999
_______ @Pocll1ç
Appendix 2. Water quality data from the Petitcodiac watershed, 1975·1999
Appendix 2_ Water quality data from the Petitcodiac watershed, 1975-1999
ri.
~il~~~2~~t~Bf=?""?l~''''''~'~I''~'~''''~~;''''F'=r=t'''..,~r'-LI ~'"'"
1~,.",
1
---1-.~a (~gJL}-.\NH3! ~mg~L)t.i ~~!lUN02 (mgJL)
---1·· ... - ,- -t--'!ll:f1~!. qr~~. _ .. .T.~.I!...~~k .. @~_n j ... ,_ .. _. ______ . __ "!,u~I.,~i< "_._ !~.I.~~~_@._~~,~. ____ . ___ . T,:,~I~_ç:~_ . ___ .. !1!':1!~<?,~jJt~.'.'!_3 ___ "_"_._. __ .. ~!I!~~i!.C.~_. . ~~~~B!'L~jlSJn_2_ .. _ ~!!~!C!?~!~.~Iy~. _ ... ~I.i!~~~~@_~!~_~. ___ " ~~~~~~.!3~" ___ .... ~.!..~~~~.tlL~t!'_~. __ . __ . ____ ~. i:~ir~kRiv.~..
~*-~~~~-r~7_-Türti. Creek' --- _. Turt~ Creek (â) SIn 2
T~rti~Ç!~.~:_ .. " --~ .. T.~!! Cree~_@LSJ!'_~" __ ~ __ . ___ . !:4!!!!_~~~_. " " .. _____ . !"!~I!_~~~~~. _______ ... " ___ . __ . ______ . !i~.I!.~ __ . _ ... H_a!~~.~!_'œ~~_~ .. " ___ ._ ... __ . __ ". ~1!!'~Bt:~k.__ ' ... ~!I.I!.~_k..@..§t.~_~ ______ .. _ _ . __ . " .tI~I!.~~J<_.__ ... "1"!.~ls Sr~.! ~t.~~ _______ . __ . __ • _____ ,_" __ . .~~IL~~"._._ . __ ... !j~I, Br~~ __________ " ____ . __ . __ ... _
:!.o~~n ~ __ ._ _ ~~nath~._Creefl:_LH!!d Of !.O!'!~.~.!_~ ____ . ___ . __
.~!.'8~~!:L9..~"_ .. __ . __ J~'!.'~_~~.~ __ . ____ . __ . ______ .
f!~:~~-::~:~~~I!~~~~~!~_~~~~-~~:l-=:=~~~~t=:~=-:_
~~~8!:I.Q!M'_~ _____ ._. Jonathan Creek Pa" ~~ _ _ _ _ _ .. ___ ._. ~:= ----~ ~;::::~;t---.----!"Ialla ~~ _ _ ~!!Srook @81n4
Halls Jl!ook ______ !:!alis Brook@ Sin 5 _ _ _ _ _ _ _ _ _ _ _ _ j ________ ---+---f-- ___________ _
~e:~~==~~---.-~.--
..
~:li_~--- ~~::::: ~
::ë~!T---Jonlth80'
Cr_,,·---Jonathan Creek--~PëiiïêOc:tlac R"rier--
---!'Oii~IR~~ __ --:-~~-=e:ë.."
-.- ..
wu, ,1-~::: ::~
--
~ :~!---
r--'-jo:;;alhan Creek Jonalhan Creek @ Head Of Jones Lake
~onaïhï'-néiHk=-"':~~ ~an Creek Put BIfry ~.'!L _ _ _ . ______ _ ÇOVerdait Rivel ____ Coverdale RIver@ stn 1 . .
~liIcodlae River . ___ Pelltcodlac River @ SIn 1 _ . ._._ ___ ____ 0 _ _ •
._---~
1-1
~--/~~j,-":::,,,
-
---~~_::-:-_--r
1 " "--]
... ,--- ,--- - - - - --+---j - - -... ·-··~-~··2.ô4! --_."'ï.2ë;'--1---,---1---,- f---+---t~~~~._- ~~~J~---_-_--=-=--=--=---=-~~~ o~-=--=~:=~:
~~.~ ~:e=~t~~------.---Halls Brook -. Hall. Brook @ Sin 2 .~ - ---+---,-j---1--- ---\
,...falls~-___ Halla Brook ft) Sin 4 _.
PeIit<:Odlac River
PelilçodiK"RNer
---PoII,U Rtv.,.---' Jonathan Oeek
:~::
=
~:::-.9o.c
NJOVe~mHW8r
tJonathan Creek Jonathan Creek Below P.-k Culvefta JonIChan Cree-k - - - Jonalhan Creek Below Park Cutverls Jonathan Creek - - Jonathan Creek Betow Siormsawar
~~alhan ~_ .. _~ Jonathan CrNk Put Berry Mili.-==--====-~--=-~t---_.j
________ .
!J:=f~=~
__
~, !E.~=I==-==~=~=~=--=~=:-l==
~;~~=~ .~~.~
..
~. ~~:: :;~! --~~~
_
_==__===_~=~·~-_t~~_=~~~=~_.
Ç!o~~!!!B!V!'. __ ~aI'R~jJl~~"_. __ . __ ._._._._ .. ____ ... __ ..
~!~~_ n ____ •. _ H~ls~@Sln4 ._n. _____ ._",. __ . ______ .
Pelilcodlac: River Petitcodiac Riv. ai) St" 7 fiéiïîêOdi8c "RiVëi - Peliteodlac: River @ Sin 7 Tl.irti'ëréë"k _.- - TurUeCreek.- ... • .. H!i.!!.~_I~~~~ ______ Halls ~k Halls Brook Jonathan-cre.T-·· Jonaiîï8fiQMk-"-JOnathancrêëk" _. '--PeliicOdf8ë"Riiier