Service Life of Shotcrete
Investigation on the effect of set accelerating admixture
Mémoire
Fabio Galli Rodrigues de Melo
Maîtrise en génie civil
Maître ès sciences (M.Sc.)
Service Life of Shotcrete
Investigation on the effect of set accelerating admixture
Mémoire
Fabio Galli Rodrigues de Melo
Sous la direction de :
Marc Jolin, directeur
Benoit Bissonnette, codirecteur
Résumé
Le béton projeté par voie humide est une méthode de mise en place très populaire dans la construction de tunnels et le soutènement de parois dans les mines. L'utilisation d’un adjuvant accélérateur de prise offre des avantages significatifs en gain de productivité et pour la sécurité des travailleurs pendant la réalisation du travail.
Cependant, l’effet de ces adjuvants, et particulièrement leur dosage, sur la durée de vie du béton projeté est mal compris et souvent négligé. Le dosage de l’adjuvant en chantier est souvent élevé, ce qui a pour conséquence de faire augmenter les coûts de production et réduire la qualité du béton.
Cette recherche a pour objectif d’étudier l'influence de l'utilisation des accélérateurs de prise sur la durabilité du béton comme matériau, en considérant les particularités du béton projeté et en profitant des avancées faites en matière de prédiction de la durée de vie des bétons conventionnels. L’effet d’un adjuvant accélérateur de prise (à différents dosages) à base de sulfate d’aluminium (A/$)sera étudié. Les résultats permettront d’améliorer la qualité des applications de béton projeté dans l'industrie de la construction et les devis qui, chaque jour, sont plus exigeants et requièrent des performances de plus en plus élevées.
Les données générées à partir des différents essais réalisés sont très intéressantes, car elles démontrent la complexité d’une telle étude à cause des changements non proportionnels des caractéristiques du béton avec différents dosages d’accélérateur de prise. De plus, les données générées illustrent bien l'influence de l’adjuvant accélérateur de prise sur la qualité du béton.
Abstract
Wet-mix shotcrete is a widely used placement method in tunnelling and ground support. The use of a set accelerating admixture provides significant advantages in terms of productivity gains and worker safety during work progress.
However, knowledge about adverse effects linked the use of set accelerator admixture (and particularly its dosage) is very limited. Indeed, dosage control is sometimes overlooked on the job site or the accelerator may be misguidedly overdosed, with the consequence of increasing costs and reducing the quality of the in-place shotcrete.
The goal of this research is to study and better understand the effects of the use of set accelarating admixture on the durability of concrete as a material, starting with the particularities of shotcrete and taking advantage of the latest tools in modelling service life of conventional concretes. An alkali-free set accelerating admixture (at different dosages) based on aluminium-sulphate salts (A/$) will be investigated. The results will help improve the quality of shotcrete applications in the construction industry, and specifications which are increasingly demanding and require ever-improving performances.
The data generated from the several tests performed is very interesting, because it shows the intricacies of such an investigation due to the non-linear changes of concrete using different set accelerator dosages. It also demonstrates clearly the effects of using high dosages of set accelerating admixtures on the quality of shotcrete.
Table of Contents
Résumé ... iii
Abstract ... iv
Table of Contents ... v
List of Tables ... viii
List of Figures ... ix Dedications ... x Acknowledgments ... xi 1 Introduction ... 1 1.1 General Information ... 1 1.2 Objectives ... 2 1.3 Organization ... 3 2 Literature review ... 5 2.1 Introduction ... 5 2.2 Shotcrete ... 5
2.2.1 Two Different Processes: Dry Mix and Wet Mix Shotcrete ... 6
2.3 Mixture Design : Pumpability and Workability ... 8
2.4 Concrete Durability ... 9
2.5 Transport Mechanisms ... 11
2.5.1 Ionic Diffusion ... 11
2.5.2 Permeation ... 12
2.5.3 Capillary Suction ... 13
2.5.4 Combined Action of Transport Mechanisms ... 13
2.6 Service Life Prediction ... 14
2.7 Set Accelerating Admixture ... 14
2.8 Conclusion ... 18
3 Method, materials and tests ... 19
3.1 Materials used ... 19
3.1.1 Pre-Packaged Shotcrete ... 19
3.1.2 Mixtures Designs ... 19
3.1.3 Constituents ... 21
3.1.4 Admixture and Dosages ... 22
3.2 Fabrication and Sampling ... 23
3.3 Tests Performed ... 25
3.3.1 Fresh Concrete Testing ... 25
3.3.2 Hardened Concrete Testing ... 27
3.3.3 Observations... 31
3.4 Shotcrete Production ... 31
3.4.1 Interval between spraying sessions ... 31
3.4.2 Concrete Projections ... 31
4 Results ... 35
4.1 Fresh Concrete ... 35
4.1.1 Slump (ASTM C 143) and Air Content (ASTM C 231) ... 35
4.1.2 Setting Time ... 36
4.1.3 Temperature Evolution ... 38
4.2 Hardened Concrete... 44
4.2.1 Concrete Compressive Strenght ... 44
4.2.2 Volume of Permeable Voids – ASTM C 642 ... 44
4.2.3 Drying Shrinkage and Concrete Expansion ... 45
4.2.4 Durability Related Tests ... 47
4.2.5 Freeze-Thaw – ASTM C 666 and The Microscopical Determination of Parameters of the Air-Void System in Hardened Concrete - ASTM C 457 ... 50
4.2.6 STADIUM® Testing ... 52
4.2.7 Pore Solution Extraction ... 54
4.3 Conclusion ... 54
5 Analysis and discussion ... 55
5.1 Introduction ... 55
5.1.1 Set-Accelerator Dosage and the w/b Ratio ... 56
5.2 Capillary Suction ... 57
5.2.1 Ponding Test ... 58
5.2.2 Volume of Permeable Voids ... 60
5.2.3 Freezing and Thawing ... 60
5.3 Ionic Diffusion ... 61
5.3.1 NT Build 492 ... 63
5.3.2 RCPT ... 64
5.3.3 Carbonation ... 65
5.3.1 Migration and Permeability Coefficients – STADIUM® Lab ... 66
5.4 Permeability ... 68
5.5 Hardened Concrete Characteristics ... 68
5.5.1 Mechanical Resistance ... 69
5.6 Paste Characteristics ... 71
5.6.1 Pore Solution Analysis ... 71
5.7 STADIUM® – Calculations ... 72 5.8 Conclusion ... 79 6 Conclusion ... 81 6.1 General Conclusions... 81 6.2 Recommendations ... 82 BIBLIOGRAPHY ... 85
Appendix 1 - Cement, Aggregates, Silica Fume ... 89
Appendix 2 - Set Accelerating Admixture ... 93
Appendix 3 - Concrete Pump ... 95
Appendix 4 – A10 Accelerator Pump Data Sheet and Calibration ... 99
Appendix 5 - Flowmeter Calibration ... 101
Appendix 6 - Pore Solution Extraction Procedure from Modified Die Set ... 103
List of Tables
Table 2.1: Comparison of dry-mix and wet-mix processes ... 8
Table 3.1: Grading limits for combined aggregates (ACI, 2016) ... 20
Table 3.2: Reference mixtures: wet-process mixture composition ... 21
Table 3.3: Pore solution extraction specimens age. ... 31
Table 4.1: Results on fresh concrete ... 35
Table 4.2: Setting time results (ASTM C 1117) ... 36
Table 4.3: Compressive strength. ... 44
Table 4.4: Volume of Permeable Voids. ... 44
Table 4.5: Durability parameters. RCPT, NT-492, STADIUM® tests: Ionic diffusion and Permeability coefficient. ... 47
Table 4.6: Ponding test (3 months exposure) ... 48
Table 4.7: Accelerated Carbonation penetration depth (3 months exposure). ... 49
Table 4.8: Freeze-thaw test results. ... 50
Table 4.9: ASTM C 457 Air void system in hardened concrete results. ... 51
Table 4.10: Pore solution analysis ... 54
Table 5.1: Paste volume and w/b probable modification due to set accelerator dosage. ... 56
Table 5.2: Capillary suction performance ... 58
Table 5.3: Ionic diffusion related tests performance ... 63
Table 5.4: Hardened concrete characteristics ... 69
List of Figures
Figure 2.1: Typical Dry-mix shotcrete set-up. ... 6
Figure 2.2: Typical Wet-Mix shotcrete set-up. ... 7
Figure 2.3: Ions diffusion. ... 11
Figure 2.4: Permeation. ... 12
Figure 2.5: Capillary absorption. ... 13
Figure 2.6: Calorimetry curves of two different concentrations of aluminum - sulphate based accelerator (Juilland, Galluci and Lindlar, 2012)... 16
Figure 2.7: Pore radius of cement paste measured by mercury intrusion porosimetry (MIP) (Lagerblad, Fjällberg and Vogt, 2010) ... 17
Figure 3.1: Putzmeister short rubber nozzle. Adapted from (Burns, 2008). ... 24
Figure 3.2: Flowmeter. ... 25
Figure 3.3: Thermocouple. ... 26
Figure 3.4: Concrete and Admixture pump pressure variation. (adapted from Chapdelaine 2007) ... 33
Figure 4.1: Setting Time OPC Series. ... 37
Figure 4.2: Setting Time SF Series. ... 37
Figure 4.3: Temperature evolution and setting time. ... 38
Figure 4.4: Temperature evolution and setting time. ... 39
Figure 4.5: Temperature evolution. OPC Series (Thermocouple)... 41
Figure 4.6: Temperature evolution. SF Series (Thermocouple). ... 42
Figure 4.7: Drying Shrinkage OPC Series... 46
Figure 4.8: Drying Shrinkage SF Series. ... 46
Figure 4.9: Ponding Test – 3 months. ... 48
Figure 4.10: Accelerated Carbonation test (3 months). ... 49
Figure 4.11: OPC 6% freeze-thaw test terminated at 36 cycles ... 50
Figure 4.12: Ionic diffusion coefficient (STADIUM® Lab). ... 52
Figure 4.13: Drying test (STADIUM® Lab): 10 mm height specimens. ... 53
Figure 4.14: Drying test (STADIUM® Lab): 50 mm height specimens. ... 53
Figure 5.1: Example of ponding test specimens. One of them with visible compaction problem. ... 59
Figure 5.2: RCPT ASTM C 1202 results. ... 65
Figure 5.3: STADIUM® environmental exposure conditions (STADIUM® software) ... 73
Figure 5.4: OPC series - Service life prediction ... 75
Dedication
God and my family.Acknowledgments
I would like to thank my teachers for the knowledge they shared, the inspiration and the support during this journey, especially to Marc Jolin, Benoit Bissonnette and Josée Bastien. Thank you to all my colleagues of the CRIB, without your essential support this work would not have been possible, especially to Jean-Daniel Lemay, Mathieu Thomassin, Alain Melançon, Lyne Dupuis and Nicolas Rouleau. Thanks to my office partners which always found a way to support me through: Pasquale Basso Trujillo, Isabelle Fily-Paré, Antoine Gagnon, Roxanne Ouellet, Félix-Antoine Villemure and all the other students which made this journey lighter and created an excellent work environment. Thanks to Leandro Sanches, Nicolas Ginouse, Patrick Power and Andrea Rodrigues for the inspirational words, professionalism models and help in desperate moments.
Special thanks and gratitude to my wife and family, who always supported my dreams.
1 Introduction
1.1 General Information
Shotcrete is an efficient concrete placement method providing different technical solutions and allowing to build concrete structures without formwork, such as tunnels and other ground support structures.
The use of set accelerators in shotcrete is widespread and often has a significant technical contribution, as it prevents fallouts during shotcrete placement in vertical and overhead applications. It also reduces execution time and facilitates work progress. The use, and sometimes overuse, of set accelerating admixtures has an impact on the hydration process and consequently concrete characteristics will be modified. Presently, there is a lack of data available about how set accelerating admixtures modifies hardened concrete durability.
The dosage of the accelerator is often not properly controlled during shotcrete applications: although its increase provides faster setting time and higher initial strength values, it increases the cost of the concrete mixture and has variable effects on long-term mechanical and durability properties of concrete.
The focus of the project is the investigation of the properties of shotcrete with the use of a set accelerating admixture, with special attention to the evaluation of test results using a state-of-the-art approach to concrete durability and service life prediction. The approach of this project is to:
• Use a typical wet mix shotcrete mixture design and a typical application procedure with different dosages of an alkali-free set accelerator based on aluminum-sulfate salt (A/$).
• Investigate the mechanical and durability properties of the different shotcretes and compare them to a reference mixture that contains no set accelerating admixture. The investigation will be as extensive as possible, allowing for a
thorough understanding of the effects of the set accelerator admixture. • Verify the service life of concrete elements using an advanced modelling
approach on each mixture produced for selected aggressive environmental conditions.
This will ultimately lead to mix-design recommendations, reduced costs, and correct use of set accelerators, which would increase performance and provide for reliable structure design and execution. In an era of sustainable development and increasing long-term requirements for new structures, durability and service life are of prime importance, considering the high cost of structure renovation and maintenance. This research will help to improve the understanding of shotcrete durability parameters, and also to further advance this placement method to meet the highest standards of the construction industry.
1.2 Objectives
The main objective of this research is to investigate the effects of one alkali-free set accelerating admixture on wet-mix shotcrete as it relates to durability characteristics and service life performance of shotcrete as a construction material. This is done by using conventional knowledge with regards to concrete durability and apply it to shotcrete with its particularities, resulting in a better understanding of shotcrete durability and service life, and improvement of its long-term performance.
As a secondary objective, create awareness of the changes, and possible quality loss, of hardened concrete properties caused by the use of this admixture. The investigation voluntarily includes high dosages of admixture (or overdose) as it is unfortunately a practice found at the industry.
1.3 Organization
This document is divided into 6 chapters. Chapter 1 presents the introduction, the project framework and scope. Chapter 2 offers a literature review, focusing on the principal characteristics of shotcrete and on the durability and service life evaluation references. The third chapter details the samples preparation, experimental program, materials used and the importance and significance of each test. In Chapter 4, all test results are presented with a description of the experimental phase and observations. In light of the literature review and the shotcrete characteristics, the fifth chapter presents the analysis of the results obtained. The final chapter presents the conclusions and a summary of recommendations, the progress made through this research and some new research opportunities.
2 Literature review
2.1 Introduction
This literature review highlights some of the most important characteristics of shotcrete. It is followed by a review of factors and properties affecting durability and shotcrete service life. The last sections are dedicated to the set accelerating admixture and its effects on concrete hydration and microstructure.
2.2 Shotcrete
Shotcrete is a unique method of concrete placement which uses compressed air to accelerate and spray the concrete, providing enough energy for placement on vertical and on overhead surfaces. The velocity imparted to the material compacts it on the surface and gives the hardened concrete its particular characteristics. The major difference between conventional concrete and shotcrete is the placement method.
Shotcrete has a wide range of uses such as swimming pools, tunnel primary support and/or final liner, concrete repair and strengthening, curved structures or shear walls. A principal advantage is that very little, if any, formwork is necessary. It can be used as a support system during excavation work as it bonds well to different surfaces such as earth, rock, old concrete and brick. Low water content and high placement velocities ensure good bonding, excellent compressive strength and proper consolidation.
Characteristics of the equipment play an important role in shotcrete as they define placement parameters such as speed, compaction and production rate. Also important are the concrete mix design, airflow and nozzle operator experience. The last is significant to ensure the quality of the in place material, for this reason the Guide to Shotcrete (ACI, 2016) recommends using trained and certified nozzle operators.
The ideal method to test the material is to extract samples by coring or by saw cutting large test panels of sprayed material. Indeed, small specimen production is not recommended because rebound can get trapped in the bottom of these specimens.
2.2.1 Two Different Processes: Dry Mix and Wet Mix Shotcrete
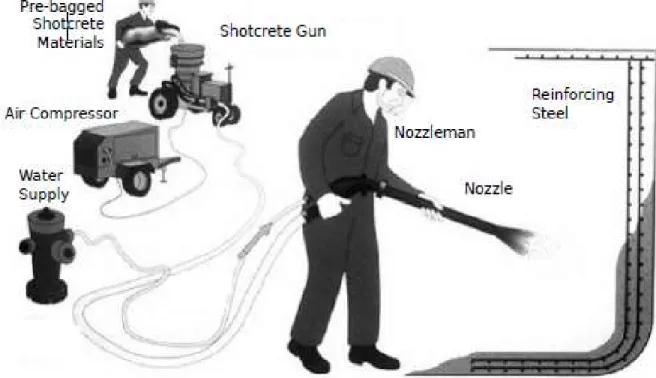
In the dry-mix process, dry material is transported using compressed air to a nozzle where most of the mixing water is added. This system provides some advantages such as rapid and easy start and stop operations and easier handling due to lighter hoses. However, one disadvantage is the lower output volume. The water is added directly at the nozzle and is controlled by the nozzle operator, resulting in an, a priori, unknown water to binder ratio (w/b). Figure 2.1 illustrates a typical set-up for dry-mix shotcrete.However, this research project will concentrate on the wet-mix shotcrete process which uses a conventional concrete that is pumped with the use of a positive displacement pump. Velocity is imparted to the concrete through a hose at the end of which compressed air is introduced through the nozzle. It is at this stage which accelerating admixture can be added to the material. Advantages of this system are an absolute control of w/b ratio, low rebound, and a higher production volume. However, disadvantages are heavier hoses, the high volume of mixed concrete needed and the continuous nature of the operations due the fresh mixed concrete inside the pump and transport lines; stopping the application means cleaning of all equipment before concrete setting time. Figure 2.2 shows a typical set-up for wet-mix shotcrete with the set accelerator option added for illustration.
Additional advantages of both techniques are: saving in formwork costs, applications on curved structures, overhead placement, rapid ground support systems. The main disadvantage is the loss of material due to rebound (Banthia et al., 1997) (Ginouse, 2014). Table 2.1 compares dry and wet-mix shotcrete processes.
2.3 Mixture Design : Pumpability and Workability
Workability of shotcrete depends on several combinations of parameters. The fresh concrete must remain stable during pumping, without segregation or pump blockage events (Burns, 2008) (Jolin & Melo, 2014). The shotcrete also needs to be properly placed with the lowest slump as possible, in order to obtain a thicker layer without fallouts. These somewhat opposite requirements often lead to the use of superplasticizer admixture for a highly workable mix for pumping and the addition of set accelerating admixture at the nozzle to stiffen the in-place mix during spraying (Jolin & Beaupré, 2004).
During the pumping process, concrete is subjected to high pressures, especially through hose diameter reduction, creating stringent requirements for the shotcrete
mix design. Passing through the reducer requires constant reorganization of the aggregates without segregation or bleeding and an adequate volume of cement paste which lubricates the aggregates to ensure its stability within the mixture (Kaplan, Larrard & Sedran, 2005). An appropriate aggregate distribution is of the utmost importance in reducing void space and increasing the volume of available cement paste to work as a lubricant (Burns, 2008).
Several well-known researchers have studied concrete pumping behaviour (Fuller & Thompson, 1907; Dinger, D.R. Funk, J.E., 1994) and all have a focus on aggregate size distribution, viscosity and yield strength of concrete to predict the concrete pumpability. On the one hand, if the fresh concrete is too firm, aggregates do not rearrange well during pumping, creating pumping blockage. On the other hand, if the fresh concrete is too liquid, it lacks stability and during the pumping movement, the cement paste will filter through the aggregates, also creating pumping blockage.
In order to increase the stability of the fresh concrete, the use of supplementary cementing materials (SCM’s) is a common solution, increasing the volume of binder paste and reducing slump of fresh concrete (Jolin et al., 1999). These two characteristics improve pumping and result in a more stable concrete during spraying, also reducing rebound and improving built-up thickness. Overall improvement of durability is also well documented (Papadakis 2000, Neville 2008), showing improved resistance to freeze-thaw and improvement in reducing chloride ingress.
2.4 Concrete Durability
Durability can be defined as the original or expected designed characteristics of a material exposed to a given set of environmental conditions over time (ACI, 2013). In concrete technology, durability can be looked at through the life cycle analysis where materials used in a structure perform their designed function without major
maintenance, or with planned interventions to maintain their original performance. According to Nilsson (2003), life cycle is : “Time at which the infrastructure reliability accomplishes its functions without a major rehabilitation. It can be extended through the use of maintenance and repairs.”
Concrete structures are usually designed to provide long-term safe use for the public, taking in consideration materials strength and behaviour under different loads. However, it is seldom explicitly considered how materials will resist exposure to aggressive environmental conditions such as freeze-thaw cycles and exposure to chlorides other than through concrete mix-design specifications.
Concrete durability is influenced by a number of variables, including exposure conditions such as : humidity, temperature, exposure to aggressive agents (salt, water, sulfate) and material properties such as: w/b ratio, type of aggregate, cement paste volume and quality of the cement paste system. This makes specification of concrete properties sometimes difficult and challenging for concrete exposed to severe exposure conditions.
Performance-based specifications could then be considered, as they offer a holistic point of view of the concrete mix design considering not only the mechanical properties but also some of the aggressive environmental exposure conditions. These performance-based approaches are based on the resistance to expected degradation mechanisms, such as chloride - induced corrosion, lixiviation, carbonation and sulfate or magnesium attack (Glasser, Marchand and Samson, 2008).
These are all well-known and extensively studied problems; a good understanding of the mechanisms involved in concrete degradation is key for future optimization. Such mechanisms, called transport mechanisms, are highly dependent on the movement of water and other agents in the porosity of the concrete.
The following section presents the transport mechanisms which can be used to model transport phenomena in concrete.
2.5 Transport Mechanisms
For a better understanding of how degradation occurs in concrete, a good understanding of the transport mechanisms taking place is necessary, as the movement of aggressive agents though the hydrated cement paste is what ultimately controls service life (Jolin et al., 2011). Hydrated cement paste pore network is key to transport mechanisms (Bolduc, 2009). The porosity characteristics such as pore size distribution, its tortuosity, its connectivity and its volume, control how aggressive agents enter in the concrete and which transport mechanisms will be dominant.
2.5.1 Ionic Diffusion
Ionic diffusion (Figure 2.3) is the phenomenon of molecular movement from a high concentration region to a low concentration region until molecular equilibrium is reached. This phenomenon is applicable both to liquids and gases. The Brownian motion describes the constant and random movement of ions and the movement from regions of higher ions concentrations to regions with lower concentrations.
A common example of ionic diffusion is the movement which occurs during the re-equilibration of the relative humidity of the surrounding ambient air and the humidity inside the concrete porosity. Another example is the CO2 gas in the atmosphere in
contact with the pore solution inside concrete that is gradually dissolved to reach concentration equilibrium. Ionic diffusion applies to chemicals other than water. Ionic diffusion is usually considered a slow process and dependent on the concentrations of the ions considered and on the local conditions. For example : carbonation is a ionic diffusion-driven phenomenon and tests demonstrated it is faster in a 50%-70% RH environment (Turcry and Oksri-Nelfia, 2014), where there is enough water inside the concrete allowing ionic diffusion of CO2 ions combined to
favorable conditions for the chemical reaction.
2.5.2 Permeation
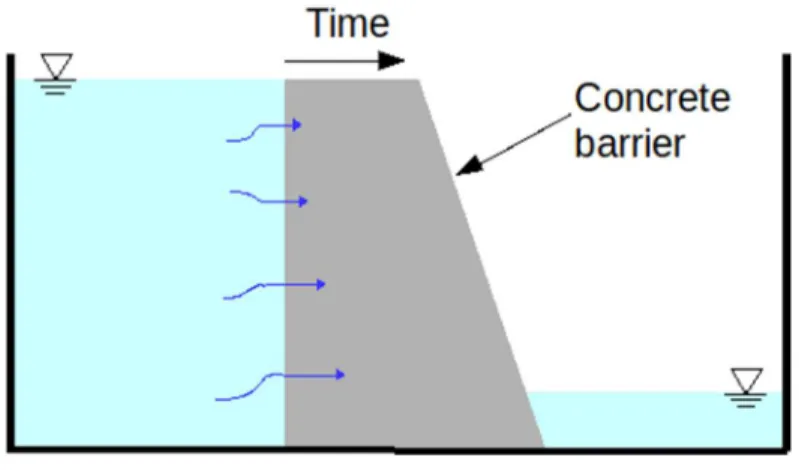
Permeation is the movement of liquid, through concrete for example, generated by a pressure component. In general, it is a slow velocity process depending on the pressure gradient and the volume of interconnected concrete pores (Courard, 1999) (Figure 2.4).
2.5.3 Capillary Suction
Capillary suction is the movement of liquid generated by capillary forces due to surface tension of the liquid and a solid surface (Figure 2.5), its action is almost instantaneous. It mainly takes place when concrete with dry capillaries comes in contact with liquid water. The quality of cement paste could be measured by the volume and interconnection of pores. The more connected the pores are, the more easily accessible to external aggressive agents the concrete is (Neville, 2008).
2.5.4 Combined Action of Transport Mechanisms
The description of each different transport mechanism makes it easier to understand and visualize these phenomena, but liquids and air ingress into concrete is driven by coupled mechanisms. In other words, aggressive agents enter inside the concrete in a complex way, as two or more mechanisms may act at the same time and not necessarily in the same direction. For example, during periods of intermittent contact with water phases, the liquid enters inside concrete by capillary suction or permeation, carrying different ionic phases, such as chlorides, inside the concrete. Upon drying, the concrete loses water, leaving behind different ions which will then
move inside the concrete by an ionic diffusion mechanism if the conditions are favorable. These combined phenomena make prediction of service life quite complex; the next section presents one approach available to be used in this project.
2.6 Service Life Prediction
The STADIUM® service life Prediction software is used for service life prediction and uses complex and advanced mathematical modelling for an analysis.
Service life prediction software such as STADIUM® use a modelling system which considers concrete material characteristics (based on experimental test results, mix design proportions) and exposure conditions of a specific structure to predict the ingress of aggressive elements in the concrete.
As an input of the model, it has the specific characteristics of the concrete tested: ionic diffusion and permeability coefficients, saturation of concrete at 50% relative humidity and as an output the prediction of service life whether corrosion starts with, or without, maintenance of the structure (Simco Technologies, 2011).
2.7 Set Accelerating Admixture
The use of set accelerating admixture in shotcrete improves the bond of shotcrete to the substrate during overhead spraying and makes it possible to increase build-up thickness. It allows faster progression of excavation work by increasing compressive strength in the initial hours after placement. The safety of the workers increases due to reduction or elimination of fallouts. (Prudencio, 1998)
Problems related to the addition of set accelerator admixtures to shotcrete was demonstrated by Bessette et al. (2001) during an experiment with different dosages (3%, 5% and 7%) of Aluminium-Sulphate (A / $) salt based type set accelerator admixture (different commercial admixture from the one used in this research). Strength tests at 7, 28 and 56 days measured on cores taken from shotcrete panels
during this study resulted in a loss of compressive strength of 20% to 25% when compared to the plain mixtures (with no use of admixture) and a reduction of scaling resistance when exposed to de - icing chemicals ASTM C 672 test. Clearly, the use of this type of set accelerator admixture changes more than the setting time or the initial compressive strength of shotcrete, decreasing concrete strength and durability resistance. The result is a distinct hardened concrete to that of the plain mixtures. Nowadays, A/$ based set accelerator admixtures are practically the only ones used for wet-mix shotcrete. This type of set accelerators are commercially known as alkali-free set accelerator. They create an immediate hardened or gel porous structure before regular cement hydration starts, giving shotcrete an immediately hardened appearance and changing the fresh concrete characteristics. Basically, the set accelerator reacts with the fresh cement paste and produce enough ettringite crystals to very rapidly stiffen the concrete.
A regular clinker cement is composed of four main minerals C3S (alite), C2S (belite),
C3A (calcium aluminate) and C4AF (ferrite) and the addition of CaSO4 (calcium
sulphate - gypsum) in order to regulate the workability of fresh concrete. The addition of A/$ set accelerators could result in an undersulphated type of reaction. The Al3+
and SO42+ ions from the accelerator and C3A hydrate from the cement support the
immediate reaction forming ettringite that will fill up the pore spaces and will provide early age strenght development (Paglia, Wombacher & Böhni, 2001; Maltese, Pistolesi & Bravo, 2007). The reduction of available water from this reaction (lots of H2O in ettingite) and the rapid increase of the solid phase determine the short setting
time.
Figure 2.6 shows the calorimetry curves of a concrete mix with two different non commercial set accelerator admixtures during the first 24 hours of hydration.
The curve of the low A/$ ratio set accelerator demonstrate a regular type of hydration reaction where the first heat generation peak is that of the dissolution of C3S and
ettringite formation. After a dormant period the second heat generation peak, moment that corresponds to exhaustion of sulfate phases and C-S-H formation. The curve of the high A/$ ratio set accelerator result in an undersulphated type of hydration reaction, with the early exhaustion of sulphate phases. In this case, a different second peak of heat generation representing the aluminate phases reaction is observed prior to silicates phases reaction. Due to the sulphate unbalance, the smaller third peak takes place after a dormant period representing the silicate phases (C3S and C2S) hydration. Due to reasons not well understood, in the case of
high A/$ ratio accelerator, the aluminate phases (C3A and C4AF) hydration reaction
damage or limit the silicates hydration that are responsible for the formation of C-S-H gel and CC-S-H (portlandite) and for the concrete mechanical strenght (Juilland, Galluci
Figure 2.6: Calorimetry curves of two different concentrations of aluminum - sulphate based accelerator (Juilland, Galluci and Lindlar, 2012)
& Lindlar, 2012), (Paglia et al., 2001).
The cement hydration will progress differently depending on the dosage, the concentration or the chemical composition of the set accelerator used (Juilland, Galluci & Lindlar, 2012). Recent studies demonstrated that the potential results for the undersulphated reactions type scenario is a deficient hydration cement paste with more porous and a weaker bond between hydration products. Results of a mercury intrusion porosimetry (MIP) test (ISO, 2016) show different pore structures (Figure 2.7), likely caused by a late hydration in an already stiffened paste (Lagerblad, Fjällberg & Vogt, 2010).
Since the hydration reaction start by alkali-free set accelerators directly affect the concrete microstructure (Wang et al., 2015), a mesh structure is formed by the
set-Figure 2.7: Pore radius of cement paste measured by mercury intrusion porosimetry (MIP) (Lagerblad, Fjällberg and Vogt, 2010)
accelerator agents, changing the final structure of concrete hydration products. MIP test may be used in theoretical calculations of the pore size and is valuable in making comparative assessments of pore diameters comparative in hydrated cements (Diamond, 2000) (Ma, 2014).
2.8 Conclusion
The use of a mix design suited to the expected exposure conditions is the starting point of a durable concrete. Assuming a quality mix design, adequate equipment selection, and an experienced nozzle operator, then all the desired conditions to achieve proper and durable shotcrete have been met. But what else could play an important role on shotcrete durability as a structural material?
Alkali-free set accelerator as an admixture is used to increase productivity and the mechanical performance in the first hours after the application of shotcrete. But how does this product change the final long-term concrete characteristics? This is the question that has driven this research.
Concrete mechanical properties are not directly correlated to durability parameters and holistic and broader test results are necessary for this analysis. An investigation into the influence of set-accelerator dosage on shotcrete is necessary to evaluate concrete mechanical properties and durability related parameters, in order to improve the knowledge on the shotcrete durability field, as well as to determine correct usage and wiser specifications.
3 Method, materials and tests
3.1 Materials used
3.1.1 Pre-Packaged Shotcrete
During this research, the material used was provided by King Packaged Materials Company and Sika Canada. The choice of using packaged concrete guarantees the use of a very well-graded mix design, which must be considered first in the development of a “durable” concrete. This also guarantees the use of controlled and uniform mixtures during the research program.
Two pre-packaged wet-mix shotcrete mixtures were chosen. The first one uses only ordinary general use (GU) Portland cement (OPC) as binder. The second one uses the same proportion in mass of binder, but substitutes a portion of 8% in weight of cement with silica fume (SF).
All mixtures tested are identified using their binder - accelerator dosage combination, where binder is either SF (GU+SF) or OPC (GU only), and the nominal accelerator dosages are either 0, 6%, 11% or 16%.
The series names are then: OPC 0, OPC 6%, OPC 11%, OPC 16% and SF 0, SF 6%, SF 11%, SF 16%. The mixes OPC 0 and SF 0 are the reference mixtures.
3.1.2 Mixtures Designs
All mixtures have equivalent proportions in mass of aggregates, binder (cement and silica fume) and the same w/b ratio. In order to maintain the same proportion of “binder paste volume” for all mixtures, 35,5% ±0,5% in volume, it was necessary to manually add an amount of cement to the “OPC” series, since silica fume presents a higher volume to that of cement for the same mass, in other words, all mixtures had the same volume proportions before pumping and spraying. The only differences between each one of the series produced are the use and the different
dosages of set accelerating admixture dosage.
Reference mixtures used in this research use an aggregate gradation number 2 (ACI, 2016) , as in Table 3.1:
The OPC mixture contains 20,49% of GU cement, and the SF mixture contains 18,3% General Use Cement (GU) + 1,6% Silica Fume (SF), for a total of 19,9% by mass of dry material. As said, this difference in mass of the binder from one reference mixture to another was necessary to keep the same binder paste volume, as already explained, and also to avoid blockage while pumping the OPC mixture (Burns, 2008). The amount in volume and the size distribution of aggregates are the same in both reference mixtures.
Durability characteristics of the concrete are somehow directly related to the w/b ratio and to the hydrated cement paste volume, a higher volume means a higher surface of cement paste to be exposed. Therefore, it need similar characteristics in all mixes to be able to study the effect of different admixture dosage. A w/b of 0,51 was selected as a constant as it represents what is often used in the tunneling industry, usually associated with a minimum compressive strength of 35 MPa at 28 days of age (for the reference mixture). All mixtures exhibited an acceptable
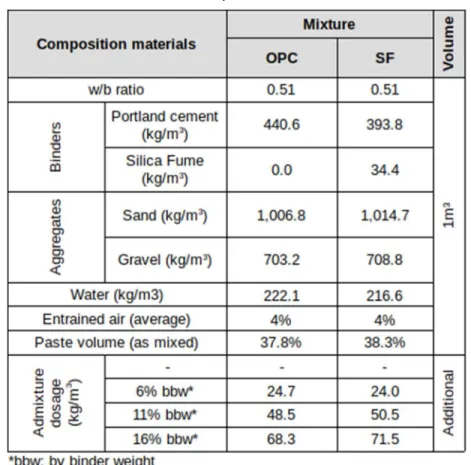
workability, pumped without blockages and build-up sufficient thickness on a vertical surface during the spraying process to be deemed acceptable shotcrete applications. Detailed information on the mixes tested are presented in Table 3.2:
3.1.3 Constituents
Detailed characteristics of each constituent are presented in the Appendix 1. Water used in the mixtures was from the Quebec City municipal water system and met the potable water standards. The pre-packaged shotcrete provided by King are composed by: GU cement type provided by Ciment Québec, silica fume composed of 95,7% of SiO2 provided by Silicium Québec and aggregates provided by Lafarge
and dryed at King Packaged Material Company at Blainville - QC. The sand used Table 3.2: Reference mixtures: wet-process mixture
comes from the St-Gabriel quarry and the gravel comes from the Mirabel quarry.
3.1.4 Admixture and Dosages
The only admixture used in the mixtures is the aluminium sulfate salt-based alkali-free liquid set accelerator for shotcrete: Liquid Sika® Sigunit® L-72AF. Detailed information is presented in the Appendix 2. It was used with the two reference mixtures at different dosages in order to evaluate the direct influence of set accelerator admixture.
Its use is indicated for improvement of shotcrete bond to rock and concrete, slope stabilization, and high quality lining shotcrete. The advantages of this product claimed by the manufacturer include high early strength development, a distinct reduction in rebound and reduction of dust, it is alkali and chloride-free, there is no pollution of groundwater by leaching of alkali, and it improves bond of shotcrete to rock and concrete thus facilitating overhead spraying (Sika, 2012) . Rebound is not a subject of this research. However the use of set accelerator admixture usually increases immediately stiffness of the sprayed concrete and a stiff concrete surface increases the rebound, contrary to what is claimed by the manufacturer.
One of the concerns of this research is the overlooked or misguidedly use of set accelerator over-dosages during shotcrete applications. Experience shows that it is a common observation and a concern in the industry.
Three different dosages were studied in this project, as presented in Table 3.2. First of all, the two reference mixtures were tested to serve as baseline results without admixture. The second series used a dosage of 6% by binder weight (bbw) which is the average dosage of the manufacturer’s recommendation dosage between 4% - 8% bbw. The third and fourth series used over-dosages of 11% and 16% bbw, all above the manufacturer’s recommendations. Before each spraying session, the set accelerator admixture was thoroughly mixed in order to homogenize the active
components in the water suspension.
It should be noted that this study only used one type of set accelerator. Different types of set accelerators, or even the same type with a different chemical balance, may present different effects on shotcrete.
3.2 Fabrication and Sampling
The hydraulic mixer attached to the concrete pump was used to prepare the fresh concrete. Concrete (batches of approximately 100 liters - 233 kg) was mixed for three minutes after the addition of water and once it was ready, the mixture was pumped with the high pressure swing tube concrete pump and sprayed with a shotcrete nozzle (Figure 3.1) inside the Shotcrete Laboratory of Laval University. Information on the wet-process equipment used is presented in Appendix 3. This unique Shotcrete Laboratory has a controlled environment and was used to produce all the series that are part of this research.
The admixture was dosed with a A10 accelerator Pump for the 6% dosage and with a pressurized tank equipped with a calibrated flowmeter (Figure 3.2) for the 11% and 16% dosage mixtures. The spraying sessions with the 11% and 16% dosages were a challenge during this project, the dosage was visually controlled by a second operator and the precise amount of set accelerator may not be exactly what was intended, as some fluctuations are inevitable during spraying. Dosage equipment calibration was confirmed for the set accelerator admixture used. Information on the admixture dosage and equipment calibration is presented in Appendix 4 and 5 respectively.
Right after concrete spraying, all shotcrete panels were protected with plastic sheets to avoid water loss from the concrete. After the final setting time, all specimens were covered with wet burlap for the initial cure. Twenty-four hours after spraying, all specimens were moved into a 100% relative humidity chamber, where they were kept for humid curing until they were tested. During the first week of the curing period, the panels were cored to produce standard specimens for testing.
3.2.1 Laboratory Temperature During Spraying
All spraying took place in the controlled environment of the Shotcrete Laboratory of Laval University. During all shooting sessions, the laboratory temperature range was 22oC ±2oC, according to measurements taken during the spraying.
3.3 Tests Performed
3.3.1 Fresh Concrete Testing
Fresh concrete tests were performed whithin the first 24 hours after concrete mixing and spraying. The goal of these tests were to confirm the uniform characteristics of the fresh concrete and to expose some of the characteristics of concrete in the first 24 hours.
Setting Time – (ASTM C 1117 - withdrawn)
The setting time test for shotcrete was used to verify the setting time variation in each one of the series.
Temperature Evolution During Hydration
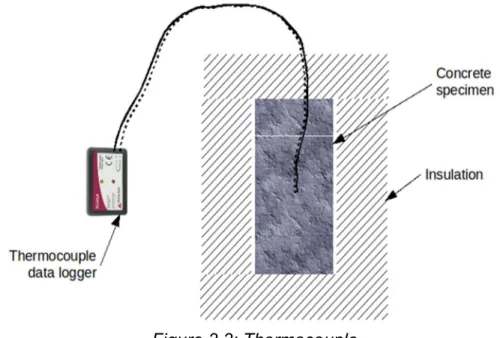
A thermocouple was used to measure the evolution of the temperature of each series. Two specimens of each series were kept insulated from ambient temperature, in order to verify the temperature evolution during the first hours of the hydration process (Figure 3.3).
Slump Test – ASTM C 143
The goal of this test was to check if the consistency of concrete at the mixer was similar for each reference mixture.
Air Content of Freshly Mixed Concrete by the Pressure Method – ASTM C 231 The air content of each mixture prior to pumping was evaluated by using this method, prior to beginning concrete spraying.
3.3.2 Hardened Concrete Testing
Hardened concrete tests were performed with the goal to expose the differences of concrete characteristics with different set accelerator admixture dosages.
Early Age Strength
This non-standardized test uses concrete beams which ends are crushed during the first hours after concrete spraying (Heere & Morgan, 2002). During this research, the test was conducted 3, 6 and 24 hours after concrete spraying. It was not possible to achieve any measurable strength in the tests performed 3 hours after concrete spraying sessions.
Compressive Strength of Cored Cylindrical Concrete – ASTM C 1604
This test was performed after 3, 7, 28 and 56 days. The cylinders tested were extracted directly from sprayed panels and were 75 mm in diameter and with height between 80 mm and 120 mm depending on the thickness of each panel, in accordance with ASTM C 1604.
Density, Absorption, and Voids in Hardened Concrete – ASTM C 642
This test was performed on specimens extracted and cut from sprayed panels after 56 days of curing. In this research, the presented result was the volume of permeable voids available to water.
Electrical Indication of Concrete’s Ability to Resist Chloride Ion Penetration – ASTM C 1202 (RCPT)
This test was performed after 56 days of curing for each one of the tested specimens, resulting in a qualitative classification of chloride ion diffusion.
Chloride Migration Coefficient - NT BUILD 492
This NORDTEST method was applied after 56 days of curing, giving as results the thickness of the chloride penetration and also a non-steady-state migration
coefficient.
Length Change of Hardened Hydraulic-Cement Mortar and Concrete – ASTM C 157
This standard test was modified to allow the use of the concrete sprayed in the standard spraying panels. Specimens were extracted and cut to the standardized geometry from the standard panel and gages were inserted on the specimens during the first week after concrete spraying, allowing the length change measurements. In this research, the goal was to measure only the length change due to drying of the specimens. As the gages were glued during the first week after concrete spraying, it was decided not to measure the length change during the curing period. Measurements started after 56 days of 100% humid curing by immersion when the specimens were moved to a 50% RH, 23ºC room.
Length Change of Hydraulic-Cement Mortars Exposed to a Sulfate Solution – ASTM C 1012
This standard test was modified to allow the use of the concrete sprayed in the standard spraying panels. Specimens were extracted and cut to the standardized geometry from the standard panel and gages were inserted on the specimens during the first week after concrete spraying, allowing the length change measurements. This test was performed because of the shotcrete exposure to soils and sulfate attack. Measurements started after 56 days of 100% humid curing by immersion when the specimens were moved to a 23ºC room.
Resistance of Concrete to Rapid Freezing and Thawing – ASTM C 666, procedure B
The goal is to verify the freeze-thaw resistance differences between the specimens with different dosages of set accelerating admixture compared to the base mixtures.
Determining the Penetration of Chloride Ion into Concrete by Ponding – ASTM C 1543
This test started at the end of 56 days of 100% humid curing. It uses a long-term exposure of concrete to a chloride solution in a controlled environment. After selecting exposure periods, the chloride ion concentration by concrete weight at different depths of the specimens is measured by extracting concrete material from different layers of the specimens and testing chemically the ion concentration of each one of the layers.
Accelerated Carbonation Test – AFNOR XP P18-458
An accelerated carbonation test was designed to evaluate the rate of carbonation affects each specimen series. Specimens tested in this research were exposed to a 4% CO2 concentration and 50 +/-5% relative humidity in an environment controlled
chamber during a period of three months. Prior to exposure in the chamber, all cylindric specimens of 100 mm in diameter and 50 mm in height were coated with epoxy, leaving exposed only one end of the specimens to allow carbonation in one direction. Prior to exposure in the CO2 chamber, specimens were preconditioned for
21 days of 50% relative humidity at the end of 56 days of 100% humid curing. After accelerated carbonation, all specimens were split in half and sprayed with a phenolphthalein indicator solution. This solution colors all areas with elevated pH (not carbonated) on concrete and reveals the depth of carbonation in each specimen. Migration (STADIUM® Lab)
Results from the migration test is used by STADIUM® Lab as an input parameter for calculation of the ionic diffusion coefficient. During the test, concrete specimens of 100 mm in diameter and 50 mm in height are exposed to two different solutions on each side of the specimen. During exposure, a continuous electrical charge between 16V to 20V is applied to accelerate the ion migration process. The anode solution
used is 0.5 M NaCl plus 0.3 M NaOH and the cathode solution used is 0.3 M NaOH. The test is performed for 15 days and the electrical current is measured every 24 hours (Simco Technologies, 2012).
Drying Test (STADIUM® Lab)
Results from the drying test is used by STADIUM® Lab as an input parameter for calculation of the permeability coefficient.Two different specimens are used: the first ones with 100 mm in diameter and 50 mm in height were coated with epoxy, leaving exposed only the one end of the specimens to allow drying in one direction, the second one with 100 mm in diameter and 10 in mm height. Saturated specimens are transferred to a 50% RH chamber for 30 days and the water mass loss is measured during this period following a standard schedule, defining a water loss curve (Samson et al., 2008 ; Simco Technologies 2012).
Pore Solution Extraction
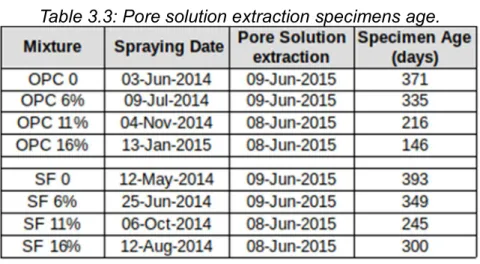
The STADIUM® service life prediction system estimates the concrete pore solution based on the concrete mix design. However, the use of aluminum-sulfate admixtures could change the concrete final cement hydration products. Pore solution extraction was considered to verify this probable modifications and it is important for the durability and service life analysis. The method proposed by (Barneyback, Diamond and Lafayette, 1981) was used in this research project.
Specimens were kept in the 100% RH chamber until the extraction time. Concrete was crushed in small parts and free aggregates were removed. Then, the remaining material was kept protected avoiding water loss and keeping the material in a saturated surface dry (SSD) condition. Pore solution extraction was promptly performed in accordance with the procedure presented at Appendix 6. The fluid was kept sealed in a refrigerator during the waiting period for the chemical analysis. Due to equipment limitations, each specimen was tested at different ages as shown
in Table 3.3.
3.3.3 Observations
For testing involving exposure to an aggressive agent, the surface of all specimens exposed to the aggressive agents was the one closest to the exterior surface during spraying sessions. Specimens were extracted in order to avoid corners of the shotcrete panels or any observable defective areas.
3.4 Shotcrete Production
3.4.1 Interval between spraying sessions
According to equipment availability and other limitations, a minimum delay of two weeks interval was necessary before and after concrete spraying sessions.
3.4.2 Concrete Projections
One mockup projection was conducted with the aim of adjusting the equipment and preparing the team. All series were produced in the Shotcrete Laboratory of Laval University. The first projection with the OPC 0 series was interrupted due to a pump blockage. After this event, in order to keep the same w/b ratio and paste volume on OPC and SF series, cement was added in the OPC series (Table 3.2). This measure was effective to avoid pump blockages and keep proper workability levels.
The OPC 0, without the use of a set accelerator, exhibited barely proper workability, with some fallouts on vertical panels. The OPC 6% projection exhibited proper workability, low observed visual rebound (not measured), and no fallouts, yielding thicker layers. The SF 0 and SF 6% exhibited excellent workability, low observed visual rebound and no fallouts.
Spraying with overdosage of the set accelerator admixture resulted in an immediate stiffened concrete surface, producing more observable rebound. This was the case of the OPC 11%, OPC 16%, SF 11% and SF 16% mixtures. However, it was much easier to spray thicker layers.
The concrete pump use two pistons to move concrete and the small time interval during the pistons changing direction creates small loss of pressure and pumping intervals. During these intervals, the set accelerator admixture continues to flow constantly (Figure 3.4). It was observed, at the higher dosages (11% and 16%) spraying sessions, the formation of an admixture film at the surface of the sprayed concrete. This phenomenon was explained by Chapdelaine (2007) and confirm the non-uniform concrete and admixture flow. The same phenomenon is observed on job sites as well.
Figure 3.4: Concrete and Admixture pump pressure variation. (adapted from Chapdelaine 2007)
4 Results
Shotcrete specimens were produced in order to test the characteristics of fresh and hardened concrete with different dosages of set accelerating admixture and compare them to reference mixtures sprayed without admixture. The results are presented into two different sections. The first section exposes fresh concrete test results, before spraying (as mixed) and after spraying, exploring the differences in setting time and in the first hours of cement hydration. The second section exposes a comprehensive hardened concrete characteristics and service life modelling test results.
4.1 Fresh Concrete
As explained in Chapter 3, the hydraulic mixer attached to the concrete pump was used to mix the pre-packaged concrete. Fresh concrete was tested before pumping and also after spraying.
4.1.1 Slump (ASTM C 143) and Air Content (ASTM C 231)
The tests conducted on fresh concrete were performed after the addition of water and mechanical mixing for three minutes. Slump tests and air content results are presented in Table 4.1:
During the development of this project, all the mixtures exhibited similar fresh concrete characteristics.
4.1.2 Setting Time
Setting time results, presented in Table 4.2 and Figures 4.1 and 4.2, show initial and final setting times for each series. The test was started no more than 10 minutes after concrete spraying. Some initial setting times could not be defined and they were reported as “less than 10 minutes”, but in these cases, observations during concrete spraying show that the material was setting in the first seconds following placement. Initial temperature was obtained from the pair of thermocouples used to monitor the temperature evolution, which started 5 minutes after concrete spraying.
Figure 4.1: Setting Time OPC Series.
4.1.3 Temperature Evolution
The temperature evolution during the first 24 hours of hydration was measured with a pair of thermocouples, automatically recording the data from two different specimens insulated from exterior influence. The moment of initial and final setting from ASTM C 1117 is presented in Figures 4.3 and 4.4. As shown, temperature increases after the final setting time with exception of OPC 11%, OPC 16% and SF 16% specimens. This last specimen exhibited a short constant temperature period, this kind of curve could indicate an undersulphated type of hydration reaction (Juilland, Galluci & Lindlar, 2012). As explained before in section 2.7, the cement hydration will progress differently depending on the dosage of the set accelerator.
Figure 4.3: Temperature evolution and setting time. OPC Series (Thermocouple).
The goal of the temperature evolution measurement was to identify the different curves of temperature during the first hours of the cement hydration. In the results shown in Figures 4.5 and 4.6, the temperature evolution curves, especially on higher set-accelerator dosages, diverge significantly from the reference curves. OPC 6%, SF 6%, SF 11% and SF 16% temperature rise earlier, then the temperature rise finish abruptly or continue with less intensity. OPC 11%, OPC 16%, SF 11% and SF 16% exhibited a small temperature evolution at the first minutes after concrete spraying associated with a subtle and short constant temperature period before the rise of temperature, this could be associated with undersulphated type of hydration reaction where aluminate phases take place or damage C-S-H formation (Juilland, Galluci & Lindlar, 2012).
The different temperature evolution curves of some of the mixtures with high dosages of set accelerator admixture (11% and 16%) were somewhat unexpected. To confirm the validity of these curves, a second series of SF 16% thermocouple
Figure 4.4: Temperature evolution and setting time. SF Series (Thermocouple).
specimens were produced. The exhibited results were the same from the original test. This test result was a first validation that the dosage of the admixture changes the way it affects the early reactions in the cement paste.
4.2 Hardened Concrete
Tests performed on hardened concrete were conducted to characterize as best as possible all mixtures with different admixture dosages.
4.2.1 Concrete Compressive Strength
The concrete early compressive strength at 6 and 24 hours, the compressive strength at 3, 7, 28 and 56 days and the concrete compressive strength variation compared to the reference mixes are presented in Table 4.3.
4.2.2 Volume of Permeable Voids – ASTM C 642
The volume of permeable voids are presented at Table 4.4. Table 4.3: Compressive strength.
4.2.3 Drying Shrinkage and Concrete Expansion
Concrete expansion due to sulfate attack test ASTM C 1012 did not present expansion on any of the specimens, no expansion was observed during the 16 weeks of test measurement. Drying shrinkage test (ASTM C 157) results are presented in Figures 4.7 and 4.8.
Figure 4.7: Drying Shrinkage OPC Series.
4.2.4 Durability Related Tests
Tests directly related to the durability and service life prediction are presented in Table 4.6. These tests were performed to characterize as best as possible the durability related characteristics of the concrete produced.
Ponding test ASTM C 1543 was performed only on OPC 0, SF 0, SF 6% and SF 11%. The salt water solution on specimens OPC 6% and OPC 11% passed through these specimens in less than 10 minutes and testing could not be conducted for these mixtures. These two specimens somehow exhibited a consolidation problem during production resulting in a completely permeable concrete specimens, the problem could not be visually identified. It was not possible to test OPC 16% and SF 16% either, concrete surface stiffened too fast after spraying by the action of the set accelerator and it was not possible to perform the necessary surface finishing of the specimens.
Table 4.5: Durability parameters. RCPT, NT-492, STADIUM® tests: Ionic diffusion and Permeability coefficient.
Each test result was obtained from three specimens for each one of the depths and are presented with its standard deviation. The available results are presented in Table 4.6 and Figure 4.9.
Table 4.6: Ponding test (3 months exposure)
Accelerated carbonation test results are presented in Table 4.7 and Figure 4.10. Carbonation is a ionic diffusion-driven phenomenon. There was not enough time to test OPC 16% specimens during this research.
Table 4.7: Accelerated Carbonation penetration depth (3 months exposure).
4.2.5 Freeze-Thaw – ASTM C 666 and The Microscopical Determination
of Parameters of the Air-Void System in Hardened Concrete -
ASTM C 457
Regarding the freeze/thaw ASTM C 666 test, only OPC 0 specimens completed the 300 freeze-thaw cycles (Figure 4.11).Test of the mixtures OPC 11%, OPC 16% and SF 16% were cancelled due to poor performance of the specimens with set accelerator dosages. Results are presented in Table 4.9.
Table 4.8: Freeze-thaw test results.
The microscopical determination of parameters of the air-void system in hardened concrete ASTM C 457 was performed with the use of concrete slabs extracted perpendicularly from the shotcrete panels. Even if concrete mixtures were not air-entrained, mixtures with set accelerator dosages exhibited a higher spacing factor and somehow a higher air content volume not well understood. Results are presented in Table 4.9. In general, the spacing factor is higher in all series with the use of set accelerating admixture.
This test determined parameters such as air content, paste-air ratio, paste content and spacing factor (L). Fresh concrete, prior to spraying, exhibited an average of 4% of air content in volume. As expected, the air content of the hardened shotcrete is inferior to the value recorded on fresh concrete, except for SF 16%.
Shotcrete produced in this project only used set accelerator admixture, no air entraining admixture was used, and it is not durable to freeze-thaw as per the requirements of CSA A23.1 or ACI 201.2R.
4.2.6 STADIUM® Testing
STADIUM® is a service life prediction model which uses results from ionic diffusion tests and drying tests to generate predictions; results of the experimental tests are presented in Table 4.5 and Figures 4.12, 4.13 and 4.14. With the results of these tests, the STADIUM® Lab software calculates a ionic diffusion, an intrinsic permeability coefficient and the concrete pores saturation at 50% RH. Results from STADIUM® Lab can be used to perform calculations in STADIUM® software to generate service-life predictions (time for corrosion to initiate), that will be discussed in chapter 5.
In order to confirm the different characteristics exhibited in the specimens with set accelerator dosage, two different SF 6% specimen series were tested. STADIUM® Lab results were the same for the two series.
Figure 4.13: Drying test (STADIUM® Lab): 10 mm height specimens.
4.2.7 Pore Solution Extraction
An extraction of the interstitial pore solution was performed for each mixture. All the solutions were subjected to a chemical analysis of ion concentrations of OH-, Na+,
K+, Ca+2 and Al+3. No Al+3 ion was found. Results of ion concentrations and pH of the
solution are presented in Table 4.10.
The OPC 6% mixture presented results that are deemed erroneous and are probably the result of a bad manipulation and should be disregarded.
These results were used as input data in STADIUM® software for calculations of service life predictions.
4.3 Conclusion
The specimens sprayed with the set accelerator exhibited somewhat unpredictable characteristics for each one the dosages. The variable effect can be observed minutes after spraying (setting time, hydration temperature evolution) and in the hardened concrete results (compressive strength evolution, transport properties). Although this will bring us some difficulties in analyzing the results, it should be mentioned that this is the first study of this type where as many as eight different sprayed concrete are compared. As such, these experimental results are still of great interest.
5 Analysis and discussion
5.1 Introduction
The goal of this chapter is to present the analysis of the results obtained during this research with an emphasis on the particularities of the shotcrete placement process and potential effects on durability. The intricacy of this investigation and the amount of data generated are used to develop an overall understanding of the effects of the alkali-free set accelerating admixture on shotcrete.
Shotcrete differs from cast-in-place concrete in that it is a different placement method and consolidation process. It is important to note that during this research, only two different shotcrete mixtures were used and the only variable parameter was the set-accelerator dosage. The two different fresh concrete mixes have the same aggregate content and size distribution, the same volume of binder paste and the same w/b ratio. These parameters were fixed with the goal of evaluating the set-accelerator dosage effect. There are some other shotcrete characteristics which were not evaluated with the performed testing programme and it would have been difficult due to the accelerator such as : content of paste in-place due to rebound, changes of concrete viscosity after spraying and its effects on the projection and compaction energy, modification of the hydration of cement paste. The addition of set accelerator admixture result in a different hydrated cement paste characteristic. During this project, it was clear that even with the recommended admixture dosage (6%), each concrete mixture exhibited particular characteristics whether simply in appearance, with the fresh concrete properties after projection or with the hardened concrete properties.
Since durability and service life are dependent on different transport mechanisms, the following analysis will be divided according to each individual transport mechanism, in order to extract the most significant effects of the set accelerator
admixture.
5.1.1 Set-Accelerator Dosage and the w/b Ratio
The liquid phase of the set accelerator admixture is variable depending on product manufacturers. As an example, the one used considers an accelerator composition proportion with 30% in solid phase and 70% in liquid phase (water). Considering the solid phase of admixture as binder and the liquid phase as additional water, w/b ratio and paste volume of concrete practically increase due to the addition of the set accelerating admixture. Table 5.1 illustrates this example for the mixtures of this project.
Based on the example presented in Table 5.1, the w/b ratio could reach values as high as 0.59 due to the addition of set accelerator admixture. This increase in w/b ratio should be kept in mind in the analysis of the results.
One of the concerns of this project was the admixture dosage during the spraying sessions. There might have been moments, especially with the higher dosages, where the exact amount of admixture in the concrete may not be exactly what was expected due to three factors. The first is the possible lack of homogeneity of the set
Table 5.1: Paste volume and w/b probable modification due to set accelerator dosage.