Carina OB Stars: X-ray Signatures of Wind Shocks and Magnetic
Fields
Marc Gagn´e, Garrett Fehon, and Michael R. Savoy
Department of Geology and Astronomy, West Chester University, West Chester, PA 19383 David H. Cohen
Department of Physics and Astronomy, Swarthmore College, Swarthmore, PA 19081 Leisa K. Townsley, Patrick S. Broos, and Matthew S. Povich1
Department of Astronomy & Astrophysics, 525 Davey Laboratory, Pennsylvania State University, University Park, PA 16802
Michael F. Corcoran
CRESST and X-ray Astrophysics Laboratory, NASA/GSFC, Greenbelt, MD 20771 Nolan R. Walborn
Space Telescope Science Institute, Baltimore, MD 21218, USA Nancy Remage Evans
Smithsonian Astrophysical Observatory, MS 4, 60 Garden St., Cambridge, MA 02138 Anthony F.J. Moffat
D´epartement de Physique, Universit´e de Montr´eal, Succursale Centre-Ville, Montr´eal, QC, H3C 3J7, Canada
Ya¨el Naz´e2
GAPHE, D´epartement AGO, Universit´e de Li`ege, All´ee du 6 Aoˆut 17, Bat. B5C, B4000-Li`ege, Belgium and Research Associate FRS-FNRS
and
Lida M. Oskinova
Institute for Physics and Astronomy, University of Potsdam, 14476 Potsdam, Germany
ABSTRACT
The Chandra Carina Complex contains 200 known O- and B type stars. The Chandra survey detected 68 of the 70 O stars and 61 of 127 known B0-B3 stars. We have assembled a publicly available optical/X-ray database to identify OB stars that depart from the canonical LX/Lbol relation, or whose average X-ray
temperatures exceed 1 keV. Among the single O stars with high kT we identify two candidate magnetically confined wind shock sources: Tr16-22, O8.5 V, and LS 1865, O8.5 V((f)). The O4 III(fc) star HD 93250 exhibits strong, hard, vari-able X-rays, suggesting it may be a massive binary with a period of > 30 days. The visual O2 If* binary HD 93129A shows soft 0.6 keV and hard 1.9 keV emission components, suggesting embedded wind shocks close to the O2 If* Aa primary, and colliding wind shocks between Aa and Ab. Of the 11 known O-type spectro-scopic binaries, the long orbital-period systems HD 93343, HD 93403 and QZ Car have higher shock temperatures than short-period systems such as HD 93205 and FO 15. Although the X-rays from most B stars may be produced in the coronae of unseen, low-mass pre–main sequence companions, a dozen B stars with high LX cannot be explained by a distribution of unseen companions. One of these,
SS73 24 in the Treasure Chest cluster, is a new candidate Herbig Be star. Subject headings: X-rays: stars — stars: early-type — open clusters and associ-ations: individual: Cl Bochum 10, Cl Bochum 11, Cl Collinder 228, Cl Trumpler 14, Cl Trumpler 15, Cl Trumpler 16 — stars: individual: HD 93250, HD 93129A, HD 93403, HD 93205, HD 93343, QZ Car, SS73 24, FO 15, Cl Trumpler 16 22, CPD-59 2610, HD 93501
1. Introduction
The Chandra Carina Complex Project (CCCP) (Townsley et al. 2011a) survey area contains over 200 massive stars: the luminous blue variable (LBV) η Car, the Wolf Rayet (WR) stars WR 22, WR 24 and WR 25, 70 known O stars, and 127 B0-B3 stars with determined spectral types and photometry consistent with a distance of 2.3 kpc to the Carina cluster Trumpler 16 (Tr 16) (Smith 2006). In the next section we describe the database of
1NSF Astronomy & Astrophysics Postdoctoral Fellow 2Research Associate FRS-FNRS
OB stars in more detail. Briefly, the massive star population in Carina can be divided into groups based on spectral type, luminosity class and binarity: LBV/WR stars (4), early-O binaries (6), early-O single dwarfs and giants (10), late-O binaries (9), late-O dwarfs and giants (44), single O-type supergiants (1), B0-B3 stars (127), and B5-B7 stars (3).
In addition to the OB stars with measured spectral types considered here and by Naz´e et al. (2011), this volume contains four other articles which discuss the massive-star population in Carina: Povich et al. (2011a) present a list of 94 candidate OB stars, selected on basis on their X-ray emission and infrared spectral energy distributions (SED); their spectral types have not been determined. Evans et al. (2011) identify candidate late-B stars in Tr 16 based on their UBV photometry. Townsley et al. (2011a) analyze the CCCP spectra of the three WR stars and Parkin et al. (2011) present a detailed X-ray spectral/temporal analysis of the double spectroscopic binary QZ Car, O9.7 I + O8 III. In this paper, we examine the X-ray, optical, and infrared characteristics of the 200 OB stars with determined spectral types and use X-ray spectra and light curves of this large sample of well-studied OB stars to better understand the physical mechanisms that produce X-rays in massive stellar systems.
The ubiquitous X-ray emission from O and early B stars is generally thought to arise in shocks embedded in the powerful radiation-driven winds of these stars. However, there are exceptions to this paradigm, with a subset of early-type stars showing harder and stronger X-ray emission than can be explained by embedded wind shocks (EWS) alone. We point to three recent X-ray surveys that have examined these questions in some detail: the XMM-Newton survey of NGC 6231 in the Sco OB1 association (Sana et al. 2006a,b), the Chandra survey of Tr 16 (Evans et al. 2003, 2004), and the Chandra Orion Ultradeep Project (Stelzer et al. 2005).
The Orion Nebula Cluster contains only two O stars, and both have unusual X-ray emission: θ1 Ori C, O7 Vp (Gagn´e et al. 2005), and θ2 Ori A, O9.5 SB (Feigelson et al. 2002; Schulz et al. 2006). Of the early-B stars, Stelzer et al. (2005) identify two groups: strong-wind sources (earlier than B4) that give rise to X-rays in wind shocks (relevant to this study), and weak-wind sources (later than B4) whose X-rays, when detected, may be produced by late-type pre-main-sequence (PMS) companions (see Evans et al. 2011).
In their study of Tr 16 and part of Trumpler 14 (Tr 14), Evans et al. (2003, 2004) ana-lyzed the ACIS-I spectra of some of the prominent O stars in Carina, identifying HD 93250, O4 III(fc), and Tr16-244, O3/4 I, as highly unusual, and proposing a new colliding-wind binary system: Tr16-22, O8.5 V. Aside from these anomalously active stars, Evans et al. (2003) find that the canonical LX≈ 10−7Lbol relationship is obeyed.
the LX/Lbol relationship in the soft XMM-Newton bands below 2.5 keV, but show a
break-down in the correlation in the 2.5-10 keV hard band. They also confirm the prominent kink in LX/Lbol below log Lbol = 38 first noted by Berghoefer et al. (1997) (see also Naz´e et al.
2011).
In this paper, we focus mainly on three emission mechanisms, in addition to EWS, to understand the X-rays observed from O and B stars in the CCCP: colliding wind shocks (CWS), magnetically confined wind shocks (MCWS), and coronal emission from unseen pre-main–sequence (PMS) companions, though we discuss other mechanisms in §1.5. In particular, we focus on those stars that show high LX/Lbol, hard X-ray spectra, or show
notable time variability.
1.1. Embedded Wind Shocks
The default mechanism for X-ray production on O and early B stars is embedded wind shocks (EWS), generally assumed to be associated with the Doppler deshadowing instability intrinsic to line driving (Lucy & White 1980; Lucy 1982; Owocki et al. 1988; Feldmeier et al. 1997). The instability predicts that wind streams having different velocities interact, shock heating a modest fraction of the wind beyond a few tenths of a stellar radius. Several stellar radii above the photosphere, the shocked portion of the wind is traveling at speeds approaching the wind terminal velocity of thousands of km s−1. (Dessart & Owocki 2005a,b). But the relative velocities of the interacting wind streams are generally only a few hundred km s−1, generating shock temperatures of just a few million K. This shock-heated plasma radiates a line-dominated soft X-ray spectrum. This soft X-ray emission generally shows little variability, indicating that there are numerous separate shock-heated regions of the wind at any given time. Wind clumping is a universal phenomenon in hot-star winds (L´epine & Moffat 1999; L´epine et al. 2000; Moffat 2008) and Feldmeier et al. (2003) showed that the wind clumping affects the emergent X-ray line profiles.
The soft X-ray emission is attenuated by the colder, X-ray absorbing wind in which it is embedded. This wind attenuation affects the shapes of individual line profiles, as is evident in high-resolution X-ray spectroscopic studies of nearby O stars, which also confirm Doppler broadening commensurate with the wind terminal velocity, lending strong support to the EWS mechanism (Kahn et al. 2001; Cassinelli et al. 2001; Zhekov & Palla 2007; Walborn et al. 2009; Cohen et al. 2010).
The wind attenuation can harden the overall X-ray spectrum for early O stars with very high mass-loss rates. The attenuation of the X-rays from embedded wind shocks also
affects the emergent X-ray luminosity. Empirically, a scaling of emergent X-ray luminosity with bolometric luminosity, LX ≈ 10−7Lbol, has been long known (Pallavicini et al. 1981),
and is largely confirmed in the broad OB population in the CCCP (Naz´e et al. 2011). No strong theoretical expectation for this scaling has been found, although wind attenuation can explain it in principle (Owocki & Cohen 1999).
For Carina O stars with X-ray emission dominated by the EWS mechanism, we should expect to see soft X-ray emission (characterized by kT < 1 keV) at a level corresponding to LX ≈ 10−7Lbol, and with little variability. For B stars, significantly lower relative X-ray
luminosities are seen, with values as low as LX≈ 10−9Lbol by spectral subtype B2 V (Cohen
et al. 1997).
While embedded wind shocks presumably exist in all early-type stars with strong radiation-driven winds, detailed X-ray studies of nearby O and early B stars show that a fraction of them have properties that are at odds with the EWS scenario. These usually involve higher X-ray luminosities and harder X-ray spectra than is predicted to arise in embedded wind shocks alone, and often involve X-ray time variability on orbital or rotational timescales. When high-resolution X-ray spectra are available, these often show narrower X-ray emission lines, as well. Corroborating evidence from other wavelengths generally shows evidence for either wind-wind collisions in binary systems or magnetic confinement of the wind. In the next four subsections, we summarize some of these theoretical and observational studies.
1.2. Colliding Wind Shocks
In binary systems where both stars have strong winds, shock heating in the wind in-teraction zone between the two stars can lead to stronger X-ray emission than that seen in the EWS scenario (Stevens et al. 1992; Pittard 2009). The X-ray properties of CWS sources depend on the wind and orbital parameters of the two stars, and they vary with orbital phase in the case of systems with eccentric orbits. Antokhin et al. (2004) predict that X-ray luminosity scales as the reciprocal of the binary separation. In many O+O, WR+O, and LBV+O-type systems in which both components have high mass-loss rates, CWS X-rays tend to dominate those from embedded wind shocks, with X-ray flux increasing for more equal-momentum winds and intermediate separations.
For example, the O+O binaries in the XMM-Newton survey of hot stars (Naz´e 2009) have, on average, ∼ 3 times higher LX/Lbol than single O stars. We note that most single
and binary O stars in the XMM survey show relatively low-temperature shocks. In fact, the only O+O binaries in the XMM surveys with hard X-ray spectra are the long-period
Carina binaries HD 93403, O5 III(fc) + O7 V (Naz´e 2009), and HD 93343, O8 V + O7-8.5 V (Antokhin et al. 2008). Long-period, WR+O and LBV+O binaries like WR 140 and η Car also show very high-temperature shocks (Pollock et al. 2005; Corcoran et al. 2001).
Pittard (2009) model the colliding wind emission from pairs of O6 V + O6 V stars with varying orbital periods; their simulations predict peak temperatures of 3-4 MK and 10-20 MK for models cwb1 (3-d period) and cwb2 (10-d period), respectively. We will examine these issues in more detail in §6.3.
It can sometimes be difficult to confirm the binary nature of systems with X-ray proper-ties indicative of CWS emission. Spectroscopic or photometric orbital variations are difficult to measure when the orbital inclination is low, although persistent observing (Hoffmeister et al. 2008) and complementary approaches (Nelan et al. 2004) reveal long-suspected com-panions in CWS systems. After many years of monitoring, Gamen et al. (2008) derived a 207.7-d orbital period for the Carina WN6h colliding-wind binary WR 25. Observations of non-thermal radio emission often provide clues about the presence of wind-wind interac-tions in binaries, even when binary orbital parameters cannot be measured (Dougherty & Williams 2000; De Becker 2007). Ideally, X-ray monitoring over multiple orbital periods is needed to show the orbital modulation expected from colliding wind systems, at least those with sufficiently high eccentricities.
1.3. Magnetically Confined Wind Shocks
Where strong, large-scale magnetic fields exist on early-type stars, wind streams from opposite hemispheres are channeled toward the magnetic equator, where they collide head-on, leading to strong shocks and associated X-rays (Babel & Montmerle 1997). MCWS X-ray emission can be differentiated from EWS X-rays by its temperature distributions (Wojdowski & Schulz 2005), which can be dominated by plasma with temperatures of 30-50 million K. For oblique dipole configurations, the X-rays can be rotationally modulated due to differential occultation of the shock-heated plasma by the star (Gagne et al. 1997).
The prototype MCWS source is θ1 Orionis C, O7 Vp, the illuminating star of the Orion
Nebula, which has a 1.5 kG oblique dipole field, measured with Zeeman spectropolarimetry (Donati et al. 2002; Wade et al. 2006). Chandra grating spectroscopy shows a high X-ray lu-minosity (corresponding to LX > 10−6Lbol) and peak X-ray emission measure ∼ 33 MK. The
X-rays vary (by roughly 20%) in a manner consistent with the rotationally modulated mag-netic field configuration, and these X-ray properties are well explained by MHD simulations of the confined wind of this star (Gagn´e et al. 2005).
Early B stars of the chemically peculiar B2p class show very strong dipole magnetic fields, though they have much weaker winds than the O star θ1 Ori C. Some, like the
prototype σ Ori E, have modest, relatively hard X-ray emission (Sanz-Forcada et al. 2004; Skinner et al. 2008), while other B2p stars have no X-ray emission or emission at levels below the detection threshold. Even the stronger X-ray sources among these Bp stars have X-ray luminosities of only LX≈ 1030 ergs s−1 cm−2 (Drake et al. 1994).
The ability to channel a wind depends both on the strength of the magnetic field and (inversely) on the density of the wind. These scalings are verified in detail by MHD simu-lations (ud-Doula & Owocki 2002; Gagn´e et al. 2005). Some O stars with strong winds and weak fields, such as ζ Ori, have X-ray emission consistent with the EWS scenario (Cohen et al. 2006).
On the other hand, the other well-studied magnetic O stars such as HD 108, O7 Ifpe, and HD 191612, 06.5 IIIf, have LX/Lbol ≈ −6.2 and kT ≈ 0.3 keV. They are more X-ray
active than typical EWS sources, but substantially cooler than θ1 Ori C (Donati et al. 2006a;
Naz´e et al. 2007, 2010). Also curious is the early B star, τ Scorpii, B0.2 V, which has a highly structured (non-dipole) field (Donati et al. 2006b), strong and hard X-ray emission, but no evidence for wind confinement of the X-ray emitting plasma (Cohen et al. 2003; Ignace et al. 2010).
At this point, there are too few O and early B stars with well-characterized magnetic fields (aside from several dozen Bp stars), and their X-ray properties are too heterogeneous, to make definitive statements about what X-ray signatures will be seen from magnetic OB stars in Carina. However, we can say that it is possible that strong X-ray emission may be produced in Carina O stars via magnetically confined shocks if conditions are right. Overall, though, the general X-ray properties from the MCWS mechanism – elevated X-ray luminosities, hard X-ray spectra, and time variability – overlap with those from the CWS mechanism, though the variability in CWS systems is orbital, whereas the variability in MCWS is often rotationally modulated.
1.4. Unseen Pre–Main-Sequence Companions
The three X-ray emission mechanisms described above convert the kinetic energy of the supersonic wind into shocks and thermal X-ray emission. As the mass-loss rate and terminal wind speed diminish towards later spectral type, embedded wind shocks, colliding wind shocks, and magnetically confined wind shocks should be much weaker.
(Caillault et al. 1994; Daniel et al. 2002), and the upper end of the low-mass PMS X-ray luminosity function begins to outshine the massive stars. It is now generally understood that hard, variable X-ray emission from main-sequence mid-B to late-A type stars is produced by unseen, lower-mass companions (Gagn´e et al. 1995; Briggs & Pye 2003). In most cases, the X-rays provide the only clue to the presence of cool companions. In a reverse application, Evans et al. (2011) use X-ray detections in the CCCP and BV photometry to identify unknown B stars in Tr 16.
The situation for the PMS intermediate-mass stars, i.e., the Herbig Ae/Be stars, is quite different. Many are copious, often hard X-ray emitters, despite the fact that they have weak winds and radiative outer envelopes, so they are not expected to have wind shocks, or solar-type magnetic activity. Skinner et al. (2004) consider low-mass PMS companions and an intrinsic, rotational shear dynamo to explain the X-rays from Herbig Ae/Be stars, but so far the mechanism is not known.
1.5. Other X-ray Emission Mechanisms
In this paper, we assume that the soft X-ray emission from most O stars is produced in shock-heated, collisionally ionized, thermal plasmas. Specifically, plasmas whose densities are high enough to be modeled by equilibrium ionization codes like APEC.
However, other emission mechanisms have been proposed to explain the X-ray properties of massive stars. Most fundamentally, Pollock (2007) suggests that the X-rays from O supergiants like ζ Orionis, O9.7 Ib, are produced in the far wind where densities are low, and where the Coulumb collisional mean-free path is many stellar radii, so that the shocked wind is far from collisional or thermal equilibrium. In the Pollock (2007) scenario, ions, not electrons, ionize ions, and the shocks are collisionless; shock heating occurs via plasma processes and magnetic fields. The major difficulty with the Pollock (2007) paradigm is that the X-ray spectra of O stars appear to be produced by collisionally ionized, thermal plasmas with electron-ion bremsstrahlung continua (c.f., Raassen et al. 2008).
The low-resolution ACIS CCD spectra from the CCCP cannot directly address the fundamental nature of the shock heating; we use the APEC model to estimate plasma temperatures and emission measures because the APEC model fits the CCD spectra well with only a few free parameters. When time variability or high-temperature components are observed, we examine secondary processes like colliding wind shocks, magnetically confined wind shocks, or coronal emission from unseen, lower-mass, pre–main-sequence companions, though other mechanisms have been proposed.
For example, the rigidly rotating magnetosphere model (Townsend & Owocki 2005; Townsend 2008) and its successor, the rigid-field hydrodynamic model Townsend et al. (2007), have been used to model the X-ray, UV and Hα emission of the He-strong stars like σ Ori E. This model may have applications to other B stars with strong magnetic fields like τ Sco, B0.2 V.
For the O9.5 V spectroscopic binary θ2 Ori A, Schulz et al. (2006) proposed an interac-tion between the magnetospheres of the spectroscopic primary and secondary at periastron to explain its x-ray spectrum and time variability. Magnetic fields have yet to be seen on either component, though.
Cassinelli et al. (2008) proposed a model for OB stars in which the thin fast wind forms bow shocks on dense, slowly moving clumps. The adiabatic shocks produce peak emission measure near log T = 6.5, with some emission out to log T = 7.5. It is unlikely that this model can operate in stars with strong magnetic fields like τ Sco or θ1 Ori C, but it might
be viable in non-magnetic OB stars, though the effects of radiative cooling should be added to test the model further.
Waldron & Cassinelli (2009) proposed a highly accelerated diamagnetic plasmoid model to explain the production of high-temperature plasma very close to the photospheres of some O stars. This is essentially the opposite mechanism proposed by Cassinelli et al. (2008). In the diamagnetic plasmoid model, the blobs are ejected from the surface and plow into the cooler, slowly moving plasma at the base of the wind.
The origin of magnetic fields on massive stars is still not fully known. They could be generated by subsurface convection or via differential rotation, or they could be fossil fields. In the Spruit (2002) dynamo model, and its adaptation by Mullan & MacDonald (2005); Mullan & Waldron (2006), differential rotation and Tayler instabilities in the interior magnetic field lead to surface magnetic fields. Finally, we note that some of the known OB stars in Carina could harbor neutron star companions, producing strong, accretion-driven X-ray emission (e.g., Davidson & Ostriker 1973).
The discovery of magnetic fields on some massive stars, in combination with colliding winds from massive binaries, leads to a number of complicated but intriguing X-ray emission mechanisms. In this paper, we will focus on the X-ray diagnostics – variability, high LX/Lcol
or high kT – that may signal the presence of magnetic fields or colliding wind shocks in the Carina massive stars.
2. Carina OB Star Optical Catalog
The goal of this study is to characterize the X-ray properties of the O and early-B stars with reliably determined spectral types in the ∼ 1 square degree CCCP field, and to correlate those X-ray properties with effective temperature, bolometric luminosity, and binary properties. The optically selected sample is biased towards stars that are bright from 3900–4800 ˚A, and those that are close to the well-studied clusters Trumpler 14, 15 and 16, Bochum 10 and 11, and Collinder 228. This sample complements the X-ray selected massive-star candidates of Povich et al. (2011a), though these are also biased towards luminous massive-stars because of the correlation between LX and Lbol. The optically selected sample is biased to
stars with AV < 3 mag while the candidate massive stars of Povich et al. (2011a) are mostly
obscured stars with AV > 3 mag.
We began with the “Catalogue of Stellar Spectral Classifications” (Skiff 2009, and ref-erences therein) selecting stars with spectral type O2-B3. To these we added stars in Tapia et al. (2003); Smith (2006); DeGioia-Eastwood et al. (2001); Walborn (1995); Massey & Johnson (1993), including two B5 stars, and a B7 star. For some individual stars, mostly spectroscopic binaries and Ofc stars, we used the updated spectral types of Morgan et al. (1955); Morrison & Conti (1980); Morrell et al. (1988); Rauw et al. (2000, 2001); Freyham-mer et al. (2001); Albacete Colombo et al. (2002); Niemela et al. (2006); Rauw et al. (2009); Ma´ız Apell´aniz et al. (2010); Walborn et al. (2010); Sota et al. (2011).
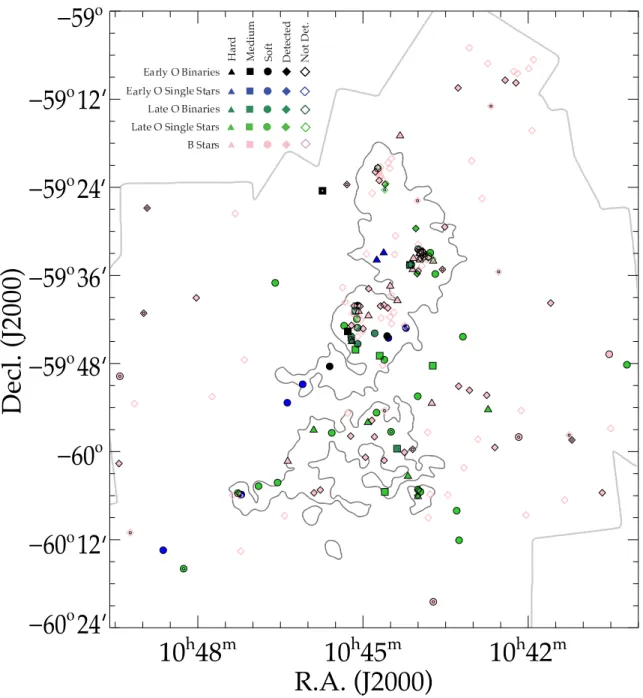
The spatial distribution of the 200 OB stars is shown in Figure 1, where the clusters Trumpler 15, 14, and 16 are visible from N to S at −59◦240, −59◦360, and −59◦420, respec-tively. Many of the confirmed massive stars seen in Fig.1 are coincident with the low-mass populations in the rich clusters (Tr 14, Tr 15, Tr 16, and Coll 228), as expected. However, a significant fraction lie well outside the clusters, supporting the idea that star formation in Carina has been ongoing for a considerable length of time, allowing stars to drift or be ejected from their natal groupings. This is discussed further by Feigelson et al. (2011); Povich et al. (2011a,b).
Johnson UBV photometry was gleaned primarily from the photoelectric catalog of “Ho-mogeneous Means in the UBV System” and its update “UBV Photoelectric Cat: Data 1986-1992” (Mermilliod 1994), and the CCD survey of Trumpler 14 and 16 by Massey & Johnson (1993). For a few close visual binaries, we obtained UBV from Massey et al. (2001); Vazquez et al. (1996); Forte & Orsatti (1981); Forte (1976).
We note that a number of other CCD and photoelectric photometry studies have been published on the Carina hot stars, particularly for those in Trumpler 14 and 16. For example, the compilation of Reed (2005), “Photometry and Spectroscopy for Luminous Stars” lists V ,
U − B, and B − V from a number of reliable photometric surveys. Unfortunately, only 101 of the 200 OB stars in the CCCP are listed in the Reed (2005) catalog. Some surveys like DeGioia-Eastwood et al. (2001) and the Tycho catalog measured B and V . After analyzing color-magnitude diagrams from a number of these studies, we chose the compilations of Mermilliod (1994) and Massey & Johnson (1993) as our primary references because they provided consistent UBV measurements for all but one star: HD 92937, B2.5 II:.
For the 70 O stars, effective temperature was interpolated on the basis of spectral type, using the observational Teff scale of Martins et al. (2005a). For consistency, we used the
O-star synthetic colors of Martins & Plez (2006) to estimate (B−V )0and bolometric correction.
We note that the Martins et al. work uses solar abundance, wind- and line-blanketed, non-LTE model atmospheres, that, for OB stars, lead to lower Teff and Lbol for a given observed
spectral type than did previous work.
For the 130 B stars, consistent sets of NLTE synthetic colors, effective temperatures, and bolometric corrections were not available, though NLTE effects are expected to be smaller in the lower-luminosity Carina B dwarfs. We used the intrinsic colors of Wegner (1994) to estimate (B − V )0. For the B stars, we used the bolometric corrections and effective
temperature scale of Bessell et al. (1998).
2.1. Reddening and Bolometric Luminosity
This study and the study of Naz´e et al. (2011) rely on two methods for determining Lbol: (1) the spectral energy distribution (SED) fitting method of Povich et al. (2011a), and
(2) the more traditional method employing color excess and bolometric correction. We recall that in the color excess method, Mbol = V − AV − DM + BCV, R = AV/E(B − V ) and
E(B − V ) = (B − V ) − (B − V )0, where BCV is the V -band bolometric correction and DM
is the distance modulus.
Of the 200 OB stars in our spectroscopic sample, 182 have high-quality UBV, 2MASS JHK and Spitzer IRAC photometry in the VelaCarina Point-Source Archive (PI: S. Majew-ski, Povich et al. 2011b). Povich et al. (2011a) used the SED fitting method of Robitaille et al. (2007), which applies an ISM absorption model to the revised ATLAS9 stellar atmo-sphere models of Castelli & Kurucz (2004). Though we recognize that the ATLAS9 LTE model atmospheres do not account for non-LTE wind and line blanketing effects, Povich et al. (2011a) show that LTE and non-LTE atmospheres produce similar broad-band opti-cal/infrared SEDs, and hence very similar estimates of AV and Lbol.
SED, Povich et al. (2011a) generate a family of solutions for each SED. The 182 OB stars in the validation sample have the advantage of having well-determined spectral types, and hence Teff, thereby significantly reducing the number of statistically acceptable solutions,
and significantly constraining AV and Lbol.
The SED fitting depends on the adopted reddening law, which effectively specifies the scaling between AV and the absorption in each photometric band. In the traditional color
excess method, this comes down to choosing RV = AV/E(B − V ). As described in Povich
et al. (2011a), the estimates for RV in Carina have varied from an ISM value of 3.1 or 3.2
(Turner et al. 1980a; Turner & Moffat 1980b) to above 5.0 (Herbst 1976).
Table 1 of Walborn (1995) illustrates the interplay between R and DM in the Carina clusters. Throughout the CCCP, we adopt DM = 11.81, corresponding to d = 2.3 kpc, the distance to η Carinae derived from the Doppler velocity and proper motion of the expanding Homunculus nebula (Smith 2006). Walborn (1995) find that for this distance modulus, R = 4 provides the best fit to the O stars in Tr 16, though star-to-star, and cluster-to-cluster variations probably do exist. Similarly, Povich et al. (2011a) find better agreement between the Lbol estimates using B − V and those derived from the optical-infrared SED
method using RV = 4 than using RV = 3.1 or RV = 5. Hence, we and Povich et al. (2011a)
adopt an average RV = 4 and d = 2.3 kpc to all the stars in Carina. We do not attempt to
account for star-to-star variations in the reddening law.
We note that, based on Walborn’s analysis of six O stars in Tr 14, RV = 4 implies
DM = 12.33 if the Tr 14 and Tr 16 are coeval (and thus the O stars in both clusters have the same average luminosity). A more likely solution, however, is that Tr 14 is younger than Tr 16 and the main-sequence O stars are sub-luminous relative to the average class V calibration.
For 181 of the 200 stars in the Carina OB database, we compute Lbol using both the
SED (tag name loglbol sed) and color excess (loglbol bv) methods. We note that one star, MJ 501=Tr 16 74, B1 V, has unreliable B − V . For these 181, the offset in AV (SED
- BV) is ∆AV = 0.1 with a standard deviation σ = 0.25 mag. This is a lower bound on the
systematic uncertainty in AV. The offset in log Lbol (SED - BV) is ∆ log Lbol = 0.04 with a
standard deviation σ = 0.14 mag.
We note though that CMFGEN model atmospheres (Hillier & Lanz 2001) produce more EUV, NIR, and MIR emission for a given Teff and log g than non-LTE model atmospheres,
especially for O supergiants. Because we wish to exploit the full set of optical, near- and mid-infrared photometry, and to maintain consistency with the rest of the CCCP, we use the SED-derived Lbol values whenever possible, despite this deficiency. Future updates to
the OB catalog will contain new Lbol estimates, based on updated SED-fitting codes.
The FITS table headers and the CDS header files list the name, unit, and fortran format code for all columns in the OB catalog. The first 38 columns are devoted to the optical/infrared database and include the following columns (or tags): IAU J2000 name, default designation (label), HD name, CPD name (from the 1919 list of Cannon, Pickering & Draper), LS or ALS name (Reed 2005), Feinstein Trumpler 14/15/16, Collinder 228, or Bochum 10/11 designation, and Massey & Johnson (1993) designations. J2000 R.A. and Decl. are listed in decimal degrees and sexagesimal hours and degrees. Also listed are spectral type, spectral type reference, binary flag, notes, V , U − B, B − V , Q (Massey & Johnson 1993), and UBV reference. We list the derived quantities (B − V )0, E(B − V ), BC,
and AV, log Lbol (solar units), and log Teff as determined via the color excess method, the SED
fitting method, and the adopted value. We note that the label tag contains the commonly used designation used in the text, tables and figures, but that the other designations in the electronic files are precisely those used by Simbad, and by association other databases, for rapid searching.
Table 1 shows a cross section of the optical database for the most luminous stars, sorted by log Lbol. Figure 2 shows the resulting H-R diagram. We overlay the average main sequence
of Martins et al. (2005b) from their sample of 1-5 Myr-old stars. The B-star main sequence is from de Jager & Nieuwenhuijzen (1987) (see also Povich et al. 2011a).
The zero-age main sequence (ZAMS) is clearly delineated in Fig. 2, as is the extent of the terminal-age main sequence (TAMS). The supergiants and bright giants are shown with white dots. The uncertainty in Lbol is dominated by random photometric errors (0.1 mag)
and by systematic uncertainties, especially in the distance modulus and R = AV/E(B − V ),
on the order of 0.3 mag. As noted earlier, we use a global reddening law; we do not account for possible star-to-star variations in R. Despite these uncertainties, much of the spread above the ZAMS appears to indicate a real spread in age. We note that the most luminous OB star in Carina, QZ Car, is a quadruple system (Parkin et al. 2011). Teff for the candidate
Herbig Be star SS73 24 was estimated from its optical-infrared SED (see §6.4.1).
All but two of the 70 O stars were detected with at least 3 source counts in the CCCP: Tr14-27, O9 V, Tr15-18, O9 I/II:(e:). Tr15-18 also has the highest AV of all 200 OB stars;
it may have avoided detection because of its high column density. While AV = 5.66 mag
for Tr15-18 is high among the known OB stars, it is typical of the X-ray selected candidate OB stars identified by Povich et al. (2011a). Finally, we note that Tr15-19, O9 V, and Tr15-21, B0 III, are well below the ZAMS; they may be a background stars, not members of Trumpler 15 (Tr 15).
To estimate the completeness of the optical OB catalog, we consider the populations of OB stars with measured spectral types, and the 94 X-ray-detected stars without measured spectral types discovered by Povich et al. (2011a). Using an initial mass function (IMF) exponent Γ = −1.3 (Kroupa 2002), normalized to the 47 LBV, WR, and O2-O8.5 V stars with mass M > 20M , we expect to find 24 stars in the mass range 15 − 20M , compared
to 27 O9 and O9.5 stars, and 130 stars in the mass range 7 − 15M , compared to 123
main-sequence B0-B2.5 stars. Note, we are considering only the primary stars. This suggests that, if the number of early-mid O stars is complete, then the number of late-O and early-B stars is also nearly complete.
However, the 94 stars identified by Povich et al. (2011a) with Lbol > 104L could have
main-sequence spectral types as early as O4. I.e., the Povich et al. (2011a) result implies that a substantial fraction of early-O to early-B stars do not have measured spectral types. To estimate this fraction more precisely, we note that 140 stars in our optical catalog have Lbol > 104L , and that 76% are detected in the CCCP. Applying this detection fraction
to the 94 stars in Table 3 of Povich et al. (2011a) suggests approximately 124 stars with Lbol > 104L . I.e., an additional ∼ 30 luminous stars were not detected with Chandra. This
suggests a total population of 140 + 94 + 30 = 264 luminous stars; our optical catalog is thus ∼ 53% complete.
Thus if the Povich et al. (2011a) result is confirmed, then a significant fraction (up to half) of the OB stars in the CCCP region have yet to be spectroscopically identified. These stars have higher than average AV and generally reside outside the well-studied clusters in
Carina. Similarly, Wright et al. (2010) find that a large fraction of the B-star population in the Cyg OB2 star-forming region is not identified.
3. Carina OB Star X-ray catalog
The 200 OB star optical positions were matched to the list of 14 368 CCCP sources (see Broos et al. 2011a, for a detailed description of the catalog matching). The astrometric systems in the two catalogs were well aligned (∆α = 0.00500and ∆δ = 0.01200), and the optical and X-ray positions reported for individual stars were in good agreement (the median offset was r ≈ 0.1900). This initial pass through the CCCP X-ray data produced 118 matches (out of 200), including 67 of 70 O stars, and 51 of 130 B stars.
In order to estimate count upper limits for the 82 OB stars not detected in the automated ACIS Extract procedure described by Broos et al. (2011a), we determined optimal source and background regions for the undetected OB stars at their optical positions, accounting
for the Chandra point spread function and the presence of nearby X-ray point sources. The full ACIS Extract procedure was run again on the combined list of 14 368 sources, 82 undetected OB stars, and a number of photometrically selected candidate mid-to-late B stars (Evans et al. 2011). The ACIS Extract procedure used in the CCCP produces source, background and net counts in three bands: hard (2-8 keV), soft (0.5-2 keV) and total (0.5-8 keV). The procedure also estimates the probability PB in these three bands that the source
counts were produced by fluctuations in the observed local background.
Although they were not identified in the automated source detection procedure, an additional 11 stars met the detection criteria used in the CCCP catalog: at least 3 extracted counts and PB ≤ 0.01 in a least one of the three bands (Broos et al. 2011a). They are:
Coll228-66, O9.5 V, LS 1745, B2 III, HD 305515, B1.5 Vsn:, Tr16-13, B1 V, HD 305534, B0.5 V: + B1 V:, Tr16-29, B2 V, LS 1866, B2 V, Tr16-33, B2 V, HD 93342, B1 Iab-Ib, Coll228-81, B0.5 V, HD 93723, B3 III. Thus, the only undetected O stars are Tr14-27, O9 V, Tr15-18, O9 I/II:(e:). Thus the OB catalog contains 129 X-ray matches (out of 200), including 68 of 70 O stars, and 61 of 127 B0-B3 stars. We note that the three stars with spectral types later than B3 were not detected in X-rays.
For the undetected stars, the 90% count rate upper limit, netcounts hi t is used to derive a photon flux upper limit corrected for the mean effective area in the 0.5-8 keV band, the effective exposure time, and the PSF fraction of the selected source extraction region (using eqn. 1 in Broos et al. 2011a).
The 200 OB stars have been divided into three groups: (1) 63 undetected stars with PB>
0.01 for which we calculate a photon flux upper limit, (2) an additional 51 X-ray detected OB stars with 3-50 counts, for which we also determine median energy, Emed = medianenergy t
and the 0.5-8 keV absorbed (uncorrected) energy flux, fX = energyflux t (see eqns. 1
and 2, Broos et al. 2011a), and (3) 78 stars with at least 50 net counts for which Naz´e et al. (2011) also derive kT and NH by fitting the ACIS spectra in XSPEC with a one- or
two-temperature VAPEC emission model, and a two-component tbabs absorption model. The results of the XSPEC fitting procedure are described fully by Naz´e et al. (2011), but the absorption modeling deserves mention here. For all 200 OB stars, we have es-timated AV and converted that absorption into an ISM column density using NH/AV =
1.6 × 1021 cm2 mag−1 (Vuong et al. 2003; Getman et al. 2005)1.
In the XSPEC fits, Naz´e et al. (2011) fix the first ISM column density parameter, and
1We note that the N
H/AV ratio is robust to very high AV, but that the scatter in the NH versus AV
allow a second column density parameter to vary. Many OB-star CCD spectra appear to require this extra absorption, presumably caused by absorption of shocked emission in the overlying wind.
The absorbed X-ray fluxes, used in this paper were computed in XSPEC with the first absorption parameter set to NISM
H , and the second absorption parameter at its best-fit value.
The unabsorbed fluxes were computed using the best-fit emission model, the ISM absorption parameter set to zero, and the second absorption parameter at its best-fit value. This way the unabsorbed flux represents the flux emerging from the far-wind of the star, corrected for ISM absorption. LX is the corresponding 0.5-8 keV unabsorbed X-ray luminosity assuming
d = 2.3 kpc, fitluminosity tc.
We note that Naz´e et al. (2011) derive the absorption-corrected 0.5-10 keV X-ray lumi-nosity, related to tag name fcto, assuming the same distance. We note that 0.5-8.0 keV is the total band of the CCCP, and 0.5-10 keV is the default energy range of previous XMM-Newton surveys (e.g., Sana et al. 2006b). The two X-ray luminosities are very similar, with an average offset of 0.008 in the log, and RMS deviation of 0.033 in the log.
We note that the four X-ray brightest stars were piled up in the CCCP ACIS-I data: HD 93129A, O2 If∗, HD 93205, O3 V + O8 V, HD 93250, O4 III(fc), and QZ Car, O9.7 I + O8 III. A more extensive set of QZ Car data have been fully analyzed by Parkin et al. (2011). In the X-ray catalog, we use the average QZ Car parameters in Table 4 of Parkin et al. (2011). For HD 93129A and HD 93205 Naz´e et al. (2011) performed their two-temperature XSPEC analysis on the pileup-corrected spectrum (for more details see Broos et al. 2011a). For HD 93250, we used a series of Chandra ACIS-S observations; these data and the XSPEC spectral analysis are described in Appendix A.
Throughout this paper, we use kTavg, the emission-measure weighted mean kT for the
78 OB stars with XSPEC fit parameters. For the 53 stars with one-temperature XSPEC fits, kTavg = kT1. For the 24 stars with two-temperature XSPEC fits, and for QZ Car’s
three-temperature fit, kTavg = ΣkTini/Σni, where ni is the normalization parameter of the
ith temperature component. The volume emission measure is 4πd2Σn i.
Thus, in addition to the many parameters produced by the extended ACIS Extract procedures described by Broos et al. (2011a), our OB X-ray database contains an addi-tional 30 parameters to describe the results of the two-temperature XSPEC fits of Naz´e et al. (2011). Merging the X-ray parameters with the optical parameters for each star produces a set of tables with 200 rows (one row for each OB star). We used the follow-ing column names (i.e., IDL structure tags) extensively to create the figures and tables in this paper: label, sptype, ktmean, loglbol, logt, probks single, probks merge,
probnosrc t, netcounts t, netcounts hi t, fitluminosity tc, medianenergy t, energyflux t, where t refers to the total 0.5-8 keV band, and tc refers to total band, absorption-corrected.
The full set of optical/X-ray tables are available electronically as a machine-readable tables from the CDS, a FITS binary table file, and an IDL save file2. The catalog can also
be queried from the Vizier database at the CDS.
4. X-ray Spectral Results
Tables 2 and 3 summarize the X-ray properties for the single O stars and the known O+O binaries, respectively, sorted by log LX/Lbol. Table 4 summarizes the X-ray spectral
and timing analysis results for the 28 X-ray brightest B stars, sorted by log fX. From Tables 2,
3, and 4 we find:
1. The great majority of single and binary O stars have −6.8 < log LX/Lbol < −8.0 and
have soft X-ray spectra characterized by kTavg < 0.8 keV.
2. A small number of single O stars have hard X-ray spectra characterized by kTavg &
1 keV: HD 93250, O4 III(fc), MJ 496, O8.5 V, and MJ 449 = LS 1865, O8.5 V((f)). 3. The spectroscopic O+O binaries with Porb > 10 days like QZ Car, HD 93403 and HD
93343 show hard X-ray spectra characterized by kTavg > 1 keV.
4. The O+O binaries with Porb < 10 days like HD 93205, HD 93161A, FO 15 and five
other known short-period O+O binaries in Tr16 have softer X-ray spectra characterized by kTavg < 1 keV.
5. The shortest-period binary in Carina, FO15, O5.5 Vz + O9.5 V, has low log LX/Lbol ≈
−7.65.
6. All but one of the B stars with log LX & 31 have kTavg & 1 keV
7. All but one of the B stars with log LX < 31 or log fX< −14 have relatively soft X-ray
spectra, with kTavg < 0.6 keV.
The LX/Lbol patterns have been discussed in detail by Naz´e et al. (2011). We recall that
the ISM-corrected LX is computed for the 78 stars with more than 50 counts in XSPEC,
whereas fX, which is not corrected for ISM absorption, was computed for all the X-ray
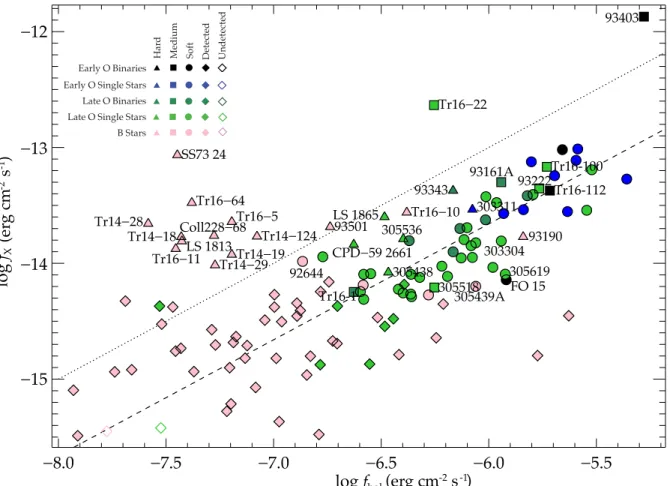
detected stars in ACIS Extract (except HD 93250, HD 93129A, HD 93403 and QZ Car). Noting that fbol = Lbol/4πd2, in Figure 3 we show log fX versus log fbol using the same
symbol definitions as Figs. 1 and 2 to highlight the location of early and late, single and binary O stars, B stars, and hard and soft X-ray spectra.
In Figs. 3 and 4, the 51 X-ray detected stars with 3-50 counts are shown as filled diamonds; 49 are B stars (pink). We categorize the OB stars as hard (with kTavg > 1.8 keV,
shown as triangles in scatter plots), medium-energy (with kTavg in the range 1-1.8 keV,
squares), and soft (with kTavg < 1 keV, circles). In Figs. 3 and 4a, the upper dotted lines
represent log fX/fbol = −7 and the lower dashed lines represent log LX/Lbol = −7.23, the
mean of log LX/Lbol with kTavg < 1 keV.
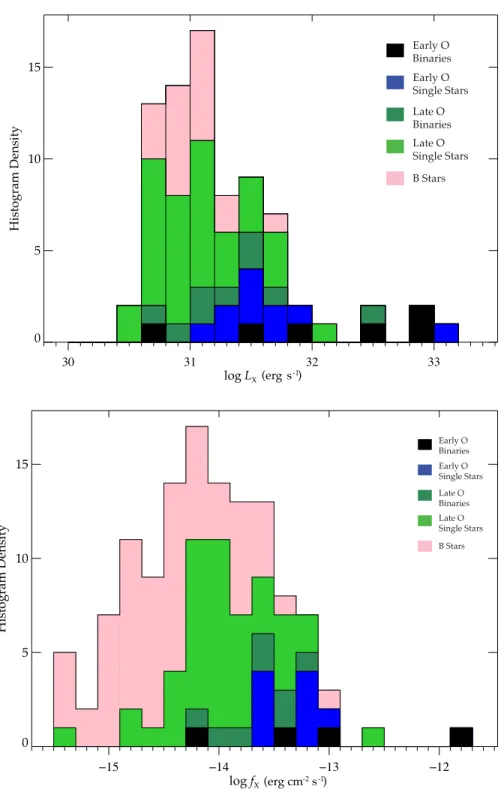
The upper and lower panels of Figure 5 show the number distributions of log LX and
log fX, respectively, for O and B stars: early-O binaries are black, early-O single stars are
blue, late-O binaries are dark green, late-O single stars are light green, and B stars are pink. Fig. 3 shows two populations of O stars (green and blue/black symbols): (i) a population of relatively cool X-ray sources clustered around log fX/fbol ≈ 7.55, though there are some
hotter sources in this group, and (ii) a group of sometimes hotter X-ray sources with higher log fX/fbol. This trend is emphasized in Figure 4, which plots log LX/Lbol versus kTavg and
log fX/fbol versus median energy Emed for the same samples as Fig. 3. The dotted and
dashed vertical lines coincide with the dividing lines between soft, medium and hard symbol definitions used in Figs. 1-4. The soft, low LX/Lbolstars are clumped in the lower left of both
panels of Fig. 4. The horizontal dotted and dashed lines correspond to log LX/Lbol = −7
and −7.23. This latter value is the mean of log LX/Lbol for the stars with kTavg < 1 keV
(Naz´e et al. 2011).
The upper and lower panels of Figure 5 show the distributions of log LX and log fX,
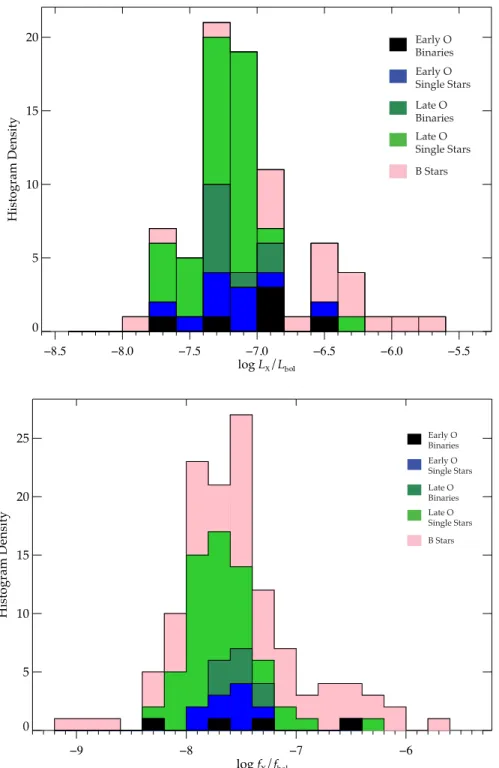
respectively, for the samples shown in Figs. 3 and 4. The upper and lower panels of Figure 6 show the distributions of log LX/Lbol and log fX/fbol, respectively, for the samples shown in
Figs. 3-5. The histograms suggest two distributions, as do Figs. 3 and 4: a group of stars centered around log LX/Lbol < −6.8 and kTavg < 1 keV, and a group with somewhat higher
log LX/Lbol and kTavg ≥ 1 keV. We note a similar pattern for the B stars.
The upper and lower panels of Figure 7 show the distributions of kTavg and median
energy Emed, respectively, for the samples in Figs. 3-6. The upper panel of Fig. 7 reflects the
and a small, broad distribution of stars with kT > 1 keV. The lower panel of Fig. 7 shows no clear segregation; Emed is a less useful measure of intrinsic X-ray temperature, because
higher absorption also produces higher median energy.
Figs. 3, 4, 6 and 7a suggest two populations of OB stars. The first is a low activity group with log LX/Lbol < −6.8 and kT < 1 keV. We suggest that for most of these stars,
conventional embedded wind shocks produce most of the X-ray emission. We suggest that the stars with kTavg > 1 keV require an additional X-ray emission mechanism to produce
the enhanced activity and hotter X-ray shocks. We will explore these results in more detail for single O stars, astrometric binaries, O+O binaries, and B stars in §6 and §7 below.
Table 4 lists the names, spectral types, and selected X-ray properties of the 28 X-ray brightest early-B stars, sorted by fX. We note that 14 of the 15 X-ray brightest early-B stars
in Table 4 have log LX/Lbol > −7, that 14 of those 15 have kTavg & 1 keV, and that 7 of
the top 12 are probably variable on long time scales, though none show the characteristic rapid rise and slower decay of strong PMS flares (see Figs. 9 and 10). For the B stars (in pink), Fig. 4b shows a wide range of median energy and fX/fbol, with only a slight positive
correlation.
We address the origin of the X-ray emission among the 130 early B stars by comparing the X-ray flux distributions of the early B stars and the X-ray detected low-mass stars. Figure 8 shows histograms of log photon flux for 61 X-ray detected early B stars (in pink), 69 B-star upper limits (in brown), and the 14 250 CCCP sources not associated with massive stars (in gray hatching). The vast majority of the general CCCP source population is associated with low-mass PMS stars (Feigelson et al. 2011). The PMS histogram has been normalized to the 130 B stars for comparison. We note that fX cannot be computed for
the undetected sources, so we plot the 0.5-8 keV photon flux (or the 90% confidence upper limit), corrected for the time-averaged PSF fraction and effective area at the location of each star.
At first glance, Fig. 8 suggests that, overall, the X-ray detected B stars have higher flux than the X-ray detected low-mass PMS stars. For example, the 61 X-ray detected B stars have mean X-ray flux fX = 4.6 × 10⁻¹⁵ ergs cm−2 s−1, with a standard deviation
σ = 2.7 × 10⁻¹⁵ ergs cm−2 s−1. The upper limits span one order of magnitude in photon flux, illustrating the non-spatial uniformity of the CCCP survey (c.f. Townsley et al. 2011a). Fig. 8 suggests that the CCCP is only complete to a photon flux of ∼ 10−3 counts ks−1 cm−2.
Adjusting for this bias, two results emerge from Fig. 8: (i) the B stars with log photon flux below −2.3, corresponding to log fX < −14 ergs cm−2 s−1, appear to have the same
distribution of B stars with log fX > −14 ergs cm−2 s−1cannot be explained by a distribution
of typical, low-mass PMS companions.
Result (i) is consistent with the results of Evans et al. (2011): most X-ray detected B stars probably harbor coronal PMS companions. Result (ii) suggests either (1) the bright-est dozen or so B stars formed with hyperactive companions, or (2) that their X-rays are produced by some intrinsic shock mechanism.
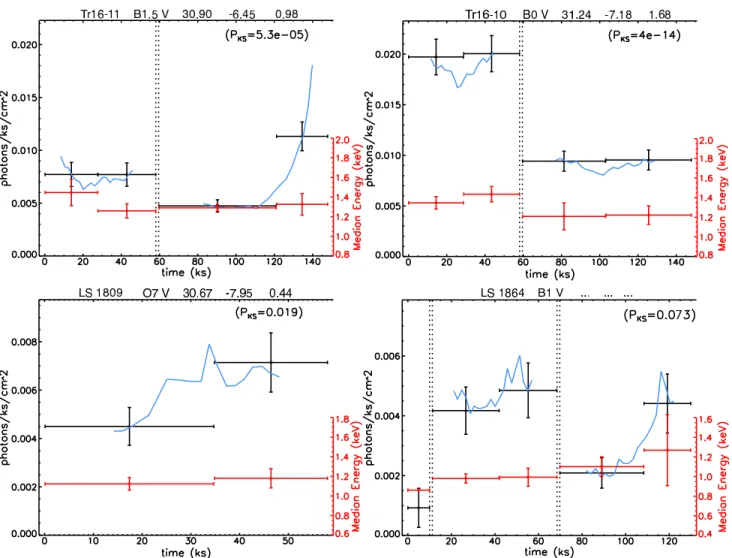
These stars are: SS73 24, Be pec, Tr16-64, B1.5 Vb, Tr16-10, B0 V, Tr16-5, B1 V, Tr14-28, B2 V, HD 93501, B1.5 III:, Coll228-68, B1 Vn, Tr14-124, B1 V, HD 93190, B0 IV:ep, Tr14-18, B1.5 V, LS 1813, B2 V, Tr16-11, B1.5 V, Tr14-19, B1 V, and Tr14-29, B1.5 V.
5. X-ray Timing Analysis
We have looked for time variability in the CCCP event data of the 129 X-ray detected OB stars in three ways: (1) we visually examined the sequenced and stacked corrected photon flux light curves, (2) we used the merged Kolmogorov-Smirnov test probability, PKS =
probks merge in the CCCP data products (Broos et al. 2010), and (3) we used a maximum likelihood procedure to divide the event data into blocks of approximately constant count rate. The latter, an IDL procedure mlb acis developed by E. Flaccomio, was used by Wolk et al. (2005) to identify flares in the Chandra Orion Ultradeep Project (COUP). An X-ray source is variable if an event list produces more than one maximum likelihood block. In mlb acis, the significance thresholds are calibrated as a function of counts using a large set of simulated constant count rate sources. For each star, the number of maximum likelihood blocks, assuming at least 5 counts per block, and 95% confidence, are listed in the last column of Tables 2, 3, and 4.
We note that the maximum likelihood procedure can find two maximum likelihood blocks for a constant source, if that source is observed in two OBSIDs at significantly different off-axis angles. This was not an issue in the study of Wolk et al. (2005) because the COUP observations were all centered on the Trapezium cluster – stars appeared at the same off-axis angle. We note that the photon flux curves produced by ACIS Extract are corrected for effective area and do not suffer this bias.
The sequenced photon flux light curves of the visually identified sources are shown in Figures 9 and 10. Some very bright sources like HD 93403 in the lower left panel of Fig. 9, show significant long- and short-term variability, and others like FO 15 in the upper left panel of Fig. 9 show clear long-term variability. None of the OB stars showed the characteristic rapid rise and slower decay of strong coronal flares (Wolk et al. 2005).
6. Notes on Individual Massive Star Systems
In this section we examine the X-ray, optical, infrared, and radio properties of the most X-ray luminous OB stars, dividing them into four categories based on spectral type and binary separation: astrometric O binaries, spectroscopic O+O binaries, apparently single O stars, including weak-wind stars, and B stars.
6.1. Single O-type Stars
Table 2 and Fig. 4 suggest that most single O stars have low LX/Lbol and low kT . Below
we consider the three single O stars with log LX/Lbol > −7 and kT > 1 keV: HD 93250,
MJ 496 = Tr16-22, and MJ 449 = LS 1865.
6.1.1. HD 93250, O4 III(fc)
The most X-ray luminous O star in Carina, and possibly the most enigmatic, is the Ofc star HD 93250, located east of Tr 14, and north of Tr 16. Though long classified as O3.5 V((f+)) (Walborn et al. 2002; Skiff 2009), Walborn et al. (2010) have reclassified it as O4 III(fc). They write, “The Ofc category consists of normal spectra with C III λλ4647-4650-4652 emission lines of comparable intensity to those of the Of defining lines N III
λλ4634-4640-4642.”
HD 93250 was observed far off-axis in a series of HETG/ACIS-S observations of η Car (see Appendix A). The merged ACIS-S spectrum in Figure 11 shows strong SiXIIIand SiXIV
emission lines and strong Fe Kα emission at 6.7 keV, mostly from Fe XXV, confirming the presence of extremely hot plasma ranging in temperature from 6-40 MK. Its mean 0.5-8 keV X-ray luminosity is LX ≈ 1.5 × 1033 ergs s−1, similar to the value found by Sanchawala et
al. (2007).
Figure 12 shows the LX light curve of HD 93250 based on the XSPEC fits to the
individual ACIS-I and ACIS-S datasets. In all but one OBSID, its X-ray luminosity is marginally consistent with a single value, LX ≈ 1.45 × 1033 ergs s−1. During the ACIS-I
OBSID 4495 when the source was marginally piled up, LX = 1.7 ± 0.1 × 1033 ergs s−1,
suggesting ∼ 20% time variability on time scales of months (between observations), not unlike the variability seen in a series of 21 XMM-Newton spectra of HD 93250 (Rauw et al. 2009).
derive a mass-loss rate ˙M = 1.4 ± 0.5 × 10⁻⁶M yr−1. This is a factor of 3-4 smaller than the
value estimated by Puls et al. (1996), who did not allow for wind clumping, yet somewhat larger than the recent estimate of Martins et al. (2005b), ˙M = 6 ± 2 × 10⁻⁷M yr−1.
Oskinova et al. (2007) have shown that the conventional treatment of wind clumping commonly used in stellar atmosphere codes (e.g., Martins et al. 2005b) leads to an under-estimate of empirical mass-loss rates by a factor of few. The mass-loss rate for HD 93250 derived from the CCCP spectral fits appears to be generally consistent with the findings of Oskinova et al. (2007).
Along with HD 93129A, HD 93250 is one of only two non-thermal radio O stars in Carina, and De Becker (2007) list it as a “suspected binary” on the basis of its X-ray and non-thermal radio emission. Rauw et al. (2009) note however that the only radio detection of HD 93250 is at 8.6 GHz (Leitherer et al. 1995). The radio flux is assumed to be non-thermal because, if it were non-thermal, the 8.6 GHz flux would suggest a mass-loss rate ˙M > 10−5M yr−1.
Though HD 93250 shows all the signatures of a colliding wind binary, an optical com-panion has yet to be detected. Nelan et al. (2004, and Nelan & Walborn 2010, private communication) found no evidence of a luminous astrometric companion in their HST FGS data, and Rauw et al. (2009) detected no statistically significant radial velocity variations (σ = 1.3 km s−1 using seven absorption lines over six epochs).
As Rauw et al. (2009) point out, we are left with two plausible scenarios: (i) a wide, massive binary that has evaded detection, or (ii) magnetically confined wind shocks around a single magnetic O4 star.
Magnetically confined wind shocks are difficult to reconcile with strong non-thermal radio emission. Though non-thermal radio emission would be produced in magnetized wind shocks, most of that emission would occur within a few stellar radii of the visible photosphere, well inside the radio photosphere. At 8.6 GHz, the wind of the O4 giant is optically thick out to hundreds of stellar radii (e.g., De Becker et al. 2004).
Given the similarity between the primary of HD 93403, O5 III(fc), and HD 93250, O4 III(fc), in both its optical and X-ray spectral properties, and given the observed corre-lation between shock temperature and binary period (see Fig. 13 and §6.3), we speculate that HD 93250 is a wide binary with an orbital period of 30-60 days. If the primary also possesses a strong magnetic field, high-S/N X-ray grating spectra will be needed to untangle the origin of the strong X-ray shocks.
index, and to confirm its non-thermal radio emission. In addition, spectro-polarimetric monitoring is needed to look for surface magnetic fields and measure the primary’s rotation period. Ground-based optical interferometry (e.g., Patience et al. 2008) is needed to look for a luminous companion inside the ∼ 20 AU limit imposed by the HST FGS.
6.1.2. Tr16-22 = MJ 496, O8.5 V
The single O8.5 V dwarf MJ 496=Tr 16 22 was detected with Chandra by Albacete-Colombo et al. (2008) and Sanchawala et al. (2007) and with XMM-Newton by Naz´e (2009) and Antokhin et al. (2008). Morrell et al. (2001) use Tr16-22 as a spectroscopic template for the O8 V secondary in the colliding wind binary HD 93205. Compared to the results in Table 3, Albacete-Colombo et al. (2008) derive similar, though slightly lower, kT1, kT2,
LX, and Lbol, and list Tr16-22 as a probable binary. Similarly, Evans et al. (2003) single
out Tr16-22 as a possible colliding wind binary. We note however that Tr16-22’s LX and
log LX/Lbol are higher than those of any late-O + late-O binary in Carina. As such, Tr16-22
is a good candidate for magnetically confined wind shocks. High-S/N spectro-polarimetric monitoring are needed to detect and measure its magnetic geometry.
6.1.3. MJ 449 = CPD-59 2610 = LS 1865, O8.5 V((f ))
The last of the apparently single O stars with very hot X-ray shocks is MJ 449 = LS 1865, O8.5 V((f)). We find log LX = 31.42 ± 0.20, log LX/Lbol = −6.90, kT1 = 0.59+0.1−0.3,
and kT2 > 3.1 keV, with comparable emission measure in the two thermal components (Naz´e
et al. 2011). Though MJ 449 is not shown in Fig. 10, it is most likely time variable, with PKS = 16%, and three maximum likelihood blocks. Like Tr16-22, MJ 449 is a candidate for
magnetically confined wind shocks, though its lower log LX/Lbolsuggests that other emission
mechanisms may be at work, including coronal emission from a PMS companion.
6.2. Astrometric Binaries
We first examine the orbital properties and radio emission of the four astrometric bi-naries detected with HST. Nelan et al. (2004) used a series of HST Fine Guidance Sensor observations (in high angular resolution mode 1r) to look for luminous companions around O and early B stars in Tr 14 and 16. The observations were typically sensitive to binary separations as low as ∼ 10 mas, or ∼ 23 AU at d = 2.3 kpc. We consider the four O stars
in Table 1 of Nelan et al. (2010). We note that Tr16-31=MJ 484, B0.5 V is a wide binary with a separation of 352 ± 2 mas (∼ 810 AU); it is not detected in the CCCP.
6.2.1. HD 93129A, O2 If∗
HD 93129A is the earliest O star in Carina, and one of the earliest known in the Galaxy. The O3.5 V((f)) star HD 93129B is located 2.7400 to the southeast (6300 AU at the distance of Carina) – HD 93129A and B are clearly resolved in the Chandra data. Nelan et al. (2004, 2010) discovered a luminous companion, HD 93129Ab, at a separation of 0.05300± 0.00300
(≈ 122 AU at 2.3 kpc), and ∆V = 0.9 ± 0.05 mag. Nelan et al. (2004) estimate the primary’s mass to be MAa ≈ 110M , and the secondary’s mass to be MAb≈ 70M , implying
an approximate spectral type o3.5 v for Ab, very similar to HD 93129B. An unpublished analysis by Maiz Apellaniz (2007) indicates that the Aa/Ab system may be approaching periastron in ∼ 2020.
HD 93129A is a strong non-thermal radio source (Benaglia et al. 2006). Benaglia et al. (2010) resolve the emission at 2.37 GHz into what appears to be a bow shock structure, consistent with a wind collision zone at the interface of Aa and Ab. Wide, massive binaries like HD 93129A are sometimes strong non-thermal radio sources because the wind collision zone is outside the radio photosphere of both stars (c.f., De Becker 2007).
Although hard X-ray emission and non-thermal radio emission are usually associated with colliding wind shocks in WR+O binaries, the Chandra ACIS-I data do not allow us to establish the location of the X-ray shocks within the HD 93129A system. We note that the system’s log LX/Lbol = −6.85 is higher than typical single, early-O stars in Table 2, and
the spectrum requires a 1.9 keV emission component with about 12% of the total emission measure.
A Chandra high-energy transmission grating spectrum of HD 93129A shows broad, asymmetric line profiles, and moderately weak He-like forbidden lines of SiXIII and Mg XI
that suggest that most of the X-rays are produced in wind shocks a few R? from the
photo-sphere (Cohen et al. 2010). The most likely explanation for HD 93129A’s X-ray and radio properties is that both mechanisms are operating: embedded wind shocks close to Aa and Ab, and colliding wind shocks between Aa and Ab.
6.2.2. HD 303308, O4.5 V((fc))
HD 303308 is the fifth most X-ray luminous O binary in Carina with a soft spectrum (kT ≈ 0.25 keV) and log LX/Lbol ≈ −6.89. Nelan et al. (2010) find a binary separation of
15 ± 2 mas, corresponding to ∼ 35 AU at d = 2.3 kpc, the closest of their five astrometric binaries. The apparent V magnitude difference was ∆V = 1.0 ± 0.3. Sota et al. (2011) find a spectral type of O4.5 V((fc)).
From the standpoint of its X-ray emission, HD 303308 is quite typical of other early-mid type O stars, though we cannot rule out some colliding wind emission in the zone between the two stars. We note that HD 303308 showed some evidence of time variability, with four maximum likelihood blocks, and PKS= 20%.
6.2.3. Tr16-9 = MJ 481, O9.5 V
Nelan et al. (2010) find a binary separation of 16 ± 2 mas for Tr16-9 = MJ 481, corre-sponding to ∼ 35 AU at d = 2.3 kpc, the second closest of their five astrometric binaries. MJ 481 shows low-level time variability, log LX/Lbol = −7.17, and a higher-than-average
kT1 = 0.70+0.2−0.1 keV (Naz´e et al. 2011). Like HD 303308, we cannot rule out some colliding
wind emission.
6.3. O+O Spectroscopic Binaries
The O+O binaries listed in Table 3 are among the best studied in Carina and among them HD 93403, HD 93205, HD 93343, Tr16-112, and QZ Car have been proposed as colliding wind binaries (Rauw et al. 2009; Morrell et al. 2001; Parkin et al. 2011).
We note however the wide variety of post-shock temperatures in these systems in Table 3. We find that the longer-period O+O spectroscopic binaries like HD 93403 (15.09 d), QZ Car (20.72 d), and HD 93343 (44.15 d) have high kT shocks, and the shorter-period systems like HD 93205 (6.08 d), Tr16-112 (4.02 d), and FO 15 (1.41 d), show only soft X-ray shocks. Figure 13 plots kTavg versus orbital period for the 11 spectroscopic binaries in Table 3. The
orbital periods are from the compilations of Rauw et al. (2009); Nelan et al. (2010).
For multiple systems like QZ Car, we use the orbital period of the primary in Fig. 13, because the primary pair accounts for most of the X-ray luminosity. For example, in QZ Car the A1/A2 pair with the O9.7 I primary accounts for ∼ 74% of the system’s X-ray flux (see Table 5, Parkin et al. 2011). For Tr16-110, O7 V + O8 V+ O9 V, a 2+1 spectroscopic binary,
the primary and secondary orbital periods are 3.63 and 5.03 days, respectively (Table 7, Rauw et al. 2009). We use P = 3.63 in Fig. 13, though both periods are short; either period yields the same correlation. Similarly, for Tr16-104, an eclipsing O7 V + O9.5 V binary bound to a B0.2 IV star, we use the 2.15-d primary orbital period. The orbital period of the B0.2 IV star is either 285 d or 1341 d (Rauw et al. 2001). We ignore the possible contribution of wind shocks with the distant B0.2 IV star.
Fig. 13 shows a correlation between orbital period and kT , with a Pearson’s linear correlation coefficient of 0.95. The correlation hinges on the three long-period systems with kTavg > 1 keV: HD 93403, QZ Car, and HD 93343. A larger sample of O+O binaries is
needed to confirm a correlation between orbital period or binary separation and average shock temperature. We note that the wide binaries η Car with Porb ≈ 5.54 yr (Gull et al.
2009), and WR 25 (WN6h + O) with Porb ≈ 207.7 d (Gamen et al. 2008), are consistent
with this correlation.
If such a correlation is confirmed, then the presence of a close, luminous companion (separation . 5R?) may significantly reduce the observed post-shock temperatures, and
thus the wind speed at the shock, whether those shocks are produced throughout the wind (EWS) or in the wind collision zone (CWS). Put another way, there may not be enough room to allow the winds to ramp up to terminal speed. In systems like FO 15 with low LX/Lbol
the emission measure and, hence, the density in the X-ray shocks may also be reduced. Including the astrometric binaries in our analysis, it appears that, as the binary sep-aration increases beyond a few tens of AU, the colliding wind shocks become weaker, as expected from adiabatic expansion (e.g., Antokhin et al. 2004), and the X-rays are domi-nated by embedded wind shock emission produced within a few R?. We emphasize that for
most O+O binaries, both mechanisms – embedded wind shocks and colliding wind shocks – may be at work.
6.3.1. HD 93403, O5 III(fc) + O7 V
The 15.093-d O5 III(fc) + O7 V eccentric (e = 0.234) binary HD 93403 is the most X-ray active O+O binary in Carina, with log LX ≈ 33.1 ergs s−1 and log LX/Lbol ≈ −6.4. In the
CCCP data, HD 93403 was observed in OBSIDs 9484, 9486 and 9891 (for the observation log see Table 1 of Townsley et al. 2011a). Naz´e et al. (2011) fit the combined ACIS-I spectrum with log NISM
H = 21.49 cm
−2, and find N?
H = 21.5 +0.06
−0.07, kT1 = 0.62+0.02−0.01 and kT2 = 1.6+0.06−0.05,
with approximately equal emission measure in each temperature component.
O5 III(fc) on the basis of its CIII emission lines. Using the common ephemeris of Rauw et al. (2000), P = 15.093 d and T0 = 51355.14 MJD, OBSIDs 9486 and 9491 occurred from
phase 0.15 to 0.28, and OBSID 9484 occurred from phase 0.44 to 0.48, near apastron, with similar exposure times in each phase range. We note that throughout this study we use the Chandra convention MJD = HJD − 2400000.5, rather than the more common convention HJD − 2450000.0 to express T0. The lower left panel of Fig. 9 shows the sequenced light
curve of HD 93403.
In the most comprehensive examination of HD 93403’s X-ray light curve to date, Rauw et al. (2002) use a series of ROSAT HRI and XMM-Newton MOS1 photometry and PN spectra to show a clear orbital modulation of its X-ray luminosity with orbital phase, with X-ray maximum occurring at φ = 0.0 (periastron). The lower mean count rate at the beginning of the HD 93403 light curve, corresponding to 0.44 < φ < 0.48, suggests an X-ray minimum near apastron.
The short-term variability seen throughout the three Chandra observations, though small, is statistically significant. The rapid variability amplitude varies from 5 − 15%, and is comparable to the 20% long-term variability amplitude reported by Rauw et al. (2002).
Rauw et al. (2002) used a greater distance to Carina, d = 3.2 kpc, and a higher ISM column density, log NISM
H = 21.56 cm
−2. They found a 0.5-2.5 keV log L
X≈ 33.57 ergs s−1.
Applying a distance d = 2.3 kpc yields log LX ≈ 33.28 ergs s−1 in the 0.5-2.5 keV band for
the mean of the four XMM observations.
Using Rauw et al. (2002)’s higher ISM column density, we find a CCCP 0.5-2.5 keV log LX≈ 33.19 ergs s−1 during the CCCP observations in 2008 August, only 19% lower than
the XMM-Newton observations in 2000 December and 2001 February. Overall the CCCP spectral and timing analysis of HD 93403 confirms the results of Rauw et al. (2002).
6.3.2. HD 93205, O3.5 V((f )) + O8 V
Morrell et al. (2001) present the definitive study on HD 93205 from an extensive set of ground-based spectroscopic, IUE far ultraviolet, and ROSAT X-ray observations. They find a 6.0803±0.0004-d orbital period, primary and secondary masses of 52−60M and 22−25M ,
an orbital inclination of about 55◦, an orbital eccentricity e = 0.37, an apsidal period of 185 ± 16 yr, and phase-locked X-ray variability, with X-ray maximum near periastron.
HD 93205’s CCCP light curve in Fig. 9 shows a slow steady decline over the 1 day observation, which began and ended at MJD 53977.794 and 53978.817. From the combined
ephemeris in Table 4 of Morrell et al. (2001) in which T0 = 50498.589 MJD, OBSID 4495
began at orbital phase φ = 0.21 ± 0.04 and ended at phase φ = 0.38 ± 0.04, during which the average X-ray parameters were log LX ≈ 32.55 ergs s−1, log LX/Lbol = −6.82, kT1 =
0.23±0.01, and kT2 = 0.74±0.03, with most of the emission measure in the cooler component
(Naz´e et al. 2011).
This is the end of the declining phase in the ROSAT HRI light curve in Fig. 8 of Morrell et al. (2001). Our results thus support the X-ray periodicity of Morrell et al. (2001). Its high LX/Lbol is similar to other binaries with early-O primaries. As with the other short-period
binaries, the colliding wind shock temperatures do not exceed 1 keV.
6.3.3. Tr16-112 = LS 1874 = CPD-59 2641 = MJ 535, O5.5-O6 V(n)((fc)) + B2 V Rauw et al. (2009) presented a detailed multiplicity study of three X-ray luminous Carina O stars as part of the X-Mega project3: Tr16-112, HD 93343 and HD 93250. Based
on a long series of medium- and high-resolution spectra of Tr16-112, they obtained spectral types of O5.5-6 V((f)) and B2 V, for the primary and secondary. Sota et al. (2011) revised the primary spectral type to O5.5-O6 V(n)((fc)).
Rauw et al. (2009) find an orbital period P = 4.0157 d, eccentricity e = 0.15 ± 0.01, inclination i = 54◦+4−3, primary and secondary masses M1 = 41.0 ± 2.5M and M2 = 11.7 ±
0.6M , and periastron passage time T0 = 54559.810 ± 0.060 MJD. They estimate that the
primary fills 34 of its Roche lobe.
In the CCCP data, Tr16-112 was observed in OBSID 6402 in 2006 August during which time it showed no signs of variability, with PKS = 53% and only one maximum likelihood
block (95% confidence). OBSID 6402 began and ended at MJD 53977.78 and 53978.83, corresponding to orbital phases 0.06 and 0.32 in Tr16-112. That is close to periastron passage, though we note that the orbit is not highly eccentric. This short-period binary has kTavg ≈ 0.35 keV.
6.3.4. HD 93343, O8 V + O7-8.5 V
Rauw et al. (2009) present the first comprehensive analysis of the double-lined spec-troscopic binary HD 93343. They find a set of sharp lines associated with the less massive
O8 V secondary moving in opposite phase to the higher-mass O8 V primary. They note that the spectral type of the secondary could be in the range O7-O8.5 V. They find a period of ≈ 44.15 days, though they were not able to establish an absolute ephemeris.
For HD 93343 we note log LX = 31.66 ± 0.24, log LX/Lbol ≈ −6.98, kT1 = 0.70+0.13−0.09,
and kT2 > 6.5 keV, with comparable emission measure in each temperature component.
HD 93343 showed no evidence of time variability in OBSID 6402.
Antokhin et al. (2008) found kT1 = 0.29+0.04−0.05, kT2 = 2.8+1.5−1.4, and log LX ≈ 32.2, a factor
of 3 more luminous in the 0.4-10 keV band with XMM than was found in the same band with Chandra (Naz´e et al. 2011), with most of the added luminosity in the XMM fit in the softer component.
Further optical spectroscopic monitoring is needed to establish a firm ephemeris for HD 93343. Further Chandra observations would provide a better estimate of the shock temperatures, and a third estimate of LX to confirm the variability. An X-ray maximum
near periastron would signal a colliding-wind binary. Spectropolarimetric monitoring could reveal the presence of large-scale magnetic fields on one or the other star.
For now, we consider HD 93343 a CWS X-ray source, so we include it in Fig. 13. We note though that the hard shocks seen on HD 93343 with Chandra are not predicted by Pittard (2009) in their colliding wind binary model cwb3, an O6 V + O8 V binary with a 10.7-d period, the closest model to HD 93343. The predicted temperature distributions are somewhat consistent with the Antokhin et al. (2008) result, however.
6.3.5. The Short-Period Eclipsing Binary FO 15, O5.5 Vz + O9.5 V
The double-lined eclipsing binary FO 15 was first typed by Forte & Orsatti (1981) and studied in detail by Niemela et al. (2006). Its circular period is 1.413560 ± 0.000003 d with T0 = 53159.0 ± 0.2 MJD, i ≈ 80◦, and primary and secondary masses M1 = 30.4 ± 1.0M
and M2 = 15.8 ± 1.0M . The stellar radii are R1 ≈ 7.5R and R2 ≈ 5.3R and the Roche
lobe radii are just 8.3R and 6.15R . The semi-major axis is a = 19.1R , implying the
photospheres are separated by ∼ 3R1.
The “z” spectral type indicates strong He II λ4686 absorption suggesting the primary is on the ZAMS (c.f., Walborn & Blades 1997). Located in the south pillars (see Povich et al. 2011b), FO 15 is a ZAMS-age O+O binary, with a separation of only 3R?, in a region
of active star formation. Moreover, Niemela et al. (2006) note the absence of wind features in both stars at most phases. They suggest that both O dwarfs may be weak-wind stars