Study of Langmuir-Blodgett Films of Self-Assembled Diblock Copolymers
par Kateryna Borozenko
Département de chimie Faculté des arts et des sciences
Mémoire présenté à la Faculté des études supérieures et postdoctorales en vue de l’obtention du grade de maître ès sciences (M.Sc.) en chimie»
Juillet 2015
Université de Montréal
Faculté des études supérieures et postdoctorales
Ce mémoire intitulé:
Study of Langmuir-Blodgett Films of Self-Assembled Diblock Copolymers
Présenté par: Kateryna Borozenko
a été évalué par un jury composé des personnes suivantes:
Présidente-rapporteuse: Antonella Badia Directrice de recherche: Geraldine Bazuin Codirecteur: Christian Pellerin Membre du jury: Suzanne Giasson
Résumé
L'auto-assemblage des copolymères à bloc (CPBs) attire beaucoup d'intérêt grâce à leur capacité de générer spontanément des matériaux ordonnés avec des propriétés uniques. Les techniques Langmuir-Blodgett (LB) et Langmuir-Schaefer (LS) sont couramment utilisées pour produire des monocouches ou des films ultraminces à l'interface air/eau suivi de transfert aux substrats solides. Les films LB/LS de CPBs amphiphiles s'auto-assemblent dans des morphologies variables dépendamment de la composition du CPB ainsi que d'autres facteurs. Dans notre travail, nous avons étudié les films LB/LS de polystyrène-b-poly(4-vinyl pyridine) (PS-P4VP) et leurs complexes supramoléculaires avec le naphtol (NOH), l'acide naphtoïque (NCOOH) et le 3-n-pentadécylphenol (PDP).
La première partie de ce mémoire est consacré à l'investigation du PS-P4VP complexé avec le NOH et le NCOOH, en comparaison avec le PS-P4VP seul. Il a été démontré qu'un plateau dans l'isotherme de Langmuir, indicatif d'une transition de premier ordre, est absent à des concentrations élevées des solutions d'étalement des complexes. Cela a été corrélé avec l'absence de morphologie en nodules avec un ordre 2D hexagonal à basse pression de surface. L'ordre au-delà de la pression de cette transition, lorsque présente, change à un ordre 2D carré pour tout les systèmes.
La deuxième partie du la mémoire considère à nouveau le système PS-P4VP/ PDP, pour lequel on a démontré antérieurement que la transition dans l'isotherme correspond a une transition 2D d'un ordre hexagonal à un ordre carré. Cela est confirmé par microscopie à force atomique, et, ensuite, on a procédé à une étude par ATR-IR des films LB pour mieux comprendre les changements au niveau moléculaire qui accompagnent cette transition. Il a été constaté que, contrairement à une étude antérieure dans la littérature sur un autre système, il n'y a aucun changement dans l'orientation des chaînes alkyles. Au lieu de cela, on a découvert que, aux pressions au-delà de celle de la transition, le groupe pyridine, qui est orienté à basse pression, devient isotrope et qu'il y a une augmentation des liaisons hydrogènes phénol-pyridine. Ces observations sont rationalisées par un collapse partiel à la pression de transition de la monocouche P4VP, qui à basse pression est ordonné au niveau moléculaire.
Cette étude a mené à une meilleure compréhension des mécanismes moléculaires qui se produisent à l'interface air/eau, ce qui fournit une meilleure base pour la poursuite des applications possibles des films LB/LS dans les domaines de nanotechnologie.
Mots-clés : copolymères à bloc, auto-assemblage, Schaefer, Langmuir-Blodgett, isotherme de Langmuir, monocouche, interface air/eau, AFM, ATR-IR, PS-P4VP, PDP, NOH, NCOOH.
Abstract
Self-assembly of block copolymers (BCPs) attracts much interest due to their ability to spontaneously generate ordered materials with unique properties. For many applications, such as masks in nanolithography, separation membranes in medical diagnostics, and nanotemplates for nanowire fabrication, manufacturing into thin films is required. The Langmuir-Blodgett (LB) and Langmuir-Schaefer (LS) techniques are commonly used to produce ultrathin or monolayer films at the air/water interface that are transferred to solid substrates. LB/LS films of amphiphilic BCPs self-assemble into various morphologies, depending on the BCP composition and other factors. In our work, we investigated LB/LS films of polystyrene-b-poly(4-vinyl pyridine) (PS-P4VP) and their supramolecular complexes with, naphthol (NOH), naphthoic acid (NCOOH) and 3-n-pentadecylphenol (PDP).
The first part of the thesis was devoted to the investigation of PS-P4VP complexes with NOH and NCOOH, in comparison to PS-P4VP alone. It was shown that a plateau in the Langmuir isotherm, indicative of a first-order transition, is absent at high spreading solution concentrations for the complexes. This was correlated with an absence of the expected dot morphology with 2D hexagonal-like order at low surface pressure. Above the transition, when present, the morphology has 2D square order.
The second part of the thesis re-examines the PS-P4VP/PDP system, which was previously shown to undergo a transition from 2D hexagonal to square order at the isotherm plateau pressure. This was confirmed here, and a detailed ATR-IR study of LB films was then undertaken to better understand molecular-level changes occurring at this transition. It was found that, contrary to another study in the literature on a different system, there is no change in alkyl chain orientation. Instead, it was found that the pyridine group loses its low-pressure orientation and there is increased phenol-pyridine hydrogen-bonding above the transition pressure, which is rationalized by a partial collapse of the low-pressure molecularly ordered P4VP monolayer at the transition pressure.
This study leads to an improved understanding of the processes occurring at the air/water interface, which is a basis for the further possible applications of LB/LS films in nanotechnologies.
Keywords : block copolymers, self-assembly, Blodgett, Langmuir-Schaefer, Langmuir isotherm, monolayer, air/water interface, AFM, ATR-IR, PS-P4VP, PDP, NOH, NCOOH.
Table of contents
Résumé ... iii
Abstract ... v
Table of contents ... vii
List of Figures ... ix
List of Abbreviations... xiii
Acknowledgements ... xiv
CHAPTER 1 INTRODUCTION ... 1
1.1. Self-assembly of block copolymers ... 2
1.1.1. Self-assembly in the bulk ... 4
1.1.2. Self-assembly in films ... 6
1.1.3. Self-assembly in solution ... 6
1.2. Amphiphilic diblock copolymers of PS-P4VP and supramolecular PS-P4VP complexes ... 7
1.3. Langmuir-Blodgett and Langmuir-Schaefer techniques (ultrathin films) ... 9
1.3.1. Some historical aspects ... 9
1.3.2. Langmuir isotherms ... 10
1.3.3. Langmuir-Blodgett (LB) and Langmuir-Schaefer (LS) techniques ... 12
1.4. Infrared spectroscopy ... 15
1.4.1. General principles of ATR-IR ... 17
1.4.2. Determination of orientation by ATR-IR ... 18
1.5. Previous investigations of morphology formation in LB diblock copolymer films ……... ... 22
1.6. Objectives and structure of the thesis ... 26
CHAPTER 2 EXPERIMENTAL DETAILS ... 28
2.2. Methods ... 31
2.2.1. Solution and sample preparation. Langmuir-Blodgett and ... 31
Langmuir-Schaefer films ... 31
2.2.2. Atomic force microscopy imaging ... 32
2.2.3. ATR-IR spectroscopy of ultrathin films... 33
CHAPTER 3 RESULTS AND DISCUSSION ... 34
3.1. PS-P4VP/naphthol and PS-P4VP/naphthoic acid systems and effect of spreading solution concentration ... 35
3.1.1. Langmuir compression isotherms ... 35
3.1.2. Langmuir - Blodgett and Langmuir - Schaefer monolayer morphologies... 38
3.1.3. Dimensions of nanofeatures ... 47
3.1.4. Conclusions ... 51
3.2. PS-P4VP/PDP system. From macroscopic 2D order-order transition to molecular level reorganization ... 53
3.2.1. Confirmation of order-order transition ... 53
Appendix ... 69
CHAPTER 4 CONCLUSIONS AND FUTURE WORK ... 73
List of Figures
Figure 1-1. Examples of self-assembling structures in nature. ... 3 Figure 1-2. Microdomain phase separation of diblock copolymers in the bulk. ... 5 Figure 1-3. Transition between lamellae and perpendicular cylinders structure in dip-coated film PS(252k)-P4VP(43k)/PDP occurred after 17 h of chloroform vapour annealing at high pressure ... 9 Figure 1-4. Langmuir-Blodgett compression isotherm of a phospholipid showing
different phases: G – gaseous, L1 – liquid expanded, L2 – liquid condensed,
S – solid. ... 11 Figure 1-5. a) Langmuir trough (KSV 3000). b) The chemical structure of a typical LB compatible molecule with an aliphatic tail and a carboxylic acid head. ... 13 Figure 1-6. Langmuir-Blodgett deposition of monolayers from the water surface to a solid substrate.. ... 14 Figure 1-7. Two different types of Langmuir-Schaefer deposition. ... 15 Figure 1-8. The principle of attenuated total reflection.. ... 18 Figure 1-9. Schematic of the uniaxial orientation in an ultrathin film measured by polarized ATR.. ... 19 Figure 1-10. Schematic image of the main morphology types in LB monolayers of amphiphilic diblock copolymers ... 22 Figure 1-11. (A) Langmuir compression isotherm of PS-P4VP(29%)/PDP at the air/water interface. (B) Model of order-order transition as a result of barrier compression. (C-H) AFM height images (5 x 5 μm2) of Langmuir-Blodgett (LB, in C-H) and Langmuir-Schaefer (LS, in G) monolayer films transferred at the surface pressures (π) indicated. ... 23 Figure 1-12. Height profiles of AFM images (500 x 250 nm2) of LB films transferred at 30 and 40 mN/m respectively... 25 Figure 2-1. Molecular structure of PS-P4VP and the small molecules
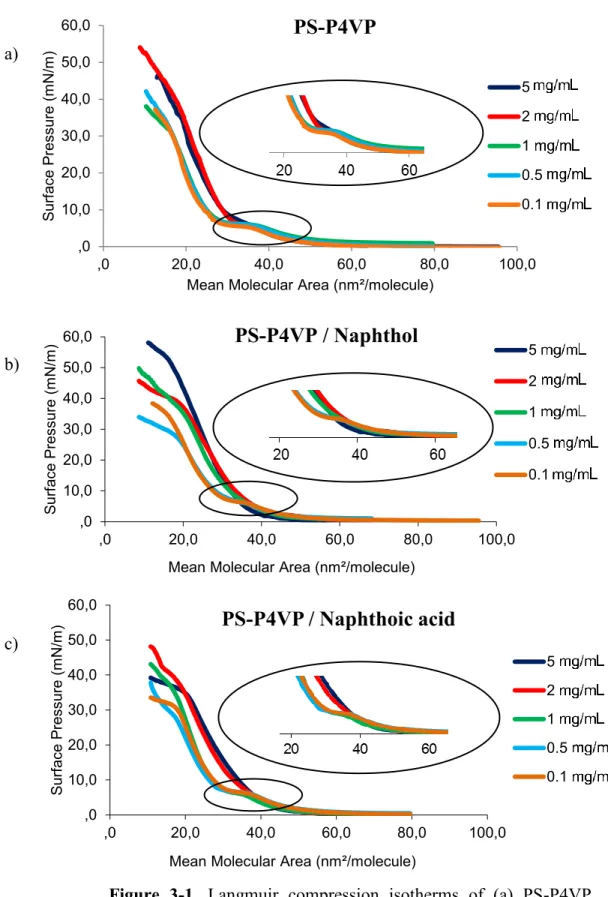
Figure 3-1. Langmuir compression isotherms of (a) PS-P4VP, (b) PS-P4VP/naphthol, (c)
PS-P4VP/naphthoic acid spread at 21.0±0.5ºC from CHCl3 solution at the concentrations
indicated………...36
Figure 3-2. Langmuir compression isotherm of naphthoic acid spread from CHCl3
solution(concentration 1.8 mg/mL)……….37
Figure 3-3. Langmuir compression isotherms of P4VP(30.3%)/PDP and
PS-P4VP(46%) at the air/water interface. AFM height images (3x3 μm2) of Langmuir-Blodgett monolayer films transferred onto mica at the surface pressures indicated………..….54
Figure 3-4. IR spectra in p-polarization for LB films of PDP and PS-P4VP(30.3%)/PDP
transferred onto a silicon crystal at the surface pressures (π) indicated, in comparison to the bulk spectrum of PDP in the crystalline state………..56
Figure 3-5. Polarized ATR spectra of Langmuir-Blodgett PS-P4VP(30.3%)/PDP films
transferred to a silicon crystal at surface pressures of 25 and 45 mN/m (below and above the isotherm plateau value)………..………59
Figure 3-6. IR spectra in p-polarization for LB films of PDP, P4VP(46%) and
PS-P4VP(30.3%)/PDP transferred on silicon substrates at the surface pressures (π) indicated………..….62
Figure 3-7. Model describing the molecular organization of the PS-P4VP(30.3%)/PDP
system below and above the plateau pressure in the Langmuir isotherm………....66
Figure S1. Langmuir compression isotherm of PS-P4VP(46%) at the air/water interface spreaded from the solution with concentration of 1.8 mg/mL. AFM height images (3x3 μm2) of Langmuir-Blodgett monolayer films transferred on mica at the surface pressures (π) indicated………...69 Figure S2. Langmuir compression isotherm of PS-P4VP(30.3%) (green curve) and PS-P4VP(46%) (pink curve) at the air/water interface. AFM height images (3x3 μm2) of Langmuir-Blodgett monolayer films transferred on mica at the surface pressures (π) indicated………..…..70 Figure S3. IR spectra of Langmuir-Blodgett PS-P4VP(30.5%)/PDP films transferred at a surface pressure of 45 mN/m in comparison to bulk spectra of pure melted PDP, P4VP, PS and the uncomplexed PS-P4VP(46%) copolymer………....71 Figure S4. IR spectra of Langmuir-Blodgett PS-P4VP(30.3%)/PDP films transferred at a surface pressure of 45 mN/m in comparison to bulk spectra of pure melted PDP, P4VP, PS and the uncomplexed PS-P4VP(30.3%) copolymer……….72
Figure 4-1. Langmuir compression isotherm of PS-P4VP(30%)/OBA system spread from CHCl3 solution (1.8 mg/mL) at 21±0.5ºC.AFM height images (3x3 μm2) of
Langmuir-Schaefer monolayer films transferred on mica at the surface pressures (π) indicated………77
List of Tables
Table 3-1. AFM height images of LB and LS films of pure PS-P4VP prepared from different solution concentrations and transferred at two different surface pressures (π)………...39 Table 3-2. AFM height images of LB and LS films of PS-P4VP/NOH prepared from different solution concentrations and transferred at two different surface pressures (π)………...42 Table 3-3. AFM height images of LB and LS films of PS-P4VP/NCOOH prepared from different solution concentrations and transferred at two different surface pressures (π)………...44 Table 3-4. PS-P4VP, PS-P4VP/NOH, PS-P4VP/NCOH systems. Solution concentration dependence on the LB films morphologies……….46
Table 3-5. Heights, widths and center-to-center distances of the nanofeatures in LB films of PS-P4VP, PS-P4VP/NOH, PS-P4VP/NCOOH spread from different solution concentrations and transferred at π = 2 mN/m………...49 Table 3-6. Heights, widths and center-to-center distances of the nanofeatures in LB films of PS-P4VP, PS-P4VP/NOH, PS-P4VP/NCOOH spread from different solution concentrations and transferred at π = 10 mN/m………...……..50 Table 3-7. The precise CH2 band positions of different samples………..57
Table 3-8. <P2> value quantified from polarized ATR spectra of
PS-P4VP(30.3%)/PDP LB films (n = 3) transferred on silicon substrate at surface pressures indicated for the designated bands……….60 Table 3-9. Band positions of the P4VP pyridine ring and PDP phenol group for the transfer surface pressures (π) indicated………..63
List of Abbreviations
π surface pressure
3D three-dimensional
AFM atomic force microscopy
ATR-IR attenuated total reflection infrared spectroscopy DNA
FFT
deoxyribonucleic acid
fast Fourier transform
HABA 2-(4′-hydroxybenzeneazo)benzoic acid
LB Langmuir-Blodgett
LS Langmuir-Schaefer
MSEF mean square electric field
NCOOH 1-naphthoic acid
NOH 1-naphthol
P4VP poly(4-vinyl pyridine)
PDP 3-n-pentadecylphenol
PS Polystyrene
PS-P4VP polystyrene-b-poly(4-vinyl pyridine) PS-PEO polystyrene-b-poly(ethylene oxide)
RNA ribonucleic acid
Acknowledgements
This thesis work would not be possible without the guidance of my supervisors, Prof. C. Géraldine Bazuin and Prof. Christian Pellerin. I would like to express my gratitude to them for allowing me to carry out this project in their esteemed groups, financial support and coverage of my trips to scientific conferences and for their endless understanding and kindness. I will never forget it.
I acknowledge Marie Richard-Lacroix for her substantial contribution to our collaborative work, her ideas and energy that led our joint project to good results.
I thank Dr. Iryna Perepichka who was the first person who introduced me to the world of polymers, taught me essential skills to work in the laboratory and supported me during my summer internships in 2010 and 2011.
I am grateful to Prof. Antonella Badia and Prof. Géraldine Bazuin for the opportunity, financial support and allowing me to gain valuable experience during my summer internships in 2010 and 2011, which was the starting point of my growing scientific interest to the research.
I am appreciative to all members of both groups, particularly, Anna Gittsegrad, who helped me during my Master’s program and thesis editing.
Finally, I express my deep gratitude to my family for their encouragement and constant support, especially, to my sister Olga Borozenko, who defended her Ph.D dissertation in Chemistry in May 2014 at the Université de Montréal, and thereby inspired me to the successful writing of my thesis.
CHAPTER 1
INTRODUCTION
1.1. Self-assembly of block copolymers
The tendency to miniaturize of objects has given a powerful impulse to the development of nanoscience and nanotechnology. By itself, nanotechnology is based on the ability to design highly accurate nanostructures and nano-objects with well-defined shape, size and order. There are two general approaches for the creation of such structures: “top-down” and “bottom-up”.1 The "top-down" approach to nanotechnology involves the creation of "nano-objects" from a parent entity that is larger. This type of fabrication uses traditional workshop or microfabrication methods, such as lithographic patterning techniques, with externally controlled tools. The main problem of such an approach is damage of crystal structure. The “top-down” approach is limited in the smallest dimensions it can reach, especially in a high throughput, cost-effective manner. For small structures, the “bottom-up” approach is very appealing. This approach to nanotechnology uses the molecular self-assembly process based on chemical or physical forces acting at the nanoscale to assemble basic units into larger structures.2 Self-assembly is the spontaneous association of components into particles or structures without human intervention; it can be static or dynamic. In the case of static self-assembly, the system approaches equilibrium, reducing its free energy. Dynamic self-assembly is the spontaneous and reversible organisation of molecular units into an ordered structure through non-covalent interactions.3
The most famous and most visual example of self-assembly occurring in nature is the double-helix of DNA (Figure 1-1a). The single chain of DNA is a sequence of nucleotides consisting of phosphates, sugars and bases. The chains have a helix shape to minimize the contact of water-insoluble parts (bases) with the cell environment. Bases are attached to the sugar-phosphate main chain. To avoid contact with water they tuck themselves into the center of a folded structure. A single chain with this structure leaves large empty spaces between base pairs, which is unacceptable. To solve this, a second helix of DNA provides base pairs to form enthalpically favorable double-stranded chains, where two single chains are held together by hydrogen bonds. Thus adenine (A) forms two hydrogen bonds with
thymine (T) and guanine (G) forms three with cytosine (C) (Figure 1-1b). Thus, due to the additional H-bond, the G-C pair is more stable than the A-T pair.4,5
Another example of a well-studied self-assembled natural system is the tobacco mosaic virus (Figure 1-1c)6. This rod-shaped virus consists of a series of self-assembled double-layered protein disks with an RNA chain embedded in the central hole of the virus. In order to recognize the protein disks, the RNA chain should have a specific 3D structure and the base pairs must be complementary with the protein sequence of the disk. Only in such conditions will the specific construction of the virus through self-assembly take place.7-9
a) b) c)
In the past century, synthetic polymers have become an essential part of everyday life. Based on the principles of self-assembly borrowed from nature and further applied to polymers, in particular to block copolymers, it became possible to generate highly ordered polymer structures with molecular level control and precision. These self-assembled polymers provide simple, parallel and cost effective processes for nanofabrication.10,11 The self-assembly of block copolymers Figure 1-1. Examples of self-assembling structures in nature.
a) Double helix of DNA chains. b) Complementary pairs of DNA nucleotides (dashed lines indicate H-bonding). c) Tobacco mosaic virus. Image a is courtesy of the US National Library of Medicine. Image c Reprinted with permission from ref. 7. Copyright 2005 American Chemical Society.
in the bulk and thin films is reviewed in the following sections. Since ultrathin films of block copolymers obtained by the so-called Langmuir-Blodgett (LB) technique is the main subject of the thesis, this technique will then be presented along with molecular orientation determination using an infrared technique (ATR-IR). Previous literature on the morphology of LB monolayers of diblock polymers will then be summarized, to finally present the objectives of this thesis.
1.1.1. Self-assembly in the bulk
Historically, studies of block copolymer self-assembly began with the bulk phase. Bulk block copolymer morphologies are characterized by well-ordered microdomains.12 Phase separation into microdomains occurs when two blocks are immiscible, and is influenced by the two thermodynamic effects, entropy and enthalpy. Below a critical (order-disorder transition) temperature, an enthalpic effect drives the blocks to phase separate. The entropic effect dominates at temperatures higher than the critical temperature and results in homogenous mixing of the polymer chains.13 Microscopic phase separation of the blocks promotes the formation of a variety of morphologies, such as spheres (S), cylinders (C), bicontinuous gyroids (G) and lamellae (L) (Figure 1-2a).14 For a diblock copolymer, this depends on two main parameters, the A and B block volume fractions, fA and fB, where fA + fB = 1, and the segregation parameter χN, where N is the total degree of polymerization (N = NA + NB) and χ is the Flory–Huggins interaction parameter that varies inversely with temperature and specifies the degree of incompatibility between the A and B blocks (Figure 1-2b).14 The correlation between χAB and temperature (T) is given by equation 1.15,16
𝜒𝐴𝐵 = 𝑧 𝑘𝐵𝑇 𝜀𝐴𝐵 − 1 2 𝜀𝐴𝐴 + 𝜀𝐵𝐵 (1)
where z is a number of nearest neighbours per repeat unit in the polymer, kB is the Boltzmann constant, kBT is the thermal energy, εAB, εAA, and εBB are the interaction
a)
b)
Nano-objects obtained by block copolymer self-assembly, such as nanowires, nanorods and nanofibers, have a large variety of potential applications in electronic and optical devices. In addition, mesoporous materials, obtained by removing selected parts of the material (e.g. small molecules dissolved selectively in the minority phase) can be used as functional membranes in technological applications.17-20 However, many other important applications require block copolymers to be assembled in the form of thin films.
Figure 1-2. Microdomain phase separation of diblock copolymers in the bulk. a) Various morphologies of diblock copolymers as a function of the volume fraction, fA, of the A block. b) Theoretical phase diagram of diblock copolymers in the bulk, predicted by the self-consistent mean field theory and the equilibrium morphologies as a function of fA, and the segregation parameter, χN. Reproduced from ref. 15 with permission from The Royal Society of Chemistry.
1.1.2. Self-assembly in films
Films are often categorized as “thick” or “thin” (sometimes “ultrathin”). Thick films are generally of the order of micrometers or more in thickness, and block copolymer morphologies behave as in the bulk. They are often prepared by solvent casting. Thin films of block copolymers, which are generally less than 500 nm thick, are influenced not only by the same parameters as in the bulk, but also by the interfacial interactions of the blocks with the underlying substrate and of the free surface with air as well as by commensurability of the natural block copolymer periodicity and the film thickness.12 They are typically prepared by spin-coating or dip-coating, sometimes followed by solvent annealing to obtain longer-range order. Ultrathin films sometimes have molecular-level thicknesses: this term applies, for example, to “monolayer” films prepared by the Langmuir-Blodgett technique, which is discussed in section 1.3. The list of potential applications of block copolymer thin films is long and continues to grow. Thanks to their two-dimensional order, they are widely used as nanotemplates in nanolithography, for the fabrication of ordered particle arrays and carbon nanotube arrays and as nanoporous membranes for virus filtration and drug delivery.21-27
1.1.3. Self-assembly in solution
When it comes to microphase separation of diblock copolymers in solution, the term "amphiphilic" is often used. Amphiphilicity is the ability to exhibit affinity to both hydrophilic and hydrophobic environments. However, this term can be applied not just to aqueous solutions, but also with respect to systems that comprise two incompatible solvents.28 Besides the parameters, χ
AB, N, fA and fB, mentioned
above, that govern the morphologies formed in the bulk, the presence of a solvent (S) introduces new Flory-Huggins interaction parameters. These are χAS and χBS,
which describe theinteractions between the solvent and each block.29,30 When the solvent is compatible with both blocks (“neutral” solvent, χ of both blocks is below 0.5), the chains are molecularly dissolved. In contrast, if the solvent is highly
selective for one of the blocks and χ is above 0.5 for both blocks, micelle or vesicle formation occurs, depending on the volume fraction of the blocks. For example, when χAS >> χBS, theblock copolymer chains form a micelle core from the insoluble
block A and a corona from the soluble block B. Such block copolymer micelles are interesting analogues to surfactant micelles due to their high flexibility, high stability and ability to form a wide range of different molecular structures.31
The span of block copolymer applications in solution is broad. One of the most important areas of block copolymer use is for drug delivery. The micellar systems obtained by spontaneous assembly of block copolymers with well controlled and large variety of structure and functionality can be vehicles for different types of drugs. The hydrophobic-hydrophilic nature of block copolymers allows formation of complexes with drugs through non-covalent interactions with subsequent transportation to the target area. A wide range of studies have led to successful block copolymer-based drug delivery systems for anticancer drug therapy, delivery of DNA to the cells, and modification of drug pharmacokinetics that leads to increased efficiency of the drug used and decreased side effects. Another smart and not less important application of amphiphilic copolymers is sequestration in solution. For example, micelles formed from amphiphilic copolymers in aqueous solution can sequester hydrophobic compounds in their hydrophobic interior. This allows such systems to be used for the extraction of organic molecules as well as organic solvents.28
1.2. Amphiphilic diblock copolymers of PS-P4VP and supramolecular PS-P4VP complexes
The first and the main advantages of supramolecular complexes include the ease of small molecule substitution and obtaining new functional materials instead of synthesizing new ones.32,33
Polystyrene-poly(4-vinyl pyridine) (PS-P4VP) diblock copolymers have often been chosen for studies of self-assembling systems due to the wide variety of compositions that are commercially available and because the P4VP block can be
modified by protonation, quaternization and coordination chemistry (all forms of supramolecular chemistry). Earlier studies focused on the behaviour in the bulk.34-36 Morphology control in thin films of PS-P4VP systems has been a subject of more recent investigations.37-40
In general PS-P4VP is an amphiphilic block copolymer, where PS is the hydrophobic part and P4VP is the hydrophilic part. A variety of different structures in the bulk and in thin films can be obtained by changing conditions, such as the nature of the solvent, fraction of blocks in the copolymer, experimental conditions such as temperature, compression force, compression rate, etc. Some specific examples are given below.
The addition of block-selective small molecules to block copolymers, leading to the formation of supramolecular complexes, is an effective way of producing self-assembled structures with tunable morphologies. A commonly used strategy is to add hydrogen-bonding small molecules to a diblock copolymer with one block that is a hydrogen bond acceptor. This has been studied most frequently with PS-P4VP. The block selectivity results in an increase in the volume fraction of the P4VP phase that leads to the morphological transformations.37 Ikkala, ten Brinke and coworkers were among the leaders who established the basic principles of construction of supramolecular block copolymers in the bulk by the attachment of small molecules via different types of interactions, such as electrostatic interactions, metal coordination and, especially, hydrogen bonding. 20,36,20,41-42
Frequently used small molecules for supramolecular complexes with PS-P4VP are 3-n-pentadecylphenol (PDP) and 2-(4′-hydroxybenzeneazo)benzoic acid (HABA). Ikkala, ten Brinke and coworkers and Tung and coworkers used PDP and demonstrated the possibility of obtaining structure-within-structure morphologies (Figure 1-3).43-46 This results from the repulsion between the polar P4VP backbone and the nonpolar alkyl chain of PDP (and other similar molecules) that causes nanophase separation, leading to a liquid crystalline lamellar structure within the P4VP-based phase. Stamm and coworkers privileged HABA to achieve morphological transformations in different PS-P4VP diblock compositions and varying P4VP/HABA molar ratios, often combined with solvent annealing.47
Roland et al. investigated dip-coated films prepared from THF solutions of PS-P4VP with naphthol (NOH) or naphthoic acid (NCOOH), which differ only in their functional hydrogen-bonding substituent.39,48-49 They showed that film thickness varies in a V-shaped manner with dip-coating rate and that the small molecule uptake during dip-coating increases with dip-coating rate, starting from a low value, in the same way for both small molecules. For the system studied, where the solution composition of small molecule to 4VP repeat units was equimolar, the film morphology evolved from dots (spherical morphology) to stripes (cylindrical morphology, with cylinders parallel to the substrate) for NOH and from dots to stripes to face-down lamellae for NCOOH.
1.3. Langmuir-Blodgett and Langmuir-Schaefer techniques (ultrathin films)
1.3.1. Some historical aspects
An ancestor to the Langmuir trough and Langmuir-Blodgett technique was developed by Agnes Pockels in the 1890’s. She was the first to measure the surface Figure 1-3. Transition between lamellae and perpendicular cylinders structure in dip-coated film PS(252k)-P4VP(43k)/PDP occurred after 17 h of chloroform
vapour annealing at high pressure. T1 and T2 are different terraces of the film. Reprinted with permission from ref. 47. Copyright 2008 American Chemical
tension of monolayers on water in her own kitchen using household materials.50 Irving Langmuir improved on Pockel’s trough, and determined the main properties of organic monolayer films on liquids, published in 1917.51 In 1918 he began to collaborate with Katharine Blodgett, who soon realized that multilayer films can be easily fabricated by multiple dipping of a solid substrate into water covered by a monolayer of suitable organic molecules. In the first such experiment, a calcium stearate monolayer was transferred from the water surface to a glass substrate. A practical use for such films as an antireflective coating was later suggested.52 Since then, the Langmuir-Blodgett (LB) technique has received considerable attention for a wide range of scientific investigations involving surfaces, although large-scale practical applications are still limited.
1.3.2. Langmuir isotherms
The Langmuir isotherm is based on measuring the surface tension. Pure water has a very high surface tension, around 73 mN/m at 20°C, due to the multiple hydrogen-bonding interactions among H2O molecules. The introduction of
impurities reduces the surface tension, leading to a change in the surface free energy of water (air/water interface). The surface pressure (π) can be calculated from the difference between the surface tension of pure water (γ0) and the surface
tension after addition of a substance that adsorbs to the water surface (γ) (equation 2).53,54
π = γ0 - γ (2)
By measuring π during compression of the total surface area, one obtains the Langmuir compression isotherm. This isotherm provides qualitative and quantitative information about the self-assembly and the formation of a thin monolayer film on the surface. In different regions of the isotherm, the orientation of amphiphilic molecules at the air/water interface can be deduced.
Figure 1-4 shows a typical isotherm of the extensively studied phospholipid monolayer, obtained by measuring the surface pressure (π) of the interfacial film as a function of the mean molecular area (A) of the compound spread at the air/water interface. In a typical experiment, a very small amount of the amphiphilic substance is spread on the water surface, so that the molecules are far enough apart from each other that the interactions among them are essentially absent. This monolayer can be considered to be a two-dimensional gas because of the large average intermolecular distance. In this case, it does not have a significant effect on the free energy of the subphase and the surface pressure is very low (< 0.5 mN/m). During compression of the surface area, the molecules become closer to one another and phase transformations analogous to the phase transitions between the three-dimensional gaseous, liquid and solid states, can take place. Thus, the isotherm is the 2D equivalent of what is obtained when plotting the pressure vs volume (at constant temperature) of a material being compressed. In the first transition, from
A
Figure 1-4. Langmuir-Blodgett compression isotherm of a phospholipid showing
different phases: G – gaseous, L1 – liquid expanded, L2 – liquid condensed,
gas to liquid state, the hydrocarbon chains start to lift away from the air/water interface, and the liquid-expanded state is formed. In this state, the hydrocarbon chains are randomly oriented. At the liquid-expanded/liquid-condensed transition, condensed domains appear in the expanded phase. This LE/LC phase coexistence typically manifests itself as a region of constant or quasi-constant surface pressure, called isotherm plateau, and is a characteristic of a first order thermodynamic transition. The liquid-condensed phase can be followed by a transition to a solid phase of closely packed molecules. In this phase, the hydrocarbon chains are crystallized and uniformly oriented, and the monolayer presents a strong lateral cohesion. At still further compression, the monolayer will collapse into a three-dimensional structure and often disordered multilayers will be formed.55
1.3.3. Langmuir-Blodgett (LB) and Langmuir-Schaefer (LS) techniques To form a Langmuir film, it is necessary to have a water insoluble substance that is soluble in a volatile solvent. Such materials usually consist of two parts, a “head” and a “tail”. The “head” part is hydrophilic, with a strong dipole moment. The “tail” is hydrophobic and is typically composed of a long aliphatic chain, as in the fatty acids. Such molecules, having distinct hydrophobic and hydrophilic regions, are called amphiphiles. (Figure 1-5b).56 The following preparation steps are necessary: solubilizing the substance of interest in a volatile organic solvent (chloroform, toluene, hexane, etc.) that does not dissolve in or react with the subphase, uniformly spreading this solution onto the water surface of the Langmuir trough, allowing for evaporation of the solvent, and compressing the barriers
a) b)
The Langmuir-Blodgett trough that is used in this thesis is shown in Figure 1-5a. It consists of a Teflon container for the liquid (water) subphase, moveable barriers for compressing the surface area and devices for measuring the surface pressure and for transferring the monolayer to a solid substrate.57
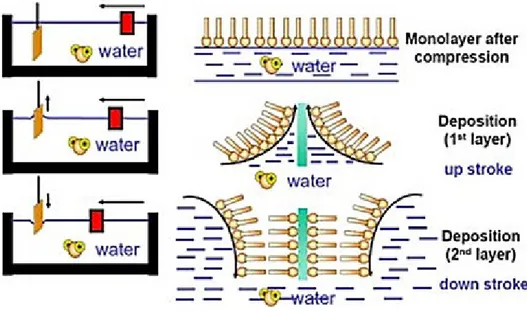
The term, “Langmuir–Blodgett film”, refers to a monolayer or a multilayer of an organic material that has been transferred from the water surface to a solid substrate such as mica, silicon, glass or quartz, by vertical deposition. In this case, the vertically oriented substrate is dipped and pulled through the monolayer at the air/water interface one or more times until the desired number of layers has been deposited (Figure 1-6).56
Figure 1-5. a) Langmuir trough (KSV 3000). b) The chemical structure of a typical LB compatible molecule with an aliphatic tail and a carboxylic acid head. Image b used with permission from ref. 58.
Usually, deposition is done at a constant surface pressure and at a constant transfer rate (1-5 mm/min). The film adsorbs to the substrate through hydrophilic/hydrophobic interactions and is characterised by the deposition (transfer) ratio.56 This transfer ratio is calculated from the decrease in the area occupied by the monolayer during the transfer divided by the coated area of the substrate. A transfer ratio close to or equal to one indicates a high-fidelity deposition and the orientation and organisation of the molecules on the substrate should be the same as on the water surface.58 A transfer ratio higher than one can occur if there is microscopic inhomogeneity at the substrate surface. A transfer ratio lower than 0.8 indicates poor homogeneity of the deposited film and a possible change in the molecular orientation during the deposition process.55
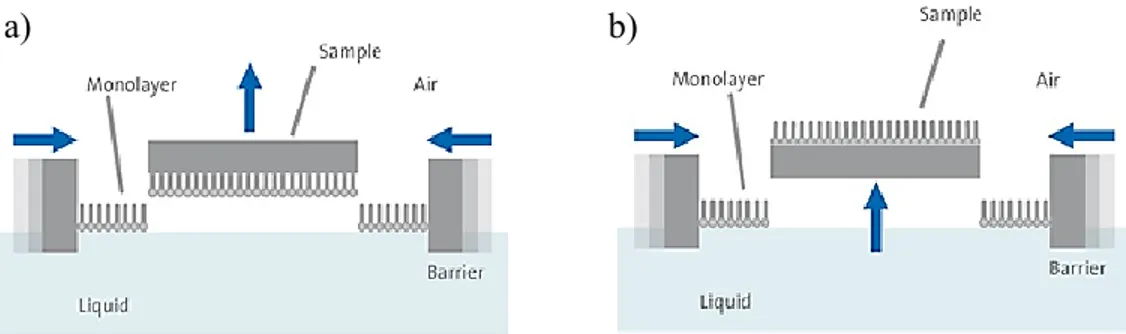
Another (less used) technique for depositing Langmuir films is the Langmuir-Schaefer method. In this case, as shown in Figure 1-7, the substrate touches the monolayer on the water surface horizontally and lifts it up from the top59 (Figure 1-7a) or, alternatively, it is submerged in the subphase and the monolayer is lifted up from the bottom (or the water level is lowered, which has the same effect) (Figure 1-7b).60 This technique minimizes the stress and deformation
Figure 1-6. Langmuir-Blodgett deposition of monolayers from the water
problems associated the Langmuir-Blodgett transfer, but calculation of a transfer ratio in this method is problematic.59
a) b)
1.4. Infrared spectroscopy
Infrared (IR) spectroscopy is a type of vibrational spectroscopy frequently used due to its ability to analyse samples in all states. The IR spectroscopy technique is based on the vibrations of atoms in a molecule. The main concept of this method is to pass infrared radiation through the sample and measure what portion of the incident radiation is absorbed at a specific energy, normally expressed in wavenumbers. The energy of the bands appearing in the absorption spectrum corresponds to the vibration frequency of specific molecular groups in the sample. Analysis of IR spectra can give information about the type of molecules present in a sample, their relative quantities, their molecular structure and their molecular environment.
The history of IR spectroscopy started in 1940 when the first IR spectrometers based on prisms as dispersive elements became available commercially. Later, diffraction gratings were incorporated as the dispersion mechanism. A leap forward was made with the development of Fourier transform spectrometers. The quality of spectra was significantly increased, along with a decreased time for obtaining the data.61
Figure 1-7. Two different types of Langmuir-Schaefer deposition. Used with permission from Biolin Scientific.
FTIR have many advantages compared to other types of infrared spectrometers. The first and main advantage is the possibility to measure IR spectra with a high signal-to-noise ratio (SNR), including for challenging samples such as Langmuir monolayers. The high SNR is possible due to the throughput advantage of FTIRs, which reflects the amount of light reaching the detector compared to the input light. Due to the specifics of the instrument (in particular the absence of entrance and exit slits that reduce throughput), a high-intensity IR beam reaches the detector and increases the signal level. The SNR improves as:
SNR ∝ t1/2 ∝ N1/2 (4)
where t is the observation time, which is characterized by the number of coadded scans N. It is obvious that increasing of the number of scans improves the SNR, which in turn leads to improving the spectrum quality in general. The second advantage of FTIR, the multiplex advantage, leads to an improvement of the SNR as in equation 5:
SNR ∝ n1/2 (5)
where n is the number of resolution elements in the spectrum.
Another advantage of FTIR is the wavenumber precision. FTIR allows the measurement of wavenumbers, and hence band positions, reproducibly, with a precision of better than ±0.01 cm-1.62 This will prove especially useful in our study of molecular interactions in LB films of PS-P4VP complexes with PDP.
The transmission method is historically the most frequently used sampling approach in FTIR due to the inexpensive sample preparation procedure, wide range of samples that can be analyzed and the good signal-to-noise ratio. It is based on the absorption of IR light at specific wavenumbers when it passes through the sample. This is the almost universal technique. It is, however, quite challenging to analyze ultrathin films by transmission FTIR due to the extremely short pathlength and,
thus, low absorbance of these samples.62 In that case, the multiple reflection ATR-IR technique can be used to improve the SNR of the spectra.
1.4.1. General principles of ATR-IR
ATR-IR is an infrared spectroscopy technique based on the principle of
attenuated total reflection (ATR). This technique has many advantages, such as an easy sample preparation (if any) and analysis, great sampling flexibility for analyzing a variety of samples (including ultrathin films), high surface sensitivity, and the possibility of qualitative and quantitative analysis of molecular composition, structure, and even 3D orientation.
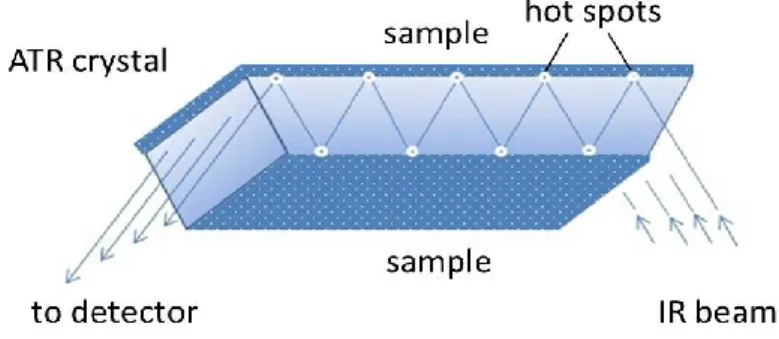
In general, ATR is a surface sensitive analytical technique based on the phenomenon of total internal reflection. The beam of infrared light passes through the ATR crystal and is totally reflected at the crystal/sample interface (Figure 1-8). However, the reflected beam forms an evanescent wave at the interface which penetrates inside the sample. The penetration depth (DP) is usually between 0.5 and 3 micrometers and is calculated by equation 6:
DP = 1/[2πWnc(sin2Φ-n2sc)1/2] (6)
where W is the wavenumber, nc is the refractive index of the ATR crystal, Φ is the angle of incidence, and nsc is the ratio of the refractive indices of the sample and ATR crystal. In the case of ultrathin films, the refractive index of the sample is usually replaced by the refractive index of air.
The number of ATR reflections depends on the angle of incidence of light and on the geometry of the crystal. If the user is interested only in qualitative analysis or in the quantitative analysis of thick samples, one reflection is usually enough. Single-bounce ATR accessories are now widely available and commonly used instead of transmission. Multiple reflections are often necessary in the case of quantitative analyses on ultra-thin films or diluted solution. This multiplies the sample absorbance by the number of reflections and thereby increases the
sensitivity of ATR detection. After one or more reflections, the light beam exits the crystal and travels to the detector (Figure 1-8).62
The refractive index of the ATR crystal must always be greater than the refractive index of the sample; otherwise the light can refract into the sample and lead to spectral distortions. Equation 6 shows that when the refractive index of the crystal increases, the penetration depth decreases. Thus, by changing the ATR crystal, the penetration depth can be changed easily and the spectra of a substance at different depths can be obtained. In the context of ultrathin films, it is advantageous to use a high refractive index crystal, such as silicon or germanium, to optimize the interaction of the IR electric field with the sample. Besides refractive index, other properties of the crystal, such as surface wettability, durability, toughness, useful wavenumber range and pH sensitivity, are important.62
1.4.2. Determination of orientation by ATR-IR
Polarized ATR-IR can be used for the determination of molecular orientation in a sample. Orientation provides the anisotropic macroscopic physical properties of materials. The accurate quantification and interpretation of molecular orientation give detailed information about the molecular structure of materials and can lead to improvements in technological processes.63
Figure 1-8. The principle of attenuated total reflection. The circles denote the "hot spots" where the evanescent wave interacts with the sample.
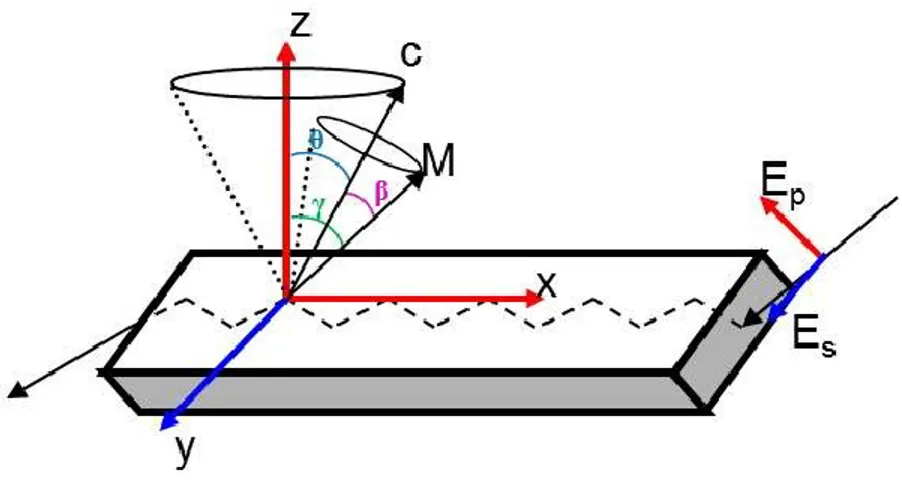
The orientation of molecular vectors, such as the molecular axis C or the transition dipole moment M, can be defined with respect to a Cartesian coordinate system (X, Y, Z) by defining the average angles between the vectors and the reference directions. Ultrathin films usually present a uniaxial orientation with respect to the normal of the substrate (Z axis) and thus an isotropic distribution of C and M in the plane (X, Y) of the film. It is therefore sufficient to discuss the orientation in the system as a cone distribution of M about the molecular axis C (with an average β angle), which is itself distributed around the reference direction Z with an average θ angle, as represented in Figure 1-9.
Figure 1-9. Schematic of the uniaxial orientation in an ultrathin film measured by polarized ATR. The molecular axis C is oriented uniaxially at an average angle θ with respect to the normal of the substrate, Z, while the transition dipole moment, M, is uniaxially oriented at an average angle β with respect to C. EP and ES represent the polarization of the electric field of the incoming IR light, and γ is the average angle between the dipole moment M and the reference direction Z.
The molecular orientation is expressed by the <P2> coefficient, the order parameter. At a <P2> value of 0, there is no molecular orientation with respect to Z and the sample is completely isotropic. For <P2> values between 0 and 1, there is orientation parallel to Z axis. Negative values between 0 and -0.5 indicate an orientation perpendicular to the Z axis.64
A molecular order parameter is usually calculated in three steps.65,66 The absorbance of the oriented sample strongly depends on the polarization of the incident radiation, the so-called linear dichroism, which can be measured by recording an IR spectrum using light that is polarized parallel and perpendicular to a reference direction. In the case of ATR, the reference direction is defined by the plane of incidence of the IR radiation in the ATR crystal. The degree of optical anisotropy is characterized by the dichroic ratio (R), which is the first step of calculation:
(7)
where 𝐴 and 𝐴 are the absorbance with parallel and perpendicular polarized radiation, respectively.67
When is known, it is possible to calculate the order parameter, , which defines the orientation of the transition dipole moment
M of the band of interest with respect to the normal of ATR crystal (Z axis). In contrast to the case of polarized transmission measurements, for which R can be directly converted into the order parameter, polarized ATR measurements require knowledge about the intensity of the electric field along the three main axes (X, Y and Z). The following equation can be applied:65
where are the mean square electric field (MSEF) amplitudes of the evanescent polarized radiation in the film. For LB films, these MSEF amplitudes can be reliably calculated using the Harrick approximation for ultrathin films:68 ( ) (9) (10) ( ) (11)
where n31 = n3/n1, n32 = n3/n2, is the incident angle, and 1, 2 and 3 refer to the
ATR crystal, the sample and the medium (air), respectively.
The last step is the calculation of the molecular order parameter Sm.
Assuming cylindrical symmetry of the transition dipole moments relative to the molecular axis C, Sm = <P2(cos θ)> can be calculated using the Legendre addition
theorem (equation 12):
(12)
where is the angle between the molecular axis C and the reference direction Z, and is the angle between the transition dipole moment and the molecular axis. Considering that the angle β is generally fixed, the orientation distribution of M around C is narrow and .
1.5. Previous investigations of morphology formation in LB diblock copolymer films
Self-assembly of amphiphilic diblock copolymers at the air/water interface and in LB films has been investigated by various groups.69-71 Generally, three main
types of morphologies are obtained, depending on the selective block length: a) planar-type aggregates (also called pancakes or islands), which are variable in size and appear at low hydrophilic block content; b) nanostrands (also called spaghetti, cylinders, worms, strands) of variable length and often interconnected leading to the formation of a nanostrand network,72,73 for somewhat higher hydrophilic block content; and c) dots (or nanodots) that are more uniform in size and have a tendency to assemble into an ordered two-dimensional array (usually hexagonal, but sometimes square74) at still higher hydrophilic block content (Figure 1-10).
Of the three morphologies, just a nanodot morphology shows a well-defined transition in the Langmuir isotherm. This is observed as a plateau, as shown in Figure 1-11 for the PS-P4VP(29.4%)/PDP system investigated in our group in recent years.74
Figure 1-10. Schematic image of the main morphology types in LB monolayers of amphiphilic diblock copolymers. Red features represent hydrophobic blocks, green features hydrophilic blocks. Reprinted with permission from ref. 73. Copyright 2013 American Chemical Society.
In accordance with surface pressure rules, such a plateau is indicative of a pressure-induced first-order phase transition.69 This transition had previously been interpreted as a “starfish → jellyfish” transition. In this case, the surface-adsorbed hydrophilic blocks (“starfish”) at low compression become submerged into the water (“jellyfish”) at the transition pressure.75 However, later investigations refuted this hypothesis, at least for PS-P4VP derivatives where the P4VP block is quaternized with variable-length alkyl chains, since no significant thickening of the Figure 1-11. (A) Langmuir compression isotherm of PS-P4VP(29%)/PDP at the air/water interface. (B) Model of order-order transition as a result of barrier compression. The image illustrates a Langmuir trough (arrows show direction of barrier compression) and the nanodot morphology below (top, with red arrows indicating dot movement upon compression) and above (bottom) the plateau pressure. (C-H) AFM height images (5 x 5 μm2) of Langmuir-Blodgett (LB, in C-H) and Langmuir-Schaefer (LS, in G) monolayer films transferred at the surface pressures (π) indicated. Corresponding 2D FFTs are given in the upper right corner for C-E and H. The direction of transfer (for C-F and H), coincident with the barrier compression direction (for C-H, including G), is along the Y-axis. Reprinted with permission from ref. 76. Copyright 2011 American Chemical Society.
ionic layer was observed at pressures above the transition by in situ X-ray and neutron reflectivity experiments.76 On the other hand, in situ FTIR showed an increase in the trans conformation of long alkyl chains with increased pressure, suggesting a disorder-order change of the alkyl side chains.76 However, the same transition is observed in diblock copolymers without alkyl chains, such as PS-PEO77 and PS-P4VP74. This indicates, that the transition must involve a more general mechanism than one based on alkyl chain changes.
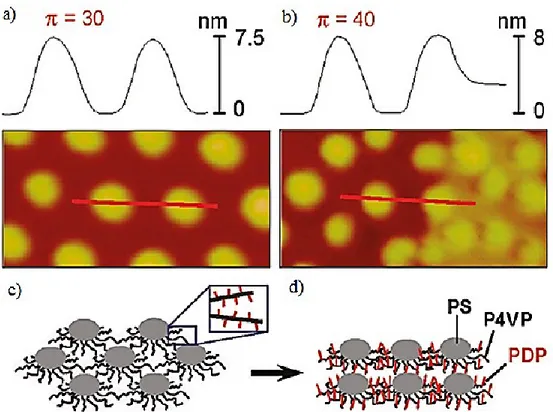
Our group recently found, using PS-P4VP(29.4%)/PDP that the morphological order of the nanodots changes at the transition, going from hexagonal-like order to square-like order at the plateau pressure (Figure 1-11). The structure of LB films of this PS-P4VP diblock copolymer complex with PDP has a different type of morphology for the parts of the LB isotherm below and above the plateau. The hexagonally ordered dot morphology observed at low surface pressure (before the plateau region, Figure 1-12, a) changes to square-like order at high surface pressure, with a mix of hexagonal and square-like order within or just above the plateau (Figure 1-12, b). The appearance of the square-like structure was thought to be the result of pushing the rows of dots toward each other under high surface pressure. The height of the dots remains approximately constant during the transition. The increase in background height by about 3 nm, indicated by the lighter colour of the background compared to the darker colour (Figure 1-12, b) was associated to a possible change of the orientation of PDP molecules. Considering that the length of the PDP molecule is 2.6 nm, the increase in the background height can be interpreted as a result of changing the orientation of PDP molecules from prone to almost perpendicular relative to the surface. The schematic model of such molecular reorientation is presented in Figure 1-12, c-d. However, this interpretation has not yet be proven, which might be possible to do by an infrared spectroscopic study.
Figure 1-12. Height profiles of AFM images (500 x 250 nm2) of LB films transferred at 30 and 40 mN/m respectively. (c-d) Model illustrating the changes that occur at the plateau transition: nanodot reorganisation accompanied by alkyl chain (red lines) reorientation from prone to vertical. Reprinted with permission from ref. 76. Copyright 2011 American Chemical Society.
1.6. Objectives and structure of the thesis
The current work is based on the recent discovery of the order-order morphological transition of amphiphilic diblock copolymers at the air/water interface, as summarized in the previous section.74 The project can be divided into
two parts. The first objective is to extend the previous studies involving PS-P4VP/PDP to related systems, particularly to PS-P4VP complexed with naphthol (NOH) and naphthoic acid (NCOOH), which were used by Roland et al. for dip-coated thin films.39 The second objective is to improve our understanding of molecular-level changes that must underlie or accompany the order-order transition occurring at the isotherm plateau pressure. This part of the study involves highly challenging ATR-IR investigations of monolayer films, and was accomplished with the close collaboration of Marie Richard-Lacroix.
The thesis is presented in 4 chapters:
Chapter 1 contains general information about the self-assembly of block copolymers and the formation of thin films by different methods. The main concepts of ATR-IR and its use for quantifying molecular orientation are also presented as well as the objectives of the thesis.
Chapter 2 presents the experimental procedures; i.e. sample preparation, the AFM method used to image the morphologies, details related to ATR-IR, etc.
Chapter 3 in the first part gives the results obtained for LB and LS films of PS-P4VP complexed with naphthol and naphthoic acid. In particular, the influence of solution concentration and surface pressure is investigated. The second part confirms the order-order transition in LB and LS films of P4VP and PS-P4VP/PDP using AFM and presents the results of ATR-IR analysis of the films. The latter required much time to find the appropriate conditions (cleanliness of water surface and substrate, determination of best substrate, substrate preparation,
type of IR technique, rapidity of measurement relative to sample preparation, etc.) for obtaining analyzable spectra.
Chapter 4 summarizes the main results and conclusions obtained from the thesis work and proposes ideas for future research.
CHAPTER 2
2.1. Materials
Two polystyrene-b-poly(4-vinyl pyridine) (PS-P4VP) block copolymers were obtained from Polymer Source (Montreal, Canada) and used as received:
PS-P4VP with Mn (PS) = 20,000 g/mol, Mn (P4VP) = 17,000 g/mol (192
S repeat units, 162 VP repeat units, 46 mol % P4VP content); referred to as PS-P4VP (46%)
PS-P4VP with Mn (PS) = 36,500 g/mol, Mn (P4VP) = 16,000 g/mol (350
S repeat units, 152 VP repeat units, 30.3 mol % P4VP content) ; referred to as PS-P4VP (30.3%)
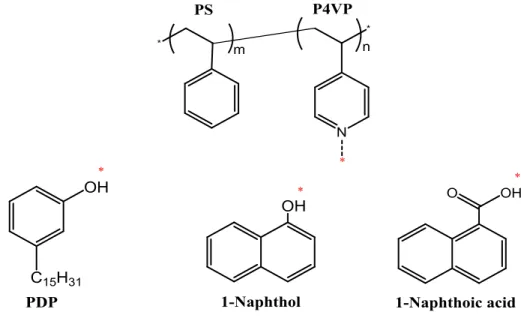
The small molecules used were 1-naphthol (NOH) (Sigma-Aldrich, 99%; used as received), 1-naphthoic acid (NCOOH) (Fluka, 97%; used as received), 3-n-pentadecylphenol (PDP) (Sigma-Aldrich, 90%; recrystallized twice from hexane before use). The molecular structure of PS-P4VP and the small molecules used are presented in Figure 2-1.
Chloroform (Sigma-Aldrich, HPLC grade, ≥99.8% or EMD Millipore, HPLC grade, ≥99.8%) was used as the solvent for solution preparation, cleaning of
Figure 2-1. Molecular structure of PS-P4VP and the small molecules used. The red stars indicate the hydrogen-bonding sites.
the ATR crystal and, together with anhydrous ethanol (Commercial Alcohols), in all Langmuir-Blodgett trough cleaning processes. Ultrapure water (18.2 MΩ.cm), obtained by the purification of distilled water with a Milli-Q Gradient system, was used as the subphase in the Langmuir-Blodgett trough. Muscovite ruby mica (Hi-Grade Mica, (Hi-Grade V2, Ted Pella Inc., Redding, USA), silicon wafers (University Wafer, type P, Boston, USA), and Si and Ge crystals (parallelepiped-shaped with truncated 45º side edges, 52 x 20 x 2 mm, surface quality 40/42 scr/dig for Si and 60/40 for Ge, Tydex, St. Petersburg, Russia) were used as solid substrates for LB and LS depositions and further analysis.
The substrates were cleaned as follows. Mica was cleaved immediately before use. The silicon wafers were cleaned by a Piranha solution (3:1 v/v mixture of concentrated H2SO4 and 30% H2O2). The Ge and Si ATR crystals were cleaned
with HPLC chloroform and anhydrous ethanol followed by oxygen plasma cleaning (5 min, Plasma Cleaner/Sterilizer PDC-32G, Harrick Plasma, NY, USA) before deposition.
Mica substrates and, to a lesser extent, silicon wafers, are typically used for LB and LS deposition and subsequent AFM investigation of ultrathin film morphology. Thus, the first ATR experiments were done on silicon wafer substrates (mica substrates are not suitable because of their strong absorption throughout the IR region) immediately after sample deposition; but, due to the very small thickness of the film, the signal was too weak for quantitative analysis. It was then proposed to transfer samples directly on 24-reflection Ge crystals, freshly cleaned with HPLC chloroform and anhydrous ethanol before deposition, in the hope of increasing the signal intensity. However, a problem of low transfer ratios onto the Ge substrates was found. The cleaning procedure was modified to include an oxygen plasma cleaning step to make the surface of the ATR crystal more hydrophilic (water contact angle of 0º), but the results were still poorly reproducible. We believe that the reason for the low transfer ratio is poor affinity between the Ge substrate and the sample. Finally, it was found that use of a 24-reflection Si ATR crystal for the LB transfers led to good results. A high transfer ratio was obtained for these Si crystal substrates, which were cleaned by the same procedure as for Ge crystals
(except for pure PS-P4VP at higher surface pressures). Qualitative and quantitative information was extracted from the spectral range above 1500 cm-1,since silicon dioxide absorption becomes problematic at lower wavenumbers.
2.2. Methods
2.2.1. Solution and sample preparation. Langmuir-Blodgett and Langmuir-Schaefer films
To prepare the solutions used for spreading at the air/water interface, PS-P4VP was dissolved in CHCl3 and then an appropriate amount of the desired small
molecule (SM) was added (1.0:1.0 VP:SM molar ratio). The solution was left to stir overnight at room temperature in a sealed volumetric flask. The final solution concentration of PS-P4VP varied between 0.1 and 5 mg/mL.
A computer-controlled Langmuir-Blodgett system (KSV 3000, KSV Instruments, Helsinki, Finland) with a platinum Wilhelmy plate sensing device was used. The trough was cleaned with CHCl3 and ethanol and then it was filled with
MilliQ water. The temperature of the subphase in the trough was maintained at 20-21ºC using a refrigerated circulator (Isotemp 3016, Fisher Scientific). Before each experiment, a blank compression was performed to verify the cleanliness of the water surface. The solution was spread on the water surface with the barriers completely open using a Hamilton microliter syringe of the desired volume (20-100 μL for concentrated solutions, 40-400 μL for dilute solutions) in staggered rows. It is very important to follow the same way of spreading for each experiment and to deposit at least one drop at 3-4 cm from the immersed substrate for optimal reproducibility. After spreading, the solvent (CHCl3) was left to evaporate for 30
min. To obtain Langmuir isotherms of the surface pressure (π) as a function of the mean molecular area (A), the barriers were compressed symmetrically at a constant rate of 10 mm/min (15 cm2/min). Each isotherm was repeated at least twice, often three times. To deposit monolayers using the LB technique, the barriers were compressed to the desired surface pressure and then held in place for 20-30 min to allow barrier position and surface pressure stabilization. The monolayer was then
transferred vertically by raising at a fixed withdrawal rate (5 mm/min) a solid substrate that had been submerged in the subphase prior to spreading the polymer solution. The transfer ratio of the deposited films was generally 1.0 ± 0.2. Langmuir-Schaefer (LS) films were transferred horizontally onto a solid substrate (mica or silicon wafer) that was fixed on the LS holder placed underneath the water surface in the center of the trough, parallel to the moving barriers. The surface film was lowered onto the substrate by removing the subphase water using a water pump at the desired surface pressure.78 The sharp borders of the LS holder allowed keeping the surface pressure constant to preserve the initial morphology during the transfer.
2.2.2. Atomic force microscopy imaging
After deposition, films were dried in a clean box in the fume hood at room temperature and then scanned by atomic force microscopy (AFM) in tapping mode. A multimode AFM with a Nanoscope V controller (Digital Instruments/Veeco, Santa-Barbara, USA) was used with silicon tips (Bruker USA: model TESPA, rectangular, no aluminum coating on tip and reflective aluminum coating on backside, spring constant 42 N/m, resonance frequency 320 kHz, tip curvature radius 5 nm; or Nanoworld Innovative Technologies, Arrows NCR model, spring constant 42 N/m, oscillation frequency 285 kHz, tip radius less than 10 nm). All images were obtained at a scan rate 0.999 Hz, and a resolution of 512 x 512 pixels. At least 10 different places were scanned for each sample.
Quantitative information was obtained by image analysis using Nanoscope R (III), version 5.12r2 software. Feature heights in topographic images were measured from the top of the dots relative to the flat area between the dots. Dot widths were measured at the half-height of the dot. The average center-to-center distance between the dots was determined by fast Fourier transform (FFT) analysis when possible; otherwise, they were determined by AFM height profiles.
2.2.3. ATR-IR spectroscopy of ultrathin films
Samples were transferred at different surface pressures on a 24 reflections silicon ATR crystal (50 x 20 x 2 mm parallelogram with a 45° face angle). Spectra were recorded by averaging 512 scans with a 4 cm-1 resolution on a Tensor 27
FT-IR spectrometer (Bruker Optics) equipped with a liquid nitrogen cooled HgCdTe detector and a vertical ATR accessory. The IR beam was successively polarized parallel (p) and perpendicular (s) with respect to the incident plane with a KRS-5 holographic polarizer (Optometrics). Single beam polarized spectra were first measured on the sample, then the crystal was carefully rinsed several times with HPLC grade chloroform while carefully kept in the sample holder (to avoid spectral distortions due to a change in position between sample and background measurements). The polarized background single beam spectra were finally recorded and used to calculate the sample absorbance spectra.
CHAPTER 3
3.1. PS-P4VP/naphthol and PS-P4VP/naphthoic acid systems and effect of spreading solution concentration
The interest of investigating the PS-P4VP(46%)/naphthol (NOH) and naphthoic acid (NCOOH) systems arises from the PhD work of S. Roland, who studied these systems in the form of thin films deposited by the dip-coating method.39,48,49 The presence of these two small molecules in the dip-coating solution using THF as solvent led to two different morphology evolutions as a function of dip-coating rate, which was also different from that for PS-P4VP solutions without any small molecule. Using CHCl3 as solvent, a lamellar
morphology was obtained for both systems.39 In this chapter, we study if the presence of NOH or NCOOH has an influence on ultrathin films of a PS-P4VP copolymer with nearly equal PS and P4VP content, deposited by the LB and LS methods. We check the influence of different solution concentrations on the Langmuir isotherms and on the morphology of the transferred films, and compare this with the films obtained for the small molecule-free block copolymer.
3.1.1. Langmuir compression isotherms
Figure 3-1 shows Langmuir isotherms of PS-P4VP (46%) both alone and mixed with NOH and NCOOH (equimolar to VP), all spread from CHCl3 solutions
of different concentrations. The first observation is that the isotherms have a similar shape for all systems. For a given system, the isotherms are coincident for all solution concentrations below the plateau region. However, the plateau appears well-defined only at low solution concentrations: at 0.1, 0.5 and 1.0 mg/mL for PS-P4VP and PS-PS-P4VP/NCOOH and at 0.1 and 0.5 mg/mL for PS-PS-P4VP/NOH.