Les Cahiers de la Chaire Economie du Climat
Carbon prices and CCS investment: comparative study
between the European Union and China
Marie Renner
1As policy makers assess strategies to reduce greenhouse gas emissions (GHG), they need to know the available technical options and the conditions under which these options become economically attractive. Carbon Capture and Storage (CCS) techniques are widely considered as a key option for climate change mitigation. But integrating CCS techniques in a commercial scale power plant adds significant costs to the capital expenditure at the start of the project and to the operating expenditure throughout its lifetime. Its additional costs can be offset by a sufficient CO2 price but most markets have failed to put a high enough price on CO2 emissions: currently, the weak Emission Unit Allowances price threatens CCS demonstration and deployment in the European Union (EU). A different dynamic is rising in China: a carbon regulation seems to appear and CCS techniques seem to encounter a rising interest as suggest their inclusion in the 12th Five-Year Plan and the rising number of CCS projects identifies/planned. However, there are very few in-depth techno-economic studies on CCS costs. This study investigates two related questions: how much is the extra-cost of a CCS plant in the EU in comparison with China? And then, what is the CO2 price beyond which CCS power plants become more profitable/economically attractive than classic power plants, in the EU and in China? To answer these questions, I first review, analyze and compare public studies on CCS techniques in order to draw an objective techno-economic panorama in the EU and China. Then, I develop a net present value (NPV) model for coal and gas plants, with and without CCS, in order to assess the CO2 price beyond which CCS plants become the most profitable power plant type. This CO2 value is called CO2 switching price. I also run some sensitivity analyses to assess the impact of different parameter variations on this CO2 switching price. I show that CCS power plants become the most profitable baseload power plant type with a CO2 price higher than 70 €/t in the EU against 30 €/t in China, without transport and storage costs. When the CO2 price is high enough, CCS gas plants are the most profitable power plant type in the EU whereas these are CCS coal plants in China. Through this study, I advise investors on the optimal power plant type choice depending on the CO2 market price, and suggest an optimal timing for CCS investment in the EU and China.
n° 2014-02
Working Paper Series
1. University Paris Ouest Nanterre La Défense and Climate Economics Chair marie.renner@chaireeconomieduclimat.org
1
CARBON PRICES AND CCS INVESTMENT: COMPARATIVE STUDY BETWEEN THE EUROPEAN UNION AND CHINA
Abstract
As policy makers assess strategies to reduce greenhouse gas emissions (GHG), they need to know the available technical options and the conditions under which these options become economically attractive. Carbon Capture and Storage (CCS) techniques are widely considered as a key option for climate change mitigation. But integrating CCS techniques in a commercial scale power plant adds significant costs to the capital expenditure at the start of the project and to the operating expenditure throughout its lifetime. Its additional costs can be offset by a sufficient CO2 price but most markets have failed to put a high enough price on CO2 emissions: currently, the weak Emission Unit Allowances price threatens CCS demonstration and deployment in the European Union (EU). A different dynamic is rising in China: a carbon regulation is setting up and CCS techniques seem to encounter a rising interest as suggest their inclusion in the 12th Five-Year Plan and the rising number of CCS projects identifies/planned. However, there are very few in-depth techno-economic studies on CCS costs. This study investigates two related questions: how much is the extra-cost of a CCS plant in the EU in comparison with China? And then, what is the CO2 price beyond which CCS power plants become more profitable/economically attractive than classic power plants, in the EU and in China? To answer these questions, I first review, analyze and compare public studies on CCS techniques in order to draw an objective techno-economic panorama in the EU and China. Then, I develop a net present value (NPV) model for coal and gas plants, with and without CCS, in order to assess the CO2 price beyond which CCS plants become the most profitable power plant type. This CO2 value is called CO2 switching price. I also run some sensitivity analyses to assess the impact of different parameter variations on this CO2 switching price. I show that CCS power plants become the most profitable baseload power plant type with a CO2 price higher than 115 €/t in the EU (offshore transport and storage costs) against 33 €/t (onshore transport and storage costs) or 47 €/t (offshore transport and storage costs) in China. When the CO2 price is high enough, CCS gas plants are the most profitable power plant type in the EU whereas these are CCS coal plants in China. Through this study, I advise investors on the optimal power plant type choice depending on the CO2 market price, and suggest an optimal timing for CCS investment in the EU and China.
Introduction
To reduce anthropogenic greenhouse gas (GHG) emissions responsible for climate change and limit long-term global temperature increase to 2°C (COP 15), the four main technical options to be combined are: (1) a massive development of clean energies (renewable and nuclear), (2) the reduction of fossil fuel consumption by switching to lower-carbon alternatives (E.g.: coal to gas), (3) efficiency of energy demand and of technologies used to convert fossil fuels into energy, particularly in power generation and (4) carbon capture and storage techniques (CCS) (BERNSTEIN L. et al., 2006). CCS is a suite of techniques designed to capture the CO2 contained in industrial flue gases from large point sources (fossil fuel plants, blast furnaces, cement manufacturing…) before it is emitted to the atmosphere, to transport it (E.g. pipelines) and then to inject it into a suitable storage facility(E.g. depleted oil and gas fields and deep saline aquifers).
International organizations like the European Commission (Roadmap 2050, 2011), the IPCC (2005, 2007), the IEA (2010, 2012, 2013)1, the ZEP (2011)2… present CCS as the only current mitigation
1
2 technology that would allow industrial sectors (such as iron and steel, cement and fossil fueled power plant) to meet deep emission reduction targets. Thus, energy scenarios with ambitious climatic goals use CCS techniques. In its3 analysis (IEA, 2013), the IEA develops a 2DS scenario in which CCS technologies play an important part in the energy system that allows to meet the 2°C goal: CCS could account for up to 20% of the total emission reductions globally through 2050. About half of the total volume of the captured carbon comes from the industry and the other half from the power sector.
CCS techniques applied to the power sector offer a significant potential to reduce GHG emissions: in 2009, power generation contributed to 40% of total CO2 atmospheric emissions (IEA, 2012a). Around two thirds of the world’s electricity was generated from fossil fuels, with 40% from coal, 21% from natural gas and 5% from oil, and the use of coal and gas to generate electricity is still rising (IEA, 2012a). Therefore this paper focuses on the power sector.
Abandoning CCS as a mitigation option would increase the investment requested in the power sector by 40%, which means an extra cost of USD 2 trillion over 40 years (BEST D. et al., 2012). Even if CCS techniques remain capital intensive and costly, they can be “competitive on a levelised cost of electricity (LCoE) basis with solar, wind (...)” (IEA, 2012c). Indeed, one might tend to focus on the high extra-costs of CCS power plants without replacing them in the merit order of low carbon energies. Moreover, CCS power plants present a significant advantage upon renewable energies: the electricity can be supplied on demand and do not suffer intermittency.
Therefore, while their energy demand is still growing and their energy mix fossil fuel dependent, the European Union and China consider CCS as an important technology to reduce CO2 emissions from power plants (GRIMSTON et al., 2001).
In the late 2000s, the EU viewed CCS techniques as able to play a critical role in meeting its climate targets, well known as the "20-20-20" in the climate and energy package framework (2009)4. Thus the EU has committed to support CCS, from a financial and regulatory point of view. Following the European Council's decision (2007) to support up to 12 large-scale demonstration projects by 2015, the Commission took several regulatory measures. Among them, the CCS Directive that was adopted to provide a legal and common framework for CO2 capture, transport and storage, with a transposition deadline set at June 2011. CO2 transport pipelines were included in the Europe's Energy Infrastructure Priorities (EIP) (2010) and in the Regulation on "Guidelines for Trans-European Energy Infrastructure" (2013). To establish a demonstration support framework, CCS has become an integral part of the EU R&D program, in the frame of the European Industrial Initiative (EII) on CCS that is part of the Strategic Energy Technology (SET) Plan. Two funding instruments have also been created: the European Energy Program for Recovery (EEPR)5 and the NER6300; in 2008, the EU agreed to set aside 300 million Emission Unit Allowances (EUA) from the NER under the European Union-Emission Trading System (EU-ETS) Directive. This financing instrument is dedicated to subsidy installations of innovative renewable energy technology and CCS. However, the current weak EUA price slows down CCS demonstration and deployment7. The
2
Zero Emission Platform. Founded in 2005, the European Technology Platform for Zero Emission Fossil Fuel Power Plants is a coalition of stakeholders united in their support for CCS as a key technology for combating climate change. ZEP serves as advisor to the European Commission on the research, demonstration and deployment of CCS. 300 experts from 19 countries and around 40 companies and organizations contribute to ZEP’s activities.
3
Energy Technology Perspectives. 4
A 20% reduction in GHG emissions from 1990 levels, raising the share of EU energy consumption produced from renewable resources to 20%, a 20% improvement in the EU's energy efficiency.
5
http://www.developpement-durable.gouv.fr/IMG/pdf/26-_captage_et_le_stockage_du_CO2.pdf 6
New Entrance Reserve (NER). 7
No CCS projects were selected in the first call for proposals of NER300; one project has been submitted in the second call, for which Awards are envisaged by mid-2014.
3 lack of large scale pilots threatens CCS deployment in Europe. As a result, as other countries like China currently invest in CCS, the European Union could lose its leadership8 in the CCS field.
If a CCS cooling has been observed in the EU over the past few months, CCS seems to have received a fresh boost in China. Indeed, China has recently shown the willingness to reduce its GHG emissions with the goal to reduce its carbon intensity by 40% to 45% from 2005 levels by 2020 (WU N. et al., 2013). But coal share in the Chinese power mix was 78% in 2010 and will remain dominant in 2020 with 60% (IEA, 2012a). Thus, CCS has a high potential market in China. The inclusion of CCS in China’s 12th Five-Year Plan reflects a strong commitment in CCS development and deployment. China has now 11 Large Scale Integrated Projects (LSIPs) planning (9 in the evaluate stage, 2 in the identify stage) compared to five in 2010, ranking second to the United States (19) in terms of the LSPI numbers (GCCSI, 2013). However, note that American LSPIs are in more advanced stages (7 evaluate, 8 define, 4 execute, 2 operate). Moreover, Chinese investment and Operation and Maintenance (O&M) costs are lower than in OECD countries. So CCS plants could be profitable at a lower over cost than in the EU. Besides, a Chinese carbon regulation could happen in the next few years; different designs of carbon market are currently tested in five Chinese cities9.
And the carbon price plays a key role in CCS profitability and thus its deployment (GIOVANNI E. et al., 2010). Indeed, if there is a carbon regulation, decision makers for power plants would face this choice: either they invest in a CCS power plant to reduce their CO2 emissions and then their carbon burden, or they decide not to install CCS and pay for every ton of CO2 emitted by the power plant. The higher the CO2 price, the higher the interest of CCS investment. But this implies the existence of a CO2 cost pass through to electricity prices. It exists in Europe (SIJM J. et al., 2006 and JOUVET P.-A. et al., 2013) but is currently impossible in China because of regulated electricity prices. Nonetheless, reforms are currently undergone to partly deregulate gas prices (IEA, 2012b); thus an electricity reform is perfectly conceivable.
This context reveals a degree of political voluntarism on part of China, but the question is: will it be turned into a wide CCS deployment in the next few years?
The European Parliament has recently adopted the back-loading proposal, which could be seen as the first step to further structural measures to revitalize the EU-ETS. In the United States, at Barack Obama’s request (Climate Action Plan), the Environmental Protection Agency (EPA) released in September 2013 its proposed Clean Air Act standards to significantly reduce CO2 emissions from new coal power plants (CCS will be required): a carbon binding regulation could be implemented in the near future. These recent measures show that policy makers and investors should keep in mind the idea of a possible future carbon regulation/legislation when they make their investment decisions.
Power plant costs strongly differ from China to the EU. Therefore, one can expect that CCS costs vary a lot between China and the EU. Two questions arise: how much is the extra-cost of a CCS plant in the EU in comparison with China? And then, what is the CO2 price beyond which CCS power plants become more profitable than power plants without CCS, in the EU and in China?
To answer these two questions, I carry out a literature review on public studies about techno-economic CCS costs in the EU and China. CCS cost studies necessarily employ a large set of technical and economic assumptions that can dramatically affect results (RUBIN E. et al., 2007). This paper summarizes the results of the most recent public studies of current CCS costs for fossil fueled power plants and gives an updated and objective comparison of coal and gas power plants with and without CCS, covering a range of assumptions for key parameters. To assess objectively the profitability of a CCS power plant,
8
Alstom, for instance, has namely been involved in these pilots: Lacq (France), Le Havre (France), the Technology Center Mongstad (TCM) (Norway) which is the world’s largest facility for testing CO2 capture, or the White Rose project (United Kingdom (UK)).
9
4 two key metrics are calculated: the Levelised Cost of Electricity (LCoE) and the CO2 switching price (the CO2 price beyond which a CCS power plant becomes more profitable than another power plant type). In other words, I build a net present value model that take into account the CO2 price in order to calculate the breakeven CO2 price. If techno-economic studies on CO2 capture from power generation are numerous in OECD countries, particularly in EU, they are scarce in China (WU N. et al., 2013). But they have in common the fact that very few of them assess the CO2 switching price. My study fills these gaps by providing an objective CCS cost comparison in the EU and in China, and by giving implications for European and Chinese power plant investors/policy makers.
Section 1 gives the state of art about CCS techniques in the power sector, then, section 2 describes the methodology used to draw an economic panorama of CCS power plants, and section 3 presents the main results. In section 4, sensitivity analysis are run, and in section 5, CCS costs by 2030 are assessed to advise investors on the optimal power plant type choice depending on the CO2 market price, and suggest an optimal timing for CCS investment in the EU and China.
1. State of art: CCS and electricity generation
1.1.CCS techniques readiness
As their name suggests, CCS techniques are a 3 links chain: carbon capture, carbon transport and carbon geological storage.
The CO2 capture is already performed as part of the standard process in some industries: natural gas processing, chemical production, coal gasification, coal to liquid, synthetic natural gas, fertilizer production, hydrogen production and ethanol production. However, capturing CO2 emissions from fossil fuel power plants, blast furnaces or cement kilns has not been deployed yet because their flue gases have low carbon content. Flue gases are a mixture of CO2 but also oxygen, water vapor, or nitrogen. Thus, depending on the industry concerned, the carbon content varies from a few percentage points to nearly 20%. For instance, the CO2 content is around 10-12% for coal plants and only 3-5% for gas plants. The effort required for CO2 capture is proportional to the purity of the gas stream: CO2 capture is easier and less expensive when flue gases are CO2 rich. Thus, to reduce their CO2 emissions, utilities, cement and steel manufacturers have to develop specific techniques to capture CO2 and move them to demonstration scale. In 2013, the Global CCS Institute has identified 65 LSIPs around the world; only 12 of which are in operation. The 7 000 industrial sites10 that could be equipped with CCS (GIEC, 2005) are far away.
Currently, three main processes are being developed to capture CO2: - Pre-combustion carbon capture
The carbon contained in the fossil fuel is removed before the combustion process. The problem is tackled at its root.
It’s the most complex carbon capture process. The feedstock (coal for instance) is turned into a synthesis gas (mixture of hydrogen H2 and carbon monoxide CO). Then, the syngas undergoes the water-gas shift reaction to produce a H2 and CO2-rich gas mixture. The CO2 concentration can range from 15-50%. The CO2 is separated from H2 in a similar way as in post-combustion process11. H2 can be used directly (in refineries namely) or as a fuel in combined-cycle gas plant (electricity or heat without CO2) or to produce synthetic fluids.
10
CO2 emissions higher than 100 000 t/year. 11
In the post-combustion process, the flue gas stream is at low pressure and with a low CO2 content (5-15%). In the pre-combustion process, the shifted synthesis gas stream is rich in CO2 and at higher pressure; so the CO2 removal is easier.
5 Pre-combustion capture technology is only applicable to new fossil fuel power plants (Integrated Coal Gasification Combined cycle or IGCC) because the capture process requires significant modifications of the power plant.
- Oxy-combustion carbon capture
In traditional fossil fuelled power plants, combustion is carried out by using air; the flue gas has a low CO2 content so it is costly to separate it. In the oxyfuel process, the combustion is preformed with enriched or high purity oxygen streams; as a result, the flue gas contains only steam and CO2 with a high concentration (greater than 90% by volume). These two components are then easily separated through cooling; the water condenses and a CO2 rich gas-stream is formed. Oxy-combustion is sometimes presented as the most promising carbon capture process; innovations are expected to reduce the cost of pure oxygen production (chemical looping). - Post-combustion carbon capture
The process consists in separating and removing the CO2 diluted in the flue gas produced by the combustion of a fossil fuel. Several options are available. The most common process is absorption which is based on a chemical reaction between CO2 and a suitable chemical, also called an absorbent. The absorbed CO2 is separated from the absorbent through a thermal regeneration process. Typical absorbents that are used today are amines and carbonates. Cryogenic separation, calcium looping and adsorption are the three other processes.
Positioned downstream, the post combustion capture process can be added to existing coal or gas power plants, blast furnaces, cemeteries... or factories that emit large CO2 amounts.
Post-combustion carbon capture is the most mature and widely used process.
Within each of these three main capture categories, there are several pathways using different technologies which may find particular application more favorably in certain climate conditions, locations and fuel types. In 2013, none of those capture processes were used at an industrial scale in the power/cement/steel sector, but in 2014, two large scale projects should be complete: Boundary Dam 3 (Estevan, Canada), the world’s first commercial scale post-combustion carbon capture project at a coal fired generating station, and Kemper County (Mississippi), the only IGCC with CCS under construction worldwide.
As for carbon transport and storage, if the American Enhanced Oil recovery (EOR) experience12 can provide some information, two main techno-economical uncertainties need to be removed: i) the safety and reliability of geological CO2 storage in deep saline aquifers need to be demonstrated, ii) the availability of technologically accessible and economically feasible viable storage sites.
Thus large scale integrated projects (LSIPs) are required to remove uncertainties and get more precise capital and operating expenditures (cost and contingencies) for the three links.
1.2.Uncertainty on CCS costs
As said before, CCS applied to fossil fuel power plants is an emerging technology. Consequently cost data come from CCS pilot and LSIPs (only 12 around the world (GCCSI, 2013)) in operation, and from engineering and feasibility studies. These cost data correspond to First-of-a-Kind (FOAK)13 Projects that is to say projects with technologies at early stage of development. From these cost data, up-scaling deduce full scale plant costs taking into account learning effects and economies of scale as well as a different level of contingencies depending on the number of equipments/similar plant type already built. This enables to compute NOAK (Nth of a Kind CCS plants)14 costs.
12
6200 km pipelines currently handle about 50 Mt of CO2, in a supercritical state, per year (IEA ETSAP, 2010). 4 storage sites (>1MtCO2 per year) are currently in operation around the world.
13
The technology is at an early stage of development/deployment. 14
6 Thus, economic data for CCS plant remain uncertain. Besides, the literature overview has raised two questions: (1) are studies influenced by the national energy context? (2) how much independent are public studies about CCS costs? Indeed, for the first question, by comparing public studies two discernable trends appear: American studies (WorleyParsons, 2009, 2011 and NETL, 2010a, 2010b) tend to favor gas plants relatively to coal plants and on the contrary, the European study (ZEP, 2011) tends to favor coal plants relatively to gas plants. Are the American studies influenced by the national energy context, the dash for gas linked with the shale gas exploration and development? This might be a bias. Note that like the DECC, the IEA, sometimes criticized for its too optimistic scenarios, has a median position. The second issue, about public studies independence, is raised by two factors: for most studies, cost data sources are kept secret or lack transparency, and a rather high cost data homogeneity is observed after the standardization of several techno-economic parameters and calculation methodologies (for more details, see 3.3.). One can wonder whether these cost data are rather similar because studies refer to one another and eventually use the same data. The cross analysis of bibliographies shows that most studies refer to others (table 1). Consequently, it is pretty hard to conclude about the independency of these public studies.
Quotes Is quoted by
EPRI GCCSI IEA Worley Parsons
DoE-
NETL ZEP Alstom NZEC
WU N.et al. DECC EPRI X X X X X GCCSI X IEA X X X X X X WorleyP. X X X DoE X X X X X ZEP X X X Alstom X X NZEC X X WU N.al. DECC IPCC X X X Rubin X X X X X X X X IEA-GHG X X X
Table 1: Cross analysis of studies’ bibliographies
2. Methodology and data
In order to assess more precisely the potential of CCS as a key option for climate change mitigation, this study aims at reviewing, analyzing and comparing public studies in the purpose of drawing an objective techno-economic panorama of CCS applied to the power sector in the EU and in China. It implies: (1) studying the profitability of CCS plants respect to power plants without CCS (marginal economic analysis), (2) assessing the costs and performance of carbon capture techniques - pre-combustion, oxy-pre-combustion, post-combustion - to indicate which one is the most profitable, (3) determining the CO2 price beyond which CCS power plants become more profitable than non-CCS power plants also called reference coal plants.
To perform this comparative analysis of CCS costs and assess the profitability of these techniques the following methodology is employed:
7 - Literature review to select the most recent and relevant individual techno-economic studies15. - Calibration of economic data (discount rate, currency, fuel cost…) and calculation methodologies
(capital cost…) for the selected studies.
- Standardized calculation of two key metrics: the LCoE and the CO2 switching price (see below). - Data analysis and result discussions.
- Conclusions and recommendations.
2.1.Two key metrics to assess CCS power plant profitability
CCS techniques will be deployed if and only if they are a profitable option for industrials/investors. CCS power plant profitability is directly linked to CCS extra-costs. These are of two kinds:
- Fixed: at the start of the project16,
- Variable: during the operation time17, because of:
Net efficiency penalties (from 8 to 10 points) which means higher fuel consumption.
Higher operating and maintenance expenditure.
The extra-costs induced by CCS devices are assessed through the two following key metrics: - The Levelised Cost of Electricity (LCoE).
The LCoE is equal to the minimum selling price of electricity for which the power plant becomes profitable (the NPV is null). It is a uniform annual value giving the same net present value as the year-by-year case. The LCoE is expressed in €/MWh and is equal to the present value of the sum of discounted costs divided by total production adjusted for its economic time value18.
- The CO2 switching price19.
When the CO2 price is not null, power plants without CCS are significantly charged for their CO2 emissions on the contrary to CCS power plants. So there exists a CO2 price that equals the LCoE of CCS and non-CCS power plants. In other words, there exists a CO2 price beyond which CCS power plants become more profitable than the same plants without CCS20 (Figure 1). It also can be seen as the CO2 price for which the NPV of the differential project (NPV CCS - NPV ref) is null.
=
Figure 1: The CO2 switching price concept 15
Public studies.
16
One can also speak about CAPEX (CAPital EXpenditure). 17
One can also speak about OPEX (OPerating EXpenditure). 18
With my simplifying assumptions (costs constant with time), the LCoE is: &
.
19
!"#ℎ!%& '(!#) = .+, +/0, + 1, - & . -20,-, & + -3 -, +. 20
Also called reference plants.
Full cost of the CCS power plant CO2 cost Full cost of the reference power plant Cost with CCS CO2 Cost Cost with CCS
8 It can be noticed that there is still a CO2 cost box for the CCS power plant. Indeed, the carbon capture rate is 90% not 100%.
These two key metrics will allow us to establish a merit order between CCS and non-CCS power plant LCoEs according to different CO2 price scenarios.
2.2.Public studies selection and scope of analysis
The public studies selected in this paper are the following: IEA (2010, 2011, 2012b, 2012d), Alstom (2011), DECC (2012, 2013), Global CCS Institute (2011, 2013), ZEP (2011a, 2011b, 2011c), NETL (2010a, 2010b) WorleyParsons (2009, 2011), NZEC (2009) and WU N. et al. (2013).
These studies have been selected because they are considered as references in the “CCS sphere” and were published over the last five years. Noteworthy is the suggestion made by the Global CCS Institute (GCCSI, 2011) at public studies that recently showed significant increase of CCS costs: “The levelised cost estimates in the studies [NETL, WorleyParsons, IEA, ZEP] are consistently higher than those estimated three or more years ago. Due to changing methodologies and the inclusion of previously omitted items, costs are now suggested to be 15 to 30 per cent higher than earlier estimates” (p66).
This study focuses on:
- new-built large-scale base-load operating coal and gas plants (more than 350 MW),
- mature CCS techniques (not pilot projects). Thus, provided costs are not relative to FOAK (Fst Of A Kind) power plants. The cost data provided by the public studies used in this paper are for 2015-2020.
It as to be said that cost data presented in this study do not intend to represent the costs of specific projects, but try to indicate a global trend.
- capture techniques whose capture rate is larger than 85%.
2.3.How can techno-economic information from different studies been turned into a comparable set
of data?
As previously said, most studies have their own methodology to calculate economic data such as the capital cost, the LCoE… Moreover, there is not a set of commonly agreed on boundary conditions such as the discount rate, the fuel cost… As a consequence, it is very tricky to compare straightforward CCS cost data from different studies. Indeed, the LCoE is very sensitive to parameters such as the plant efficiency, the fuel price, the discount rate… (Figure 2).
9 To address this issue and objectively compare LCoE and CO2 switching prices from different studies, only 4 data are kept from the selected public studies: Overnight cost21
, Operating and maintenance costs, CO2 emission factor and net power (table 2).
Several techno-economic parameters (table 4) and calculation methodologies (table 3) are standardized.
21
IDC are calculated in a very simplified way. Let’s assume that the construction time is 4 years and that the life time is 20 years. The annuity is levelised from year 4 to 23 instead of 0 to 19. It means that during the four first years the power plant pays interests and starts its production from the fourth year. Some studies, the ZEP’s one for instance, provide capital costs with IDC and/or owners’ costs. It implies the recalibration of capital costs by subtracting IDC and/or owner’s costs. Note that net power outputs are unchanged. Indeed, studies might take into account scale effects.
22
Only three studies analyze Chinese CCS costs: NZEC (2009), IEA (2010), WU N. et al. (2013). 23
I divide into ultra-supercritical coal plants and IGCC plants for IGCC remain little used (there are less than 10 IGCC around the world and the technology is still a demonstration and experimental stage) and have different investment and operating and maintenance costs. IGCC can only be fitted on pre-combustion capture.
24
PARK Chans S. [Analyse économique en ingénierie, Editions du renouveau pédagogique, 2009, p63-64] gives: 4% "5%" 6%7) "8)%" 9%%:!"; =∑ = 2=>?@ABCDE FGHI3J E JKL [1] so: 4% "5%" 6%7) "8)%" 9%%:!"; = M N 2€ PQR 3×0TTT∗
VWXT Y × 2%3∗∑E 2=>?@ABCDE FGHI3J=
JKL
[2].
Table 2: Unchanged techno-economic parameters
Table 3: Standardized calculation methodologies
Unchanged techno-economic parameters
Unit European value range [min; max]
Chinese value range22 [min; max]
Overnight cost
Ultra-supercritical coal plant23 IGCC plant
CCS coal plant
Post-combustion Oxy-combustion Pre-combustion Combined Cycle Gas plant CCS gas plant €2011/kW [1283; 1659] [ZEP; Alstom] [1660-1923; 2235] [DoE; DECC] [2145; 2858] [ZEP; WorleyP.] [2436; 3142] [AIE; DECC] [2618; 3045] [AIE; ZEP] [507; 654] [DoE; AIE] [1064; 1430] [DoE; ZEP] [589; 913] [IEA; WU N.] [618; 2102] [IEA; WU N.] [1208; 1469] [NZEC; WU N.] [1272; 3154] [IEA; WU N.] 436 [IEA] 785 [IEA]
Operation and Maintenance costs
Ultra-supercritical coal plant IGCC plant
CCS coal plant
Combined Cycle Gas plant CCS gas plant €2011/MWh [5; 12] [Alstom; DoE] [7.5; 23] [DECC; DoE] [7; 19] [DECC; DoE] [2; 6] [DECC; ZEP] [4; 13] DECC; ZEP] [1.7; 5.3] [IEA; NZEC] [2; 9.8] [IEA; MIT] [3.3; 17.7] [IEA; NZEC] 1.3 [IEA] 2.5 [IEA] CO2 emission factor
Coal plant without CCS Gas plant without CCS
tCO2/MWh
[0.7; 0.8] [0.33; 0.37]
Net power MW [400; 800]
Calculation methodology
Applied to studies since the beginning
Applied to studies at the standardization time
CO2 emission factor X X
Constant investment annuity24 X X
LCoE X X
CO2 switching price X X
CO2 cost X
10
Table 4: Standardized techno-economic parameters
Note that carbon transport and storages costs come from ZEP’s reports (2011b and 2011c). Indeed, the ZEP is considered as a reference30 and has provided very well detailed reports that distinguish onshore and offshore carbon transport and storage costs, for coal and gas plants. Indeed, it seems that the EU has mostly off-shore storage capacities, whereas China would have both (DAHOWSKI R.T. et al., 2009). There are still great uncertainties about storage potentials because of the lack of detailed site characterization studies.
25
Cost data are calibrated to 2011 cost levels by using cost indices (Price index Consumer from http://stats.oecd.org/, Eurostat, Oxford Economic (Forecast) and Asia Pacific Consensus Forecast (April 2013)). Then cost data are converted from the original currency to EUR2011. Exchange rates are from OECD stat.
26
According to public studies, the CO2 capture rate ranges from 70% (Alstom, 2011, for gas) to 95% (AIE, 2010, oxy-combustion capture on a gas plant). A 90% value is chosen because it is the most widely used value (DoE-NETL, WorleyParsons, IEA and ZEP).
27
Standardizing fuel prices means that fuels are homogeneous. Comparability between studies is higher. European fuel price hypothesis come from the World Energy Outlook 2012 (IEA, 2012c). Chinese fuel price assumptions come from the comparison of several studies (bibliography). Indeed, there are no official fuel prices in China, for prices are partly/totally administered.
28
Owners’ costs are calculated as a fraction of the overnight cost. According to studies, owners’ costs range from 5% (EPRI) to 25% (DoE-NETL). A 15% value is chosen. It takes into account a risk premium.
29
On-shore: 180 km pipe. For a single CCS coal plant (2X700 MW), CO2 transported: 10 Mtpa, for a single CCS gas plant: 2.5 Mtpa.
Off-shore: 500 km pipe +feeders + Distribution pipeline. Cluster of CCS coal (3X700 MW) and CCS gas (2X360 MW) plants. CO2 transported: 20 Mtpa. Mid scenario.
30
For example, DECC’s report (2012) writes: the ZEP’s “review of transport costs provides the most recent and in our opinion reliable general assessment”. Idem for storage costs.
Standardized techno-economic parameters
Unit European values Chinese values
Currency25 €2011
Capacity factor % 85 [7 446 hours/yr] = BASE
Capture rate % 9026
Plant efficiency
Coal plant (PCI) CCS coal plant Gas plant CCS gas plant % % % % [9 pts of penalty] 45% (2015) 36% (2015) [8 pts of penalty] 60% (2015) 52% (2015) Construction time
Coal plant (PCI) CCS coal plant Gas plant CCS gas plant years years years years 4 5 2 3 Lifetime Coal plant Gas plant years years 40 25 Fuel price27
Black coal (Illinois n°6) Natural gas $2011/GJ $2011/GJ 2015: 4.34 (108.5 $/t) 2015: 11.61 (11 $/MBtu) 2015: 3.8 (95 $/t) 2015: 10.55 (10 $/MBtu) CO2 price €/t 0
Owner’s cost28 Overnight cost % 15
Discount rate [real and after tax] % 8
Transport costs29 €2011/MWh
Off-shore: 5.8 On-shore: 1.35 Off-shore: 4.35
Storage costs
Deep saline aquifer. Mid scenario (ZEP, 2011c). €2011/MWh Off-shore : 8.7 On-shore: 3.45 (coal)/ 1.8 (gas) Off-shore: 6.5
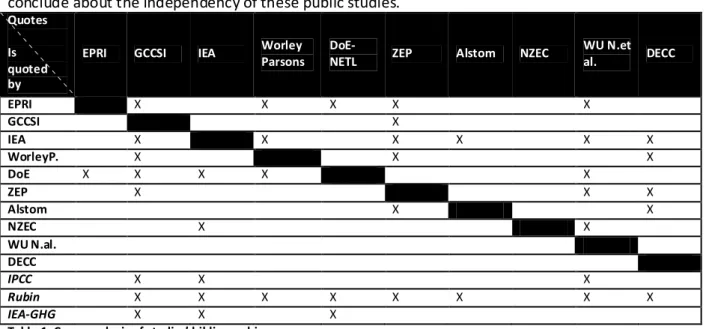
11 This standardization process allows a rigorous calculation and comparison of LCoEs and CO2 switching prices between studies. After this standardization, cost data from studies are less heterogeneous. Across studies, LCoE values could:
- Range from 30 to 75% for a specific coal power plant type (Figure 3), - Reach 75% for a specific post-combustion gas plant type.
After the standardization, it has been observed that LCoEs:
- Range from 12 to 25% for a specific coal power plant type (Figure 3), - Range 0 to 15% for a specific post-combustion gas plant type.
This higher homogeneity in cost data is in accordance to the GCCSI (2011): “The different cost
estimates observed in the various studies arise due to differences in assumptions regarding technology performance, cost of inputs or the methodology used to convert the inputs into levelised costs. Many of these differences disappear when the assumptions are normalized and a common methodology is applied”.
LCoE residual differences between studies for a specific power plant type are mainly due to discrepancies in O&M assumptions (they can vary substantially by a factor of more than 2 or 3). For instance, LCoE residual differences are reduced by 70% when IEA O&M assumptions are applied.
2.4.Chinese cost calculation
Only very few studies compare CCS costs in China: the NZEC’s study (2009), the IEA’s (2010) and the WU N. et al.’s (2013). In fact, there are many studies about Chinese IGCC and ultra-supercritical coal plant cost comparison, but they neither consider CCS nor the CO2 price beyond which a particular kind of power plant become profitable regarding other kinds of power plants.
However, by using cost location factors, it is possible to assess CCS costs in China. Indeed, WorleyParsons (2011) has defined cost location factors31 using data from Richardson Products’ International Cost Factor Location Manual 2009-2010 Edition. Richardson is usually considered as the reference in the field of regional cost indices. Thus this study uses cost location factors32 from WorleyParsons’ study (Table 5).
31
“To support conversion of the reference case costs from USGC [US Gulf Coast] to location specific costs (expressed in US dollars) for the selected cities/countries, conversion indices were developed for three major cost elements. These include imported equipment and materials, locally sourced equipment and materials, and labour.”
32
When data costs refer to European power plants [ZEP, Alstom, DECC], I apply the cost location factor to move a power plant from Europe to the USGC and then I apply the cost location factor to move the plant from the USGC to China. Note that for the NZEC’s study, I only convert cost data from CNY2009 to EUR2011. Cost location factors can be applied straightforward for two studies: DoE-NETL’s and WorleyParsons’. Indeed, in
0 20 40 60 80 100 120 DoE-NETL IEA ZEP Alstom WorleyParsons DECC 73 75,2 79 85 101 111 LCoE (€/MWh)
LCoE of European coal plants with postcombustion capture
0 20 40 60 80 100 120 ZEP IEA DECC DoE-NETL WorleyParsons Alstom 92 99 101 102 103 115,5 LCoE (€/MWh)
LCoE of European coal plants with postcombustion capture
Figure 3: LCoE of European coal plants with post-combustion capture, before [left] and after [right] standardization. Transport and storage costs are not included.
25% diff. 40% diff.
12
Capital and O&M Costs33
Region Equipment Materials Labor
United States (USGC) 1 1 1
Europe (Euro Region) 1.19 1.16 1.33
China 0.81 0.81 0.05
Table 5: Regional indices used to transfer projects from USGC to specific locations
Note that cost location factors cannot be used to turn European carbon transport and storage costs into Chinese costs. Indeed, the ZEP provides aggregated data: CAPEX and OPEX. Thus the relative share of equipment, materials and labor is unknown. To get Chinese carbon transport and storage costs, the following ratio is applied: [:(#ℎ5 !%& [4 )( [5(!";€/] ^ _5(`)" ab#ℎ5%&) (5")⁄ ] ^/€. With 2013 OECD data, a value of 0.75 is obtained. In the absence of reliable Chinese information about Transport and Storage (T&S) costs, a reduction of 25% is applied to European costs.
Thanks to this cost location factor approach, CCS costs in China can be assessed through 8 studies instead of 3. So this study fills the current gap by providing and comparing CCS costs data in China.
3. Economic panorama of CCS power plants
The results of the calculation and interpretation of the two key metrics, LCoE and CO2 switching price, are presented below.
3.1.None of the carbon capture techniques have a clear cost advantage
For gas plants, only one carbon capture technique is studied: post-combustion capture. Note that if all OECD studies analyze CCS gas plants, only one of the three studies about Chinese CCS costs analyzes CCS gas plants: IEA (2010). It’s hardly surprising. Indeed, in 2010, gas power plants generated only 2% of the Chinese electricity. In 2015, their share could rise to 3.5% (IEA, 2012b).
For coal plants, none of the carbon capture techniques have a clear cost advantage34. This observation is shared by the Global CCS Institute (2011, p66): “Given the uncertainties, at this stage, it is
difficult to identify any single technology with a clear cost advantage”. Although post-combustion
capture techniques do not have a clear cost advantage, they should be the first to be deployed at a commercial scale for they are the most mature. Pre-combustion capture only concerns IGCC plants which are still few and at the FOAK stage. Oxy-combustion capture seems to be a promising technique but still needs research and development efforts to reduce energy consumption for the oxygen production (chemical looping could be part of the solution).
these two studies, the Labour/Equipment/Raw Materials items clearly appear. But the ZEP, DECC and Alstom studies, provide global/concatenated investment and O&M cost data. Thus, thanks to DoE and WorleyParsons’ studies, an allocation key [one for investment cost and one for O&M costs] has been determined and then applied to ZEP, Alstom and DECC’s studies. Cost location factors are applied to studies after the standardization (see 3.3.).
33
These factors remain constant over the time which might be a limitation of this study and could give further developments. 34
For The EU: for ZEP, the capture technique which have the lowest LCoE is post-combustion for ZEP (92 €/MWh), pre-combustion for the IEA (98 €/MWh), and oxy-combustion for the DECC, WorleyParsons and Alstom (that doesn’t study pre-combustion capture) (respectively 95, 97 and 109 €/MWh). Note that the DoE-NETL doesn’t study oxy-combustion capture and doesn’t give a clear rank between carbon capture techniques. Rankings are exactly the same for China. Indeed, Chinese CCS costs are directly given by 3 studies (NZEC, IEA, WU N. et al.) and derived from 5 US or European studies (ZEP, Alstom, DoE, WorleyParsons, DECC) through cost location factors. Thus, for China too, it is not possible to identify one carbon capture technique with a clear cost advantage. T/S costs are not included here.
13
3.2.Extra-costs due to CCS device
A CCS plant undergoes an increase in both investment and O&M costs.
- Fixed costs:
The coal overnight cost increases on average by 70% in Europe vs 60% in China. The gas overnight cost increases on average by 110% both in Europe and China.
- Variable costs:
Net efficiency penalties of 9 percentage points for coal plants vs 8 points for gas plants which imply an increase of respectively 25% vs 15 % in fuel costs.
O&M costs increase on average by 80% for coal plants and 100% for gas plants. By adding carbon capture, coal LCoE increases on average by 60% (onshore T&S costs) or 74% (offshore T&S costs) in China (respectively 63 and 70 €/MWh) vs by 80% in European countries (106 €/MWh). Chinese LCoEs for CCS coal plants are 43 to 35 €/MWh lower than European’s.
By adding carbon capture, gas LCoE increases on average by 30% (onshore T&S costs) or 44% (offshore T&S costs) in China (respectively 75 and 83 €/MWh) vs 55% in European countries (104 €/MWh). As a result, Chinese LCoEs for CCS gas plants are 29 to 21 €/MWh lower than European.
3.3.CO2 price and breakeven point
Chinese CO2 switching price are almost twice as low than European.
CCS coal power plants become more profitable than reference coal plants beyond an average CO2 price estimated in China to 33 €/t with onshore carbon transport and storage costs and to 42 €/t with offshore transport and storage costs, vs 67 €/t for European countries35.
CCS gas power plants become more profitable than reference gas plants beyond an average CO2 price estimated to 55 €/t (onshore T&S costs) or 82 €/t (offshore T&S costs) for China vs 115 €/t36 for European countries.
3.4.The investor’s vision on CCS: depending on the CO2 price, in which power plant type invest?
Until now, I have calculated intra-technique CO2 switching price (CCS coal plant vs reference coal plant// CCS gas plant vs reference gas plant). However, in practice, whatever the CO2 price, an investor will compare all the possible arbitrations: reference coal plant vs reference gas plant, reference coal plant vs CCS gas plant, reference gas plant vs CCS coal plant and as seen before, reference coal plant vs CCS coal plant and reference gas plant vs CCS gas plant. Then he will choose the power plant with the lowest LCoE. The power plant type with the lowest LCoE varies with the CO2 price.
Arbitrations in bold correspond to inter-technique CO2 switching price, the others to intra-technique CO2 switching price. Inter-technique CO2 switching price are absent from CCS literature. By taking into account all the possible arbitrations, intra and inter-technique CO2 switching prices better represent the complex reality of an investor.
Results vary a lot between European countries and China. Thus, I’ll first study Europe, then China and finally, I’ll quickly compare them.
35
It is in accordance with the specialized literature. Offshore storage costs. 36
14 3.4.1. In European countries
When the CO2 price is low (less than 20 €/t)
Coal and gas reference power plants are the most competitive, that is to say they have the lowest LCoE. Then, the main decisive factors for investment are relative fossil fuel prices. It echoes the “fuel switch” concept.
What happened in Europe a few months ago is a good illustration. Indeed, because of the shale gas exploration, the United States have increased their coal exportations to Europe. Thus, the European coal price has become even lower than the gas price. Moreover, the European CO2 price is less than 5 €/t. Thus, coal plants have increased their competitiveness compared to gas plants. As a consequence, in April 2013, GDF Suez mothballed three out of four CCG: two for summer time (Combigolfe and Spem) and one for indeterminate period (Cycofos).
When the CO2 price is more significant: from 20 € to 67 €/t
When the CO2 price increases, the carbon burden becomes significant for reference power plants37.
Beyond 20 €/t38, it is more interesting to invest in a gas plant than in a coal plant.
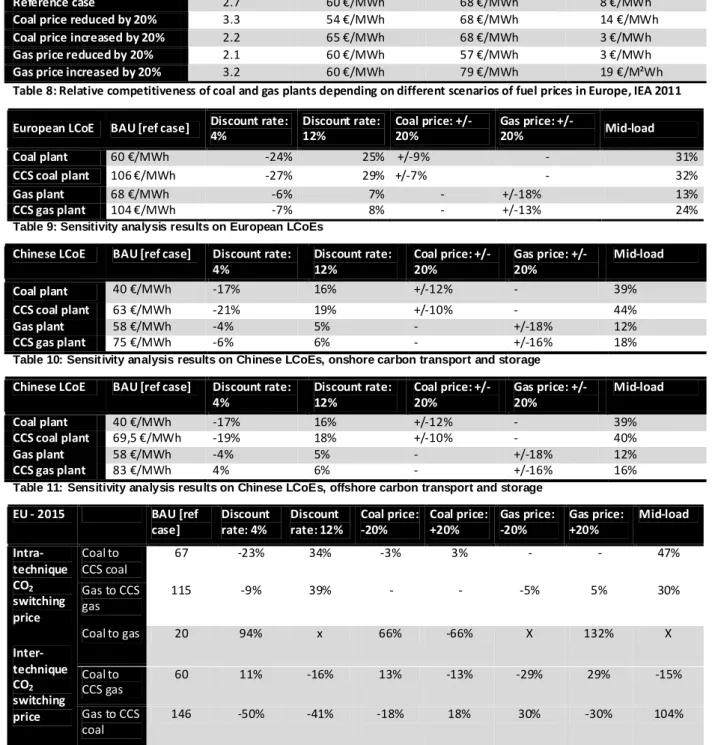
This coal to gas CO2 switching price is highly sensitive to fossil fuel prices (Table 8 in Annex).
Ceteris paribus, when the coal price varies by +/-20%, the CO2 switching price varies more than
proportionally by +/-50%. This switching CO2 price is even more sensitive to gas price: when it varies by +/-20%, the CO2 switching price varies by +/-95%.
To summarize, beyond 20 €/tCO2 until 67 €/tCO2, gas plants are the most profitable power plant type.
When the CO2 price ranges from 67 to 115 €/t
CCS coal plants become more profitable than reference coal plants (relative cost-effectiveness). However, the reference gas plant is still the most profitable power plant type ie they have the lowest LCoE.
When the CO2 price is higher than 115 €/t
CCS power plants are more cost-effective than reference power plants. More precisely, CCS gas plants and not CCS coal plants have the lowest LCoE, except for the ZEP. It could be surprising because the intra-technique CO2 switching price is higher for gas than for coal plants. Recent declarations seem to confirm this result. During the ZEP’s Assembly (September 2012), it was said that funding CCS gas pilots was a priority. In England, the Peterhead CCS project is a CCS gas plant.
To summarize, in European countries, the investment choice first depends on the switch induced by fossil fuel prices. Currently, from 0 to 20 €/tCO2, coal plants are the most cost-effective power plant type, and from 20 to 115 €/tCO2, gas plants become the most profitable. Then, when the CO2 price exceeds 115 €/t, a second switch, favorable to (gas) CCS power plants, dominates.
37
For instance, with a CO2 price at 40 €/t, the LCoE of reference coal plants increase by 40% (+30 €/MWh) and the LCoE of reference gas plants increase by 15% (+15 €/MWh).
38
15 3.4.2. In China
Two cases need to be distinguished: when carbon transport and storage infrastructures are onshore or offshore.
Onshore carbon transport and storage costs
When the CO2 price is lower than 33 €/t, coal plants are the most profitable power plant type. When the CO2 price is higher than 33 €/t, CCS coal plants become the most cost-effective power plant type.
Note that beyond 55 €/tCO2, CCS gas plants become more profitable than reference gas plants, but are still less competitive than CCS coal plants.
Thus, in China, the investment choice only depends on the CO2 price. When it is lower than 33 €/t, reference coal plants are the most profitable power plant type, beyond, these are CCS coal plants. Offshore carbon transport and storage costs
For the ZEP (2011) and IEA studies (2011), when the CO2 price is lower than 42 €/t, coal plants are the most profitable power plant type. When the CO2 price is higher than 42 €/t, CCS coal plants become the most cost-effective power plant type.
For the DoE, WorleyParsons and DECC studies, when the CO2 price is lower than 38 €/t, coal plants are the most profitable power plant type. When the CO2 price is between 38 and 50 €/t, gas plants are the most cost-effective power plant type. When the CO2 price is higher than 50 €/t, CCS coal plants become the most profitable power plant type.
On average, the CO2 price beyond which CCS coal plants become the most profitable baseload power plant is 47 €/t.
3.4.3. China and EU CCS costs comparison
To conclude, in China, when the carbon transport and storage network is onshore, gas plants, with or without CCS, are never the most profitable option.
When the carbon transport and storage network is offshore, gas plants are the most competitive plant type for a small range of CO2 prices: between 38 and 50 €/t. As the lifetime of a gas plant is 25 years vs 40 years for a coal plant, if the CO2 price is expected to rise quickly, gas plants might be less interesting than CCS coal plants or at least CCS ready coal plants.
Thus, it can be said that in China, coal plants, with and without CCS, are almost always the most profitable power plant type.
On the contrary, in European countries, gas plants, without and then with CCS are the most cost-effective power plant type beyond 20 €/tCO2.
The CO2 switching price beyond which CCS power plants become more profitable than all the other power plant types is 115 €/tCO2 in Europe (LCoE around 105 €/MWh) against only 33 €/tCO2 in China when the transport and storage network is onshore (LCoE around 65 €/MWh) and 47 €/tCO2 when the Chinese network is offshore (LCoE around 70 €/MWh).
This result is mainly due to lower investment and O&M costs in China than in European countries and, in a lesser extent, to cheaper raw materials and fuel prices.
16 4. Sensitivity analysis
I assess the sensitivity of European and Chinese LCoEs and CO2 switching prices to variations of the standardized techno-economic parameters.
Standardized techno-economic parameters
Unit Value Variations
Capture rate % 90 - 5 points (85%)
Load factor39 Hrs/yr Base load vs Mid load
Construction time Coal plant CCS coal plant Gas plant CCS Gas plant Year Year Year Year 4 5 2 3
Coal plant: +1 year Gas plant : +1 year
Lifetime Coal plant Gas plant Year Year 40 25 - 5 years [-5 years; +5 years] Fuel price Hard coal Natural gas $2011/GJ $2011/GJ Europe in 2015: 108.5 $/t China in 2015: 95 $/t Europe in 2015: 11 $/MBtu China in 2015: 10 $/MBtu [-20% ; +20%] [-20% ; +20%]
Discount rate [real and post tax] % 8 [-4 points ; +4 points]
Plant efficiency
Centrales charbon (PCI) Centrales charbon avec CCS Centrales gaz
Centrales gaz avec CCS
% % % % 45% 36% 60% 52% 49% 40% 63% 55%
Table 6: Parameters used to run sensitivity analyses
Results of sensitivity analyses reveal that only the discount rate, fuel prices and load factor variations have a real impact on the LCoE merit order and CO2 switching prices40. For detailed results, see Tables 9 to 14 in Annex.
Coal LCoEs (with and without CCS) are more sensitive to standardized parameters variations than gas LCoEs (with and without CCS) except for fuel prices. It can mostly be explained by the fact that the share of the capital cost in the LCoE is higher for coal plants (45% for EU, 30% for China) than for gas plants (15% for EU, 11% for China). Discount rate and load factor play a significant role in the capital cost calculation. Consequently, the more capitalistic power plants are, the higher their influence.
Note that in the EU, for reference coal plants, the capital cost share in the LCoE is higher than the fuel cost share (45% vs 41%) whereas in China the capital cost share is lower (30% vs 62%) than the fuel cost. For gas plants, the fuel cost share in the LCoE is much higher than the capital cost share: 80% vs 15% in European countries and 87% vs 11% in China. The fuel cost share in the LCoE is higher in China than in European countries, mostly because Chinese capital and labor costs are lower which mechanically increases the fuel cost share in the LCoE.
39
Technical issues and higher efficiency penalties (and thus higher costs) induced by a lower load factor are not taken into account. 40
Note that in our sensitivity analysis, the efficiency penalty induced by a CCS device is kept constant: 9 points for coal plants, 8 for gas plants. Thus, LCoEs and CO2 switching prices are less sensitive to plant efficiency variations than in the case where the efficiency penalty would also vary. The results of sensitivity analysis are not detailed here because they are less significant than the one obtained for discount rate, fuel prices and load factor (due to this constant efficiency penalty).
17 Intra-technique switching prices are more sensitive for coal plants than for gas plants except for fuel prices. The explanation is the same as above: the share of the capital cost in the LCoE is higher for coal plants than for gas plants.
In European countries, when the CO2 price is null, the reference gas plant (and not coal plant) is the most profitable power plant type for 2 scenarios: mid-load and a 12% discount rate. In China, when the CO2 price is null, whatever the scenario, the reference coal plant is always the most profitable power plant type.
In European countries, I have shown that when the CO2 price is high enough, the CCS gas plant (rather than CCS coal plants) is the most profitable power plant type. Sensitivity analyses show there are only two scenarios for which CCS coal plant and not CCS gas plant is the most profitable power plant type: a coal price reduced by 20% and a 4% discount rate which corresponds to the public policy rate.
In China, it’s the opposite: in the reference case, when the CO2 price is high enough, the CCS coal plant is more profitable than the CCS gas power plant type except for the mid-load scenario.
In European countries and in China, the CO2 price to switch from a reference plant to a CCS plant varies widely. However, a general trend appears. In Europe, the CO2 price to switch from a reference to a CCS plant is around 110 €/tCO2 except for the discount rate and the mid-load scenarios.
In China, when techno-economic conditions do not allow gas plants to be the most profitable power plant type whatever the CO2 price, the CO2 price to switch from a reference to a CCS plant ranges from is around 30 €. When gas plants are the most profitable power plant type for a given range of CO2 prices, the CO2 price to switch from a reference to a CCS plant is higher and ranges from 45 to 67 €.
5. What about 2030?
According to many studies, CCS techniques could be mature in 2030. It means that, thanks to R&D investments, economies of scale and learning by doing effects, CCS investment and operating costs should have decreased significantly in 2030. Mechanically, the CO2 price beyond which CCS plants become the most profitable power plant type should have decreased too. As a consequence, CCS power plant attractivity should be higher in 2030. Thus the question is: how much cheaper advanced CO2 capture systems will be compared to current technology.
As previously said, the costs of mature CCS plants provided by the public studies used in this paper are for 2015-2020, except the IEA and the DECC41 that respectively provide costs for 2015-2030 and 2013-2020-2028. However, given the delays/cancelation observed for CCS LSIPs, CCS has not yet taken off in the world. Thus the costs provided for 2015-2020 rather correspond to 2030 cost data.
To assess more precisely CCS costs in 2030, I refer to the DECC’s study which is very recent (2013) and thus updated in comparison with the other studies (2009 to 2011), and moreover distinguishes costs for 2013, 2020 and 203042.
The ZEP analysis doesn’t particularly look at the cost reduction process, ie doesn’t give cost projections for carbon transport and storage costs in 2030. As the DECC (2012) low cost path is “broadly in line with the ZEP estimates for early commercial costs”, carbon transport and storage costs for 2030 are from the DECC (2012, 2013)43. They correspond to offshore infrastructures.
41
Alstom also gives CCS costs in 2015 and 2030 but its 2030 data are too much aggregated to be exploited. 42
To project CCS costs in 2030, the DECC refers to Rubin’studies (2007, 2010) which are considered as references. They use historical experience curves as the basis for estimating future cost trends for CCS power plants. They first assess the rates of cost reductions achieved by other energy and environmental process technologies in the past. Then by analogy with leading capture plant designs, they estimate future cost reductions that might be achieved by power plants with CO2 capture.
43
18 WU N. et al.’s paper (2013) considers CCS costs by 2030 by reducing capital and O&M costs but do not modify fuel prices assumptions. This scenario of constant fuel prices has the advantage to isolate the learning by doing and economies of scale effects (Scenario 1). However, this assumption of constant fuel prices is rather unrealistic.
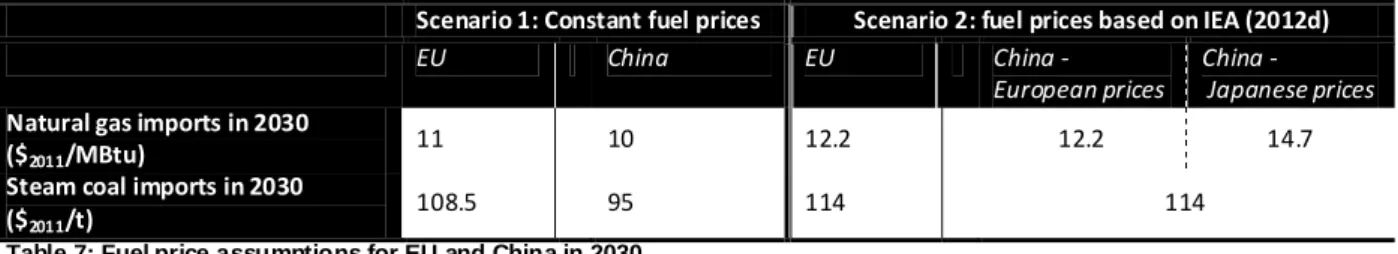
That’s why, I have also made a fuel price scenario based on the WEO 2012 projections by 2030 (“New Policies scenario”, 2012c) (Scenario 2). For steam coal prices by 2030, according to the IEA, the OECD coal price is “a proxy for international coal prices”; thus I adopt this value for the EU and China. For natural gas prices, I directly use the IEA projection for the EU, since there is none for China. There is currently an uncertainty on Chinese fuel prices effectively paid by utilities because prices are administered and often kept lower to avoid triggering high inflation rates. Moreover, there is a high fuel price heterogeneity between regions. Thus, for the future, the uncertainty is very high and, to our knowledge, there are no public projections on the future level of Chinese fuel prices. I assume that, by 2030, Chinese gas prices follow either Japanese prices (in 2011, 54% of Chinese imports were liquefied natural gas whose price is supposed to follow the Japanese price (IEA, 2012b)) or European prices (relatively to the high volumes of natural gas which are imported, China has a bargaining power).
Scenario 1: Constant fuel prices Scenario 2: fuel prices based on IEA (2012d)
EU China EU China -
European prices
China - Japanese prices
Natural gas imports in 2030 ($2011/MBtu)
11 10 12.2 12.2 14.7
Steam coal imports in 2030 ($2011/t)
108.5 95 114 114
Table 7: Fuel price assumptions for EU and China in 2030
For detailed results see Tables 15 and 16 in Annex.
In the EU, if fuel prices are constant over the time, the CCS gas plant is the most profitable power plant type when the CO2 price is high enough (above 83 €/tCO2). The same result is obtained if fuel prices follow the IEA trends (CCS gas plant is the most profitable power plant type above 86 €/tCO2). However, the profitability frontier that divides CCS gas plants from CCS coal plants is thin.
It also should be noticed that the CO2 price that causes the switch from a coal plant to a gas plant is lower in the first scenario than in the second (which is more realistic) and both are higher than the 2015 value.
As a consequence, by 2030, European actors should invest in gas plants rather than coal plants, since the IEA forecasts a CO2 price above 30 €/t (2012c) (Figure 4). Contrary to China in 2030, European CCS power plants are still not profitable because of the low CO2 prices that are forecast.
As Figure 4 suggests, according to IEA’s projections, coal plants burning international coal have still a future in Europe. CCS plants (coal or gas) are far away from being competitive (very high CO2 price compared to IEA forecasts: red points).
For China, the CO2 price beyond which CCS power plants become the most profitable power plant type is around 33 € (47 €/t on average by 2015). It’s very low in comparison with the EU: more than 83 €/t. As onshore T/S costs are at least twice lower than offshore costs, in 2030, Chinese CCS coal plant with onshore transport and storage infrastructures could be the most profitable plant type for a CO2 price higher than 28 €/t. This CO2 price level could be reached realistically in China: the IEA (2012a) forecasts a CO2 price at 20 €/t in 2030 and 25 €/t in 2035. Thus Chinese actors should keep in mind this
19 when they invest in new power plants in the early 2020s (and choose CCS coal plants)44 or be ready to retrofit CCS by 2030 (Figure 5).
Figure 4: Profitability areas for power plant types based on fuel pr ice ratio45
and CO2 price in the European Union. Simulations on the DECC study, offshore T/S costs.
44
At least in the early 2020s because coal power plants have a lifetime of 40 years: with a rising CO2 price, reference coal plants would not be profitable for the lifetime project, contrary to CCS coal plants (not profitable in the early 2020s, but highly profitable in the early 2060s, at the end of the lifetime).
45
I have a similar approach to BLYTH W. and YANG M. (2006). Coal price is fixed and gas price varies. 0,00 10,00 20,00 30,00 40,00 50,00 60,00 70,00 80,00 90,00 100,00 2,17 2,26 2,35 2,45 2,57 2,69 2,82 2,97 3,14 3,32 3,53 3,76 4,03
Ratio [gas price]/[coal price]
C O2 p ri ce in € /t
Power plant type profitability based on fuel price ratio and CO2price Coal plant Gas plant CCS Coal plant CCS Gas plant 2030? 2015
20
Figure 5: Profitability areas for power plant types based on fuel price ratio46
and CO2 price in China. Simulations on the DECC study, offshore T/S costs.
6. Conclusion
In this study, I have developed a methodology to objectively compare CCS costs provided by public studies. I have also shown that when CCS costs for a specific region, here China, are not given, a cost location factor approach can be adopted. Then, I have demonstrated that there exists several CO2 switching price; to be sure that a CCS power plant is the most profitable investment, both intra and inter-technique CO2 switching price have to be considered. This distinction have pointed out that in the EU, contrary to common beliefs, CCS coal plants are not profitable when the CO2 price is higher than 60 €/t. Indeed, at 60 €/tCO2, CCS coal plants become more profitable than reference coal plants but they are not the most profitable power plant type (gas plant is). For the record, LCoEs and these CO2 switching prices are calculated for baseload plants; indeed, costs soars when the load factor is lower. Last but not least, LCoEs and CO2 switching prices are highly sensitive to fuel prices (in absolute and relative terms) and were calculated, in this paper, with international prices (IEA (2012c) assumptions).
46
I have a similar approach to BLYTH W. and YANG M. (2006). Gas price is fixed and coal price varies. 0,00 10,00 20,00 30,00 40,00 50,00 60,00 70,00 80,00 90,00 100,00 2,17 2,26 2,35 2,45 2,57 2,69 2,82 2,97 3,14 3,32 3,53 3,76 4,03 Coal plant CCS Coal plant
Power plant type profitability based on fuel price ratio and CO2price
Ratio [gas price]/[coal price]
C O2 p ri ce in € / t 2030? 2035? 2015


![Figure 3: LCoE of European coal plants with post-combustion capture, before [left] and after [right] standardization](https://thumb-eu.123doks.com/thumbv2/123doknet/2490984.50920/13.892.52.863.441.636/figure-lcoe-european-plants-combustion-capture-right-standardization.webp)