Characterization Of Wake- And Tip-Vortex-Induced Unsteady
Blade Response In Multistage Compressor Environment
by
Geoffroy Lenglin
Dipl6me d'ing6nieur, Ecole Polytechnique (July 1999)
Submitted to the Department of Aeronautics and Astronautics in partial fulfillment of the requirements for the degree of
Master of Science in Aeronautics and Astronautics at the
MASSACHUSETTS INSTITUTE OF TECHNOLOGY
February 2002
@
Massachusetts Institute of Technology 2002. All rights reserved.Author ... ...
Cpepfftn6ht
of Aerona4 cs and Astronautics -7January 25, 2002Certified by ... .. -... - r. ho
- -Dr. Choon S. Tan
Senior Research Engineer, Gas Turbine Laboratory Thesis Supervisor
Accepted by... --%.. ... .. . .. . . ... ..
Professor Wallace E. Vander Velde Professor of Aeronautics and Astronautics Chairman, Committee on Graduate Students
ASSACHUSETTS INSTITUTE OF TECHNOLOGY
AUG 1
3
2002
AERO
Characterization Of Wake- And Tip-Vortex-Induced Unsteady Blade Response In Multistage Compressor Environment
by Geoffroy Lenglin
Submitted to the Department of Aeronautics and Astronautics on January 25, 2002, in partial fulfillment of the
requirements for the degree of
Master of Science in Aeronautics and Astronautics
Abstract
Wake- and tip-vortex-induced unsteady response on an embedded blade-row in a stator-rotor-stator compressor stage have been assessed using three-dimensional unsteady time-accurate Reynolds-averaged Navier-Stokes numerical simulations. These consists of steady and unsteady wake interacting with a stator blade; unsteady tip vortex behavior on isolated self-induced rotor blade response; steady and unsteady wake interacting with rotor blade with unsteady tip vortex flow behavior; and response of rotor tip vortex to downstream stator. The computations are designed to generate unsteady flow fields that serve to address the following specific technical issues: (1) Conditions/situations for which blade excitations of aeromechanic consequence are to be anticipated; (2) self-induced excitations on rotor blade associated with inherent tip vortex unsteadiness/instability; (3) (resonant) response of rotor blade forced at frequency of rotor tip vortex unsteadiness/instability by upstream unsteady stator wake; (4) conditions for which excitations associated with wakes and tip vortex can effectively persist throughout compressor stages. Computed results for E3 rotor and stator B blade row in NASA low speed research compressor are presented for (1) illustrating the difference in stator response to an incoming steady and unsteady wakes; (2) identifying and characterizing the inherent rotor tip vortex unsteadiness/instability; (3) demonstrating the potential amplification of response when the rotor tip vortex is forced at its inherent frequency of instability (e.g. by stator wakes from upstream).
Based on the analysis of the computed results, the following observations can be deduced. The self-induced excitations associated with tip vortex inherent instability (at a frequency of 0.45 Blade Passing Frequency) can be considerable and its interaction with other inlet dis-turbances such as unsteady wakes play a role in the broadening and selective amplification of the spectrum of wakes. The frequency and structural content of the tip flow region are also described; the interface separating the low-momentum tip region from the core flow exhibits a wave-like oscillation which proceeds downstream at a velocity of 0.42 times the core flow velocity at a reduced frequency (based on blade chord and throughflow velocity) of 0.7 (0.45 Blade Passing Frequency). The tip vortex core also exhibits a periodical motion at a frequency of 1.15 BPF. It has been observed that the tip vortical structure is definable in the first 40% chord. Beyond that point, the tip region is a region of low-momentum flow. From the computed flow fields it cannot be conclusively deduced if it is the tip vortical structure or the region of low-momentum flow that is responsible for the observed flow unsteadiness.
(i.e. the wakes are taken to be inherently unsteady; this is to be differentiated from unsteadi-ness associated with blade row relative motion) other than blade passing frequency and tip vortex instability frequency (in rotor blade rows), new high frequencies - resulting from the mutual modulation of distinct disturbances -can be generated and transmitted downstream within the generated wakes. In both stator and rotor blade rows, it is found that the distinct frequencies independent disturbances can under appropriate conditions excerbate the result-ing interactions. This has the implication that the influence of unsteady wakes can persist throughout the compressor stages.
When the fluctuation frequency of incoming wakes equals the tip flow instability frequency, no resonance appears as was originally conjectured. The lack of resonant response is presently attributed to the fact that the spatial modal structure of the specified wake is different from that of the tip vortex instability.
Thesis Supervisor: Dr. Choon S. Tan
Acknowledgments
I wish to express my profound gratitude to Dr. Choon Tan for his constant support throughout
this research project. His guidance greatly helped me keep the real physical problems in mind, while taking a long necessary journey through numerical codes. His comments and suggestions have enabled me to learn how to better conciliate low-level programmer tasks with the critical perspective of an engineer. For that matter among many others, this work deeply holds his imprint. I also owe many thanks for technical advice and insightful comments from Professor
E. E. Covert and Professor N.A. Cumpsty on the occasion when I have had the privilege to
discuss my research with them.
I would also like to thank the students of the M.I.T. Gas Turbine Laboratory for the
count-less advices, technical and non-technical discussions that can make a day of research at GTL so dense and inspiring. I would especially like to acknowledge the insightful suggestions of Dr. Huu Duc Vo and Borislav Sirakov. Of course work at GTL could not have been as smooth without the dedication and kindness of its staff. I am especially thankful to Paul Warren and Holly Anderson for their technical and administrative help.
Finally, I would like to thank all the people implicitly mentioned above as well as the entire MIT Community for this extraordinary, yet too short, eighteen-month experience as a graduate student.
This work was sponsored by NASA Glenn Research Center NRA Grant NAG-2321, with Dr.
G. Stefko and Dr. P. Mccullum as technical monitors.
Contents
1 Introduction
1.1 Background and Previous Work . . . . 1.2 Goals and Content of the Thesis . . . . 1.3 Contributions . . . . 1.4 Thesis Organization . . . . 2 Approach and Numerical Tools
2.1 A Representation of Interaction in Multi-blade Rows G roup . . . . 2.1.1 The added effect of stage interactions . . . 2.1.2 Control-Module paradigm . . . . 2.1.3 Environment of a single Rotor-Stator stage 2.2 M ethodology . . . . 2.3 Stator simulations . . . . 2.3.1 Presentation of the code . . . . 2.3.2 Geometries and Flow Conditions . . . . 2.3.3 Input Flow - Boundary conditions . . . . . 2.4 Rotor 3D simulations . . . . 2.4.1 Numerical code . . . . 2.4.2 Implementation of blade row geometry . . . 2.4.3 E3 blading and Flow Parameters . . . . 2.4.4 W akes . . . . 2.5 Sum m ary . . . .
3 Unsteady Flow Computations in a Stator Stage 3.1 Introduction ...
3.2 Steady Rotor Wake-Stator Blade Interaction . .
3.3 Unsteady Rotor Wake-Stator Blade Interaction:
tions Within Wakes . . . . 3.3.1 Summ ary . . . . 4 Unsteady Flow Computations in a Rotor Stage
4.1 Self-induced tip vortex response . . . .
4.1.1 4.1.2 4.1.3 13 13 16 17 18 19 Using a Stator-Rotor-Stator . . . 19 . . . 20 . . . 21 . . . 23 . . . 24 . . . 26 . . . 28 . . . 28 . . . 29 . . . 30 . . . 30 . . . 30 . . . 31 . . . 36 . . . 38
Effects of Unsteady
Fluctua-Characterization of a spontaneous unsteadiness in tip flow region Frequency and Structural Content of Tip Flow Region . . . .
O rigin of TV F . . . . 40 40 40 43 47 48 48 48 52 59 . . . . . . . . . . . . . . . .
4.1.4 Impact on Blade Surface Pressure Distribution . . . 60
4.1.5 Forced Response of Downstream Wake . . . 65
4.1.6 Sum m ary . . . 65
4.2 Wake-Tip vortex interaction in a Rotor . . . 67
4.2.1 Interaction of Wakes with Low-Momentum Tip Flow . . . . 67
4.2.2 Impact of TVF and Wakes on Blade Forced Response - Implication on D esign . . . . 70
4.2.3 Sum m ary . . . . 75
4.3 Influence of wake fluctuations on the tip vortex. Potential of Resonance . . . . . 75
4.3.1 Comparison of flow characteristics and blade excitation for different fre-quencies of fluctuation of the incoming wakes - Identification of a reso-nance effect . . . . 76
4.3.2 Comparison of Frequency Content of the Rotor Blade Excitation . . . . . 80
4.3.3 Summary - Impact on the transmission and amplification of unexpected disturbances . . . . 83
5 Summary and Conclusion 84 5.1 Summary of Results and Conclusions . . . 84
5.2 Recommendations for Future Work . . . 86
A Additional Comments on Rotor and Stator Computations 88 A.1 Estimation of the performance of the stage from the computed performance of the rotor alone . . . 88
List of Figures
1-1 Typical Campbell Diagram ... ... 14
2-1 The possible range of possible phenomena in a compressor blade row . . . . 20
2-2 A feedback control analysis of blade rows interactions in a compressor . . . . 22
2-3 A single stage and its connections to the entire compressor . . . . 23
2-4 The different cases computed on the stator blade row . . . . 25
2-5 The different cases computed on the rotor blade row . . . . 27
2-6 Overview of the grid used for E3 B rotor geometry. (a) shows an axial cut of the grid in the vicinity of the tip gap; (b,c) show the shape of rotor blades; (d) shows an entire axial cut of the grid; (e) is a perspective of a radial cut of the single-passage grid with duct and rotor bladerow . . . . 32
2-7 StageB Characteristic of E3 with 3% tip gap from [21]. Our computation mean estimates are shown as circles (see Appendix A.1 for details) . . . . 34
2-8 Comparison of the time scales involved in our computations . . . . 35
2-9 Numerical Convergence of the B-Rotor of E3 with a 3% tip gap . . . . 36
3-1 Contour of Disturbance Vorticity Distribution Associated With The Interaction Of Stator With Upstream Wakes (Assumed Steady In Rotor Frame) Moving In The Tangential Direction [Valkov]; The Arrow Indicates The Direction Of The Disturbance Velocity From Suction Side To Pressure Side Within The Wake; The Vortical Disturbances In The Vicinity Of Suction And Pressure Surface Are A Result Of Wake-Boundary Interactions . . . 42
3-2 A Representative Result Associated With The Interaction Of A Stator With Upstream Moving Wakes Assumed Steady In Rotor Frame . . . 44
3-3 Unsteady pressure disturbance and corresponding frequency spectrum on blade surface associated with disturbance flow field due to interaction of stator blade with upstream moving wakes that are fluctuating with time in the rotor frame . 46 4-1 Accurate Spectral Analysis of Mass Flow . . . 49
4-2 Evolution of (a) Tip leakage mass flow (b) Rotor Loss Coeff. (c) Flow coefficient and (d) Leakage/total mass flow ratio . . . . 50
4-3 Spectral analysis corresponding to Figure 4-2 . (a,b,c,d) are frequency content corresponding to Figure 4-2 (a,b,c,d) . . . . 51
4-4 Relative Radial velocity around the tip vortex at 95% span and t=0, t=TVP/4, t=TVP/2, t=3TVP/4 with TVP the TV period. The dashed line is a reference line, the bold curves depicts the position of the tip vortex center . . . . 53
4-6 Computed Static pressure indicated at Probe 2, 52% C. and 31% pitch . . . 54
4-7 Series of static pressure probes and their corresponding power spectrum in the tip flow region. 95% hub-tip positions and 32% pitch . . . . 55
4-8 Typical axial cut of tip flow region . . . . 56
4-9 Left: Entropy contour showing TV pulsations in a 80% pitch cut; Right: Entropy contour in a 70% Cx Axial cut . . . . 57
4-10 Entropy (normalized by specific heat at constant pressure) contour at 90% span. 58
4-11 Cp profiles at different span sections on the blade surface at a given instant . . . 61
4-12 Time Analysis of Cp profiles on the rotor blade section at 99% span. Minimum, Mean and Maximum Cp profiles are shown. A profile at a given instant is also
represented. ... ... 61
4-13 Power Spectrum of Cp on PS and SS at 99% span on blade surface . . . . 62
4-14 Time Analysis of ACp profiles on the blade section at 99% span. Minimum, Mean and Maximum ACp profiles are shown. A profile at a given instant is also
represented. ... ... . ... . 63
4-15 Power Spectrum of ACp at 99% span on blade surface . . . . 64 4-16 Series of static pressure probes and their corresponding power spectrum in the
rotor wake. 0.1 chord behind the TE in the middle of the wake at different radial positions . . . . 66
4-17 Comparison of tip and total blockage for NW and SW. In first row are tip blockage maps, total blockage graphs are in second row. Only the local variation of the tip and total blockage ABlockage(x, t) are plotted where ABlockage(x, t)
Blockage(x, t) - Blockage(x, t) . . . 69
4-18 Power spectrum of Pressure coefficient at three axial position in the TV for the SW case. Probes are at 50% pitch, 95% span. . . . . 72
4-19 Power Spectrum of Delta Cp at 99% span across the tip gap . . . . 73
4-20 Power Spectrum of a pressure probe in the rotor wake at exit. Position of probes are 10% Cx behind rotor trailing edge in the middle of rotor wake, 90% span. . . 74 4-21 Comparison of Tip Blockage on the rotor TE exit plane . . . . 77
4-22 Comparison of Total Blockage on the rotor TE exit plane . . . . 78
4-23 Comparison of the pressure rise coefficient . . . . 79
4-24 Comparison of Spectral analysis of the CP difference across the rotor tip at 98% span for the FW cases . . . . 81
List of Tables
2.1 M ain stage characteristics . . . 28
2.2 Main parameters of two flow configurations . . . 29
2.3 Design parameters of the GE LSRC . . . 31
2.4 Mean flow parameters of all computed cases . . . 34
2.5 Comparison of the main Timescales . . . 35
2.6 Value of parameters for wake generation . . . 38
4.1 Frequencies and reduced frequency of all computed FWi cases . . . 76
4.2 Comparison of tip vortex mass flow ratio and Force coefficient computed from 68% to 100% span of the blade surface . . . 79
Nomenclature
Symbols
Pt Stagnation Pressure Ps Static Pressure
p density
Uti, Rotation velocity at rotor tip
U,ing Axial component of time mean velocity at inlet boundary
Xb subscript b refers the rotor inlet value of physical quantity X
Xc subscript c refers the rotor exit value of physical quantity X
Xd subscript d refers the rotor-stator exit value of physical quantity X
S Entropy normalized by specific heat at constant pressure
Chords or C., projection of the (usually rotor) chord on the axial compressor direction
Cp Pressure coefficient are expressed using axial velocity U,,infg, thus making them independent
from the reference frame
Fj Frequency defined by Uxin
ACp,- Static pressure rise coefficient
Acronyms
LE Leading Edge TE Trailing Edge PS Pressure Surface SS Suction Surface TV Tip VortexCT Convecting time. Time period for a particule to proceed from the inlet plane to the exit plane
NW Refer to the computation case with a uniform inlet flow (No Wake) SW Refer to the computation case with incoming wakes (Steady Wake)
FWi Refer to the computation cases with a inlet flow containing Fluctuating Wakes. When specified, this acronym might represent the frequency of the wake fluctuation.
RSNW Refer to the computation case with a uniform inlet flow in a complete Rotor-Stator stage (Rotor-Stator No Wake)
TVF Frequency of the spontaneous 'oscillation' of the tip vortex observed in the baseline case NW
LVCF Frequency of motion of the tip vortex core. freq(s). frequency(ies)
Chapter 1
Introduction
1.1
Background and Previous Work
High Cycle Fatigue failure in gas turbine engines has a significant cost for the US Air Force and Commercial Airline operations. The increased part inventory and frequency of inspection pro-cedures, as well as the inevitable number of related accidents , imply that HCF still constitutes a major technical challenge. One of the key elements to the understanding of these phenomena and the elaboration of preventive designs is structural dynamic loading of blades. Through modern techniques, frequencies and mode shapes are found and classified as one or both of the two classes of excitation: forced vibration and flutter. In gas turbine engines, forced vibra-tion resonance points are determined by the Campbell diagram shown in Figure 1-1 , where the ordinate is frequency and the abscissa is engine rotation rate. The intersection of the n per revolution line with the modal frequency line determines potential resonance conditions for forced response. The designer's aim is to avoid or minimize intersections in the engine operating range and plan for damping to the blades when necessary. In many cases however aerodynamic
forcing functions are acknowledged not to be well-predicted nor quantified [28].
As a primary source of excitation of blades, unsteady aerodynamic phenomena appear to be a key element to the prediction of HCF. That air loads are unsteady is well-known and inherent to turbomachines, but discussions at a AFOSR workshop in 1995 [28] emphasize that it remains unclear if all excitation mechanisms have been identified.
The complexity of the flow features in modern, high performance multistage compressors raises the following critical issue: What key physical flow effects must be included in an
ana-700 2
600-speed-r p m
Figure 1-1: Typical Campbell Diagram
lytical/computational model in order to obtain a useful and adequate prediction of unsteady load?
Specific flow situations, formerly considered as secondary, are now being examined for their potential aeromechanical consequences:
* Unsteady Flow separation 3
Multi-stage interference
* Tip Vortices in a multi-row environment
The general idea behind multi-stage interference studies is that limited interactions between adjacent bladerows, under appropriate conditions, could lead to a broadening in the frequency band of unsteadiness which might induce significant blade excitations beyond the adjacent blade rows . If this can be shown to be the case, then there is a need to consider the effect of unsteadi-ness and additional frequencies not only local to a group of adjacent blades but also in other blade rows. The research activity on this broad topic appears to have increased considerably in recent years [18, 24, 4] with computational, analytical [3, 27] as well as experimental [19, 26]
programs. Many other references could be cited here, a good part of which are focused on the development of computational methods particularly suited to address such problems.
Most of the compressor tip clearance flow research that have been carried out were focused on its impact on compressor performance measured in terms of efficiency [2, 11, 8], pressure rise and instability onset [1, 25]. However, its effects on blade forced response have not been examined on a quantitative basis. As mentioned above reliability of turbine engines is nevertheless critical and the studies of tip vortices in the context of multi-stage environment and their impact on blade excitation need to be delineated.
In recent years, experiments have shown the existence of inherent instabilities in compressors under stable operating conditions where compressor instability is not to be expected. This phenomenon, observed in low-speed and high-speed axial compressors as well as centrifugal fans, is believed to be distinct from stall inception and is often referred to as Rotating Instability (RI) by Mailach and al.[13]. It has also been observed in experiments in different axial fans by Mongeau [16], Mdrz and al. [14, 15]. It is believed the tip vortex plays a role in its cause, though the mechanism remain unclear. Mirz [14] presumed the periodical interaction of the blade tip vortex with the tip flow of the neighboring blade to be the origin of RIs. More recently, Mailach's experimental observations have shown that periodical interactions of the tip vortex of one blade with the flow at the adjacent blade might indeed be responsible for the generation of RIs. J. Bae [1] has also observed similar large band low-frequency tip flow unsteadiness for large tip clearance gap; he hypothesized that the unsteadiness is associated with the Crow-like instability of the tip vortex and its image in analogy with the pair of trailing vortices downstream of a wing.
In addition to the experimental observations, there have been recent numerical investigations which show the presence of an unexpected spontaneous unsteadiness in the tip flow region. Graf [8] observed such oscillations in the tip vortex pulsing at a 0.5 blade rotating frequency.
Vo [25] during the course of investigating the causal link between tip clearance flow and compressor stall inception, has observed oscillations in the tip flow field for tip clearance gap greater than 2% span. The amplitude of tip vortex periodic (asynchronous) oscillation was noted to increase with the tip clearance size and with increasing stage loading. The frequency was found to decrease with decreasing flow coefficient ( 0.37*BPF at flow coefficient of around 0.4 ). The total-to-static pressure rise oscillations near casing could be as large as 10%. Very
early in our numerical investigation, such phenomenon was noted as well, and we chose to focus part of our effort in assessing it.
1.2
Goals and Content of the Thesis
The overall goal of this thesis is to assess and quantify, using computational methods, the role of tip clearance vortices and wakes in forced excitation in the context of interaction with other downstream and upstream sources of unsteadiness representative of a multistage compressor.
Our specific research objectives are as follows:
* Determine the phenomena responsible for and the conditions under which there could be potential transmission and amplification of unexpected unsteadiness across an embedded compressor blade row (rotor or stator).
* Delineate the conditions under which the rotor tip leakage unsteadiness (either self-induced or in its interactions with upstream and downstream perturbations) can lead to blade excitation of aeromechanical consequence.
* Provide design guidelines
To accomplish these objectives, the following research questions need to be addressed:
- What are the conditions under which an amplification of unexpected frequencies
down-stream of a bladerow can be expected when it is subjected to an unsteady incoming flow such as moving wakes and vortices?
- Could one demonstrate, via numerical simulations, the inherent flow unsteadiness
associ-ated with tip vortex that has been observed in the experiments?
- What is the physical origin of self-induced tip vortex unsteadiness?
- What impact do incoming wakes have on this tip unsteadiness?
- Could a wake fluctuation (a third excitation into the system) tuned to match the tip
vortex frequency (TVF) exacerbate the impact of TVF on flow characteristics and blade excitation, hence leading to a resonant situation?
- How does the amplitude of pressure field perturbation on the rotor blade surface due to a downstream stator compare to other convected unsteadinesses?
- Based on our findings, what improvements can be made to the design as well as the tools employed for the design of compressors?
- What aspect of this research need further investigation?
1.3
Contributions
The key contributions of this thesis can be summarized as follows:
" The tip vortex inherent instability is identified and the associated blade excitation is
found to have a frequency of 0.45 Blade Passing Frequency. Its interaction with other inlet disturbances such as unsteady wakes are found to play a critical role in the broadening and selective amplification of the spectrum of wakes. The frequency and structural content of the tip flow region are also described; the interface separating the low-momentum tip region from the core flow exhibits a wave-like oscillation which proceeds downstream at a velocity of 0.42 times the core flow velocity at a reduced frequency (based on blade chord and throughflow velocity) of 0.7 (0.45 Blade Passing Frequency). The tip vortex core also exhibits a periodical motion at a frequency of 1.15 BPF. It has been observed that the tip vortical structure is definable in the first 40% chord. Beyond that point, the tip region is
a region of low-momentum flow.
* When the upstream incoming wakes are fluctuating in strength at a frequency/frequencies other than blade passing frequency and tip vortex instability frequency (in rotor blade rows), new high frequencies - resulting from the mutual modulation of distinct distur-bances - can be generated and transmitted downstream within the generated wakes. In both stator and rotor blade rows, it is found that the distinct frequencies independent disturbances can under appropriate conditions exacerbate the resulting interactions. This has the implication that the influence of unsteady wakes can persist throughout the com-pressor stages.
" When the fluctuation frequency of incoming wakes equals the tip flow instability frequency,
presently attributed to the fact that the spatial modal structure of the specified wake is different from that of the tip vortex instability.
Technical contributions are:
- a full-featured modular user-friendly post-processor has been developed, allowing easy and
unlimited analysis to be made from data files produced by J. D. Denton's UNSTREST. This software has been developed using Matlab's APIs and with the investigation of unsteady flow field in mind. It incorporates state-of-the-art data analysis, FFTs and wavelets tools. This effort comprises more than 25000 lines of code and a complete documentation of the data structures used. It is thought to be a very good basis for future investigation.
- through the extensive use of power-spectrum analysis, we have paved the way to an improved consideration of unsteadiness through dual-spectral representations.
1.4
Thesis Organization
The thesis is organized as follows. The overall approach, the numerical tools and the various computations that have been carried out to address the above research questions are described in Chapter 2. Chapter 3 presents the key results from post processing of unsteady computed flow fields in a Stator blade row. Chapter 4 presents the results computed in the case of an isolated rotor subjected to an incoming uniform flow, wakes steady in stator frame and wakes that are unsteady in the stator frames with a range of frequencies different from blade passing frequencies. An unsteady computation of a rotor-stator stage with a uniform inlet flow is also presented. Finally, conclusions and recommendations for future work are given in Chapter 5.
Chapter 2
Approach and Numerical Tools
In this chapter, the flow interactions in multistage compressor is discussed. After delineating the global issues of studying such a system, a strategy of investigation using numerical simulations that focus on a single stage is presented. This stage is subjected to four distinct excitations, which may interact with each other and whose effects will be investigated. These excitations are incoming wakes, fluctuations embedded in wakes, excitation of internal origin - such as tip vortex flow instabilities - and non-uniform pressure field from a downstream blade row. Simulations have been carried out on a stator, a rotor and a rotor-stator stage. The last two sections of this chapter are dedicated to describing each of the numerical setups.
2.1
A Representation of Interaction in Multi-blade Rows Using
a Stator-Rotor-Stator Group
In this section, we present the overall problem of inter-blade-row interactions and some of the methods that are used or could be used to investigate the potential impact of coupling in blade-row on aerodynamics and blade excitations. Simulating flow in a multi-stage compressor is a huge computational exercise and as our focus is on carrying specific useful calculations to answer the research questions posed in Chapter 1, a way to decompose the multi-stage problem into single stage configurations is needed. For that purpose, a modular approach is introduced, and one of these modules -a single stage or more appropriately a stator-rotor-stator group -is chosen as the configuration of investigation. How it would fit into a complete model for further investigation is then discussed. Finally, the methodology is described.
BLADE CORNER - BOUNDARY
WAKES VORTEX LAYER
Figure 2-1: The possible range of possible phenomena in a compressor blade row
2.1.1 The added effect of stage interactions
In a single compressor blade row, a wide range of flow phenomena can be encountered as sketched in Figure 2-1 . In an unsteady multi-blade-rows environment, the complexity of the flow field is likely to be much greater due to the multiple interactions between bladerows. Numerous analytical studies of stage interference can be carried out using simplified model of blades, such as lifting lines or using 2D linearized equations; a good number of this analytical approaches can be found in Rao [18]. In such cases, despite a voluntarily oversimplified repre-sentation of each blade row, the complexity of the analytical problems has been found to grow dramatically with the number of stage considered.
We can illustrate the potential complexity via the following thought experiment. Consider a bladerow exposed to a steady inlet flow. This blade row generates unsteadiness (e.g. in wakes, tip clearance flow, etc.) which interact with the immediate downstream blade row. Likewise the downstream blade can also be expected to influence the flow in the upstream blade row. Unless there exists some mechanisms to damp out the generated unsteadiness, the blade row beyond the first two would be anticipated to be subjected to the flow unsteadiness generated in the upstream blade rows.
- While the influence of a remote blade row would likely be small compared to that of the adjacent blade rows, can it be negligible?
- Could a designer reasonably think that the first rotor, under normal operational
condi-tions, has no relevant effect on the performance and reliability of, for instance, the eighth compressor stage?
A way to synthesize the interactions phenomena in a multistage compressor is to think of them as a modular serial system very much like an electrical engineering problem. This approach is summarized in the next section.
2.1.2 Control-Module paradigm
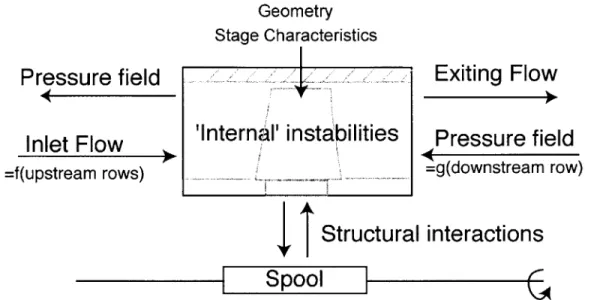
One could consider a blade row to be a module, which transforms an input (the inlet flow) into an output (exiting flow -downstream) following a transfer function which depends on the geometry of the blade row, the input and some internal oscillator - a flow instability such as that the tip leakage vortex may produce. It is also influenced by a feedback branch coming from the downstream module, the same way it back-influences the upstream module and so forth ...
Figure 2-2 presents a conceptual view of what such a modular model could look like. As mentioned previously, such analytical studies are possible because the Fi transformation functions are usually taken to be simple. Hence the actual aeromechanical phenomena taking place in blade passages are represented by the Fi functions. Once those functions are known the analysis then only focuses on the inter-blade-row interactions themselves. For instance, in a simplified inviscid approach, the F functions might be linear and the module transformation involves a simple transfer matrix as shown in equation 2.1.
U 3 x 3 transfer matrix
U
L
= dependent upon .L
(2.1)I
the description of the flow fieldi
where U,
p,
T are non dimensionalized disturbances of velocity, density and temperaturerespectively. With L independent variables, a serie of k modules is thus associated with Lk + L variables and a stability analysis can then be applied to the whole systems to investigate the
(i-1
(i+
(+1
F
i(gi)
gi
F +i(g+i)
gi+1
FB
F i+
I+,i= e
5;(Geometry,Ii,FBi.1(gi+1),Oi)
gi=
gi(Geometry,IL,FBi+
1(gi+
1),Oi)
Figure 2-2: A feedback control analysis of blade rows interactions in a compressor
possibility of system instabilities.
As for a control approach, module characteristics can also be expressed in terms of state variables. A more refined description of the flow field through a blade row might give a nonlinear system of equations which might not be solvable analytically but the overall concept remains the same. Such approaches have been partly discussed in [18, 27].
This is what we could call a control-like approach, in reference to electrical engineering methods to deal with intricately systems. It is not intended to try to force the complex Navier-Stokes equations into a over-simplified approach, but just to organize the way bladerows in-teract, hence focusing on information fluxes - the frequency content for instance - and their transmission between modules.
Consequently, the nature of the information transmitted from one module to other ones and how it relates to the physical reality in a compressor is also a critical question. Since we are mainly interested in the disturbances in the flow field, one might consider to think in terms of power spectrum content instead of physical values, using tools based on wave-number-frequency space instead of physical time space.
For the long term, our primary purpose is to create a low order-model using the concepts described above. A low order model of this nature would necessitate a clear understanding
Geometry
Stage Characteristics
Pressure field
Exiting Flow
Inlet
Flow
'Internal' instabilities
Pressure field
=f(upstream rows)
=g(downstream row)
Structural interactions
--- __Spool
|1
Figure 2-3: A single stage and its connections to the entire compressor
of what might happen in each 'module' - namely compressor stage - thus, our numerical in-vestigation was focused on a single stage and the unsteadiness sources it might be exposed to.
2.1.3 Environment of a single Rotor-Stator stage
Using the GE/NASA E3 geometry and two different codes for 2D and 3D computations (see sections 2.3 and 2.4), we have focused on the behavior of an isolated stage in a simulated multistage environment.
As sketched in Figure 2-3 , a blade row - either stator or rotor - is obviously influenced by its adjacent neighbors. The downstream influence being mainly the pressure field perturbation associated with the relative motion of the following row. Besides the inlet unsteadiness, internal instabilities such that created by the tip clearance flow (see chapter 4) may bring another source of fluctuation to the system. This lead us to enumerate the unsteadiness source which we will consider in this thesis.
Sources of unsteadiness In this section, we examine the potential sources of flow unsteadi-ness.
From the inlet flow:
" vortical disturbances, such as wakes and streamwise vortices. Their influence is mainly from upstream to downstream. A wake itself may have unsteady features which could be associated with the design characteristics of the previous blade row as well as its inlet flow conditions.
* pressure field disturbance, such as that due to the presence of a downstream blade row (stator or rotor) in relative motion.
" shocks " turbulence
" acoustic waves disturbances
From the structure (something we will not cover in this study):
* shaft vibration, due to other bladerows flutter or simply natural vibration excited during functioning
Although shaft vibrations could be considered to have a negligible effect on aerodynamics, it might be the only apparent means of having distant bladerows to directly interact. In critical flight conditions close to engine stall, shaft flexion might play an important role. This is left for future investigation however.
The stage itself can also bring internal disturbances. Given the flow conditions, the stage geometry creates 'regular flow features' for a viscous turbulent flow convecting through it, as shown in Figure 2-1 . There is no source of unsteadiness in this flow unless the flow is unstable. Flow instabilities associated with specific flow features in a blade passage or blade flutter are also potential sources of unsteadiness and hence excitations. A specific situation involving the instability of tip leakage vortex is considered in this thesis.
2.2
Methodology
Time-accurate, Reynolds-averaged, Navier-Stokes simulations were carried out to obtain un-steady solutions at different operating conditions. The unun-steady response of a stator to incom-ing rotor wakes was addressed usincom-ing a set of 2D computed results obtained by Valkov [22, 23]
(A) Unsteady case
with steady incoming wakes
wakes
(B) Unsteady case
with unsteady incoming wakes w/fluctuation
S
Figure 2-4: The different cases computed on the stator blade row
for Stator B profiles of the E3 GE/NASA compressor. In his computed results, he considered (see Figure 2-4 ):
" a situation where the wake is assumed steady in the rotor frame (A)
" a situation where the wake is unsteady and whose strength fluctuates at a frequency other than the blade passing frequency (B)
These results were postprocessed to find out the difference in unsteady response of the stator subjected to wakes steady or unsteady in the rotor frame.
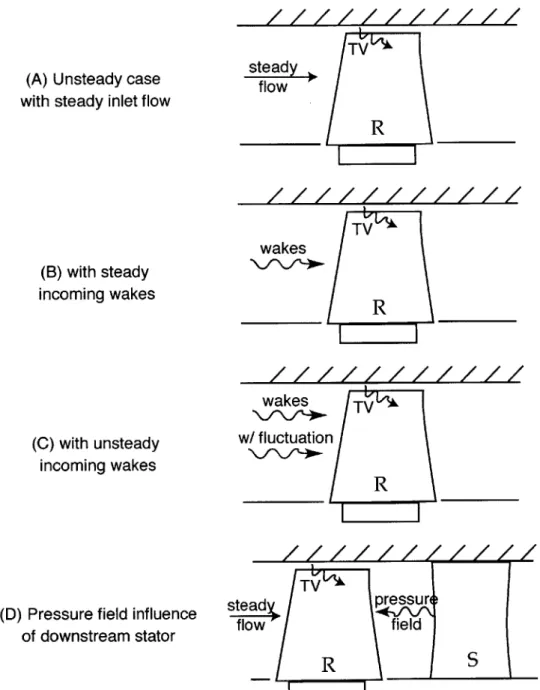
In addressing the rotor unsteady response associated with the tip clearance flow behavior, three situations were considered (see Figure 2-5 ):
* an isolated rotor where the tip leakage vortex has been hypothesized to exhibit a self-induced instability (A)
e the interaction of a rotor with incoming stator wakes for determining the response of tip clearance flow (hence the resulting unsteady rotor blade response) to variation in the
frequency of the stator wake fluctuation (B,C)
wakes
* an isolated rotor-stator stage for determining the influence of the downstream stator on the rotor excitation (D)
UNSTREST code [5] was used to implement a set of unsteady 3-D simulations that enable us to determine the role of the self-induced tip vortex instability, the unsteady wake-tip vortex interaction and of the downstream stator in the unsteady response of the rotor embedded in a multi-blade row environment. The rotor configuration was that of the stage-B E3 GE/NASA compressor with a tip gap of 3% span. Such a fairly large tip gap was chosen to enhance the effect of the tip clearance flow.
All results for the rotor and stator have been analyzed with the followings in mind:
- an understanding of flow mechanisms involved in the phenomena observed
- assessment of the aeromechanical excitation of blades
- a synthesis of results for evaluating their potential integration in the future development of a low order model of multi-stage interference.
2.3
Stator simulations
As noted previously, these computations were carried out by Valkov and the readers are strongly invited to refer to Valkov's masters and doctoral thesis for further information [22] and [23]. Contrary to other computations referred to in this study, Valkov's computation were taken 'as is' with no modification of any sort from our part. Therefore we will thus remain brief and provide a concise description of those simulations.
A wide set of simulations have been carried out in 2D as well as in a 3D rectilinear stator cascade on the geometry of Stage VII of the NASA/GE E3 compressor at design point and at higher loading (near stall). The cascade consists of an extruded mid-span profile of Stage VII stator. The results were post-processed to investigate the effect of upstream vortical distur-bances such as wakes, tip vortex and streamwise vortices on the resulting excitation of blades (in contrast to Valkov's study which focused on time-average performance).
(A) Unsteady case
with steady inlet flow
(B) with steady
incoming wakes
(C) with unsteady
incoming wakes
(D) Pressure field influence
of downstream stator
TV
steady.f low
TVwakes
wakes
TV
w/ fluctuation
R
TV
steady rsu f low -fieldR
II
Table 2.1: Main stage characteristics 2.3.1 Presentation of the code
The computational procedure is based upon a spectral element method which can be considered as a hybrid method of a finite element method (Girault 1986, Hirsch 1988 [6, 9]) and a fully spectral method (Gottlieb and Orszag,1977 [7]). This method divides the computational domain into a number of regularly-sized regions. A high-order expansion of the flow field within each region is carried out, thus achieving both geometric flexibility and high accuracy. The base algorithm was developed at MIT by Patera (1984) and Korczak (1985) [17, 12] for 2D laminar flows. It has since been modified to allow the representation of turbulent unsteady 3D flows until the mid 90's (Renaud 1991, Valkov 92 [20, 22]). The 3D code consists of a spanwise eigenvalue decomposition allowing the representation of 3D internal flows as a series of independent two-dimensional problems in modal space. The code uses a modified Baldwin-Lomax model of turbulence. The mesh is H-structured and each element contains 7*7 nodes.
All the results were from single passage calculations, both for the 2D situation and for the 3D rectilinear cascade setup.
2.3.2 Geometries and Flow Conditions
The geometry is an "Aerodynamically scaled" model of Stage VII of the NASA/GE E3, 23:1
pressure ratio compressor -Low Speed Research Compressor (LSRC) .Aerodynamically scaled meaning that the simulated model tend to reproduce the flow conditions in the row but at lower speed (see reftabtab:stagecharacteristics)
The tip vortex strength was chosen to correspond to a 3% tip clearance as opposed to the actual 1.8% of E3.
Simulated Stator Stage VII high-speed Stator
Inlet Mach Number 0.11 0.55
Reynolds 247000 N/A Stage Reaction 63% 68% Hub/Tip Ratio 0.85 0.89 Solidity 1.67 1.67 Aspect Ratio 1.34 1.37 Stagger 32 N/A
Table 2.2: Main parameters of two flow configurations
Two operating points were simulated: design point and a high-loading point.
The axial spacing was also implicitly represented by the amplitude of the velocity defect in the wake; it has been chosen in the range of 0.07 to 0.37 chord. This reduced spacing is aimed at exacerbating the effects of the incoming disturbances. The domain inlet boundary is 0.185 chord upstream of the leading edge, the rotor-stator blade count ratio has been chosen equal to 1:1.
2.3.3 Input Flow - Boundary conditions
This section describe how wakes, tip vortex and streamwise vortex have been simulated as moving velocity disturbances superposed upon the steady flow on the inlet boundary of the
computational domain.
Wakes
The upstream wakes are represented by a symmetric two-dimensional Gaussian profiles of ve-locity defect in the rotor frame. For the sake of simplicity, the veve-locity defect has no radial component and the velocity defect Au is chosen to be parallel to the overall flow direction in the rotor frame. The stagnation pressure depends on an amplitude parameter Ad and a width parameter w:
Pt = P.,nif - (1 - Ad -exp(- ( 2-Y Y) )) (2.2)
w
where Yr is the tangential position of the maximum defect, w controls the width of the wake, Ad is the relative amplitude of fluctuation, Purtif is stagnation pressure of the uniform flow and
Design Point High-loading point
Flow coeff. 0.45 0.38
Stage pressure coeff. 0.65 0.73
Stage inlet air angle 46 50.7
Stage exit air angle 21 N/A
Pt is the stagnation pressure including the wake defect
The fluctuation of the amplitude parameter Af has a monochromatic form:
t
Af =1 + Aamp * sin(27r - T ) (2.3) Tfluct
where Tfljct and Aamp are the period of the fluctuation and relative amplitude of fluctuation respectively.
2.4
Rotor 3D simulations
2.4.1 Numerical code
Time-accurate computations have been carried out using UNSTREST, developed by Denton of Cambridge University. It is a second-order code which makes use of a distributed body force to simulate viscous effects. UNSTREST uses a simple mixing length turbulence model. A value of 0.05 mid-span pitch has been chosen for all blade rows, in accordance with the value chosen by Vo [25]. The exact value is not important since our investigation is focused on trends and unsteady forced response. However, in Figure 2-7 we can note that our computations are in accord with the experimental measurements by Silkowski [21]. The compactness of the code enables efficient computations, hence allowing us to carry out unsteady three dimensional simulations with a refined mesh size on multiple single-passage stage using personal computers. On a 1.2 GHz AMD Athlon PC, a typical generation of unsteady solutions took of the order of several days.
2.4.2 Implementation of blade row geometry
The Rotor/Stator B stage of GE E3 has been used as the primary geometry of our investigation. It had been observed (appendix D of Vo's thesis) that large oscillations occurred in the tip flow with maximum amplitude around a tip clearance of 3%. The frequency and the extent of these oscillations have been determined to be due to a numerical artifact (Vo [25]) but to some interaction of the tip clearance flow with the main core flow.
A duct was used upstream of the rotor stage to generate the incoming wakes. This duct,
Table 2.3: Design parameters of the GE LSRC
implied by its presence and to match its inlet boundary with the trailing edge axial position of the IGV of the real E3 compressor. As explained later, the wakes generated at the inlet of the duct were set the minimal velocity within the wake is zero. This was chosen so that the inlet boundary can be interpreted as coinciding with the NGV tailing edge position.
The typical size of the meshes used is 140*50*50 for the single-passage duct-rotor configu-rations and up to 210*50*50 for the single-passage duct-rotor-stator case (see 2-6).
2.4.3 E3 blading and Flow Parameters
This section is aimed at describing the B-stage of the E3 geometry, as implemented in our computations. Operating conditions under which we chose to simulate the blade row behavior are also discussed and compared to real-world experimental tests.
Rotor/Stator B stage of the E3 compressor
Simulations have been implemented using the rotor B geometry alone. Figure 2-6 shows
different views and perspectives of the geometry, the shape of the domain and the grid mesh. The geometry data has been provided by B.F. Beacher of GE company.
The main geometrical parameters are summarized in Table 2.3 . For sake of simplicity, a 1 to 1 blade ratio has been chosen between IGV and and rotor. Ducts generating wakes have thus the same pitch periodicity as rotor passages. For the complete rotor-stator implementation, a 54:74 has been kept has it is critical to identify the pressure field effect of downstream stator on the rotor excitation, the tip vortex behavior and the associated frequencies.
Parameter IGV
[
Rotor B[
Stator BNumber of blades 110 54 74
Stagger Angle (deg) 10 50 40 Solidity (mid-span) 1.4 1.16 1.43 Hub-to-tip ratio 0.85 0.85 0.85
-Casing
1#40
-
K
(b)
-Rotor Blade T p -Trailing Edge Pressure Surface Tip Leading Edge Hub-(e)
LE DuctFigure 2-6: Overview of the grid used for E3 B rotor geometry. (a) shows an axial cut of the grid in the vicinity of the tip gap; (b,c) show the shape of rotor blades; (d) shows an entire axial cut of the grid; (e) is a perspective of a radial cut of the single-passage grid with duct and rotor bladerow
Suction Surface
Details on the different computed configurations
In all cases, the inlet flow was predefined to match the expected total pressure, stagnation
temperature, flow angle and meridional pitch angle at exit of E3 IGVs. Static backpressure
near casing at exit of each bladerow -rotor (and stator if applicable)- is then set as a requirement. The program then precalculates an estimate backpressure distribution at exit of each blade row from the value at casing through a radial equilibrium approximate equation. This pressure distributions are used to generate an initial conditions to allow the advancement of unsteady Navier-Stokes equations forward in time.
The cases considered are the followings:
" Duct-Rotor with no wake (NW) " Duct-Rotor with steady wake (SW)
" Duct-Rotor with fluctuating wake (FW1,FW2, FW3, FW4)
* Duct-Rotor-Stator with no incoming wake (RSNW)
In RSNW case, stator backpressure was chosen so that the flow coefficient and rotor back-pressure could match the rotor-only NW case. Again, the inlet flow was designed to be the same.
Peter D. Silkowski [21] carried out a series of experiments on GE/NASA E3 LSRC, providing pressure rise characteristics for the B stage with a tip clearance Gap/Span of 3.1%. We have used this characteristics graph as a basis to determine how our various numerical computations compare. Figure 2-7 shows this comparison.
These experiments provide data on the entire stage and it has been necessary to estimate the expected stagnation to static pressure rise coefficient for the rotor-only computations. This estimation process is detailed in the Appendix A.1. As shown, these estimates are in accord with the experimental data. NW is slightly above the measured characteristic, this could be due to our omission of the IGV wakes. SW on the contrary is under the experimental curve, which suggest that the stronger wakes created slightly overcompensate the lower solidity of our simulated IGV (54 blades versus 110 in the actual case). We also note the significantly lower flow coefficient of the FWi cases compared to NW, due to the velocity defect implied by the wakes themselves. One of our main preoccupations was to ensure that all FWi and SW have
0 36 Experimental - *SW DP ** stage characteristics 0 34f og - FW2* 0 32 FW4 03 0261 FW3 NW
~024
K
O 1s DP: Design point at nominal tip gap036 037 038 0,39 04 041 0 4? 043 044
How Coeflaert
Figure 2-7: StageB Characteristic of E3 with 3% tip gap from [21]. Our computation mean estimates are shown as circles (see Appendix A.1 for details)
comparable inlet flow conditions, so that any performance difference would reflect the impact of dynamic effects such as resonance between FW and TV. The mean operating points (see Appendix A.1) suggest that they appear to agree on the average.
Table 2.4 shows the principal flow parameters of each of the computed cases.
For information, the Reynolds number calculated in the rotor frame using the axial projec-tion of chord as the length reference, is 4.5e5. SW is chosen as a baseline case for comparisons the FW cases with unsteady wakes in the stator frame. One may also note that performance comparison between SW and NW are not possible because operating points are very different
Parameters NW SW I FW1 I FW2 I FW3 IFW4 RSNW Flow Coefficient 0.424 0.394 0.405 0.396 0.39 0.404 -PsPt coeff. Est. 0.244 0.302 0.298 0.298 0.299 0.298 -Corrected DeltaP 0.3 0.282 0.312 0.284 0.272 0.309 -Fluctuation Freq.(BP) - - 0.435 1 0.37 0.625 -Fluct. freq(Ff) - - 0.69 1.584 0.586 0.99 -Pt. 1.099 1.1015 1.1012 1.0976 1.1036 1.103 -Pth I _ _ I _ __ I _ __ __ I__ _ _ _ _
Cv
100 101 102
10
3BP 104 10, 106 10 F(Hz)Figure 2-8: Comparison of the time scales involved in our computations
Timescale Frequency Period Acronyms
Acoustic
axial 2500 Hz 0.4 ms Acx
circumferential(casing) > 3700Hz < 0.27ms Acy
radial 2900 Hz 0.35 ms Acz
Convective freq 1130 Hz 0.88 Cv
Blade Passing (wake from PS-ZSS) 2000 Hz 0.5 ms BP
Rotation 2000 Hz 0.5 ms Rot
Sampling rate 70.35 KHz 14.214 microsecs SR
Time-stepping 3.87 MHz 0.2584 microsecs IR
Table 2.5: Comparison of the main Timescales
due to the (or lack of) wakes. Our investigation on Wake-tip vortex interaction is thus centered around a spectral analysis of flow characteristics and blade excitation.
Time scales comparison
A summary of the typical timescales involved in our computations is shown in Table 2.5 . The
acoustic time scales were estimated using the domain length of each dimension divided by the estimated average sound speed along this direction. The circumferential frequency is evaluated at casing (lower limit for the expected time period). All of them are graphically compared in Figure 2-8 . We note that the acoustic frequencies are significantly higher than the range of frequencies of interest - basically BP and lower - in our study. This is a guarantee that they will not interfere in our interpretation of the numerical results. One may also note the sampling rate and time-stepping several order of magnitude higher . Sampling errors are not likely to be an issue.
Long-term
Converge Converge Divergence
Steady solution Oscillations observed (numerical?) Divergence
I I I I
-1013 1028 1042 1045 Psc (hPa)
Figure 2-9: Numerical Convergence of the B-Rotor of E3 with a 3% tip gap
Of note is the rotation timescale equal to BP scale due to our choice of equal blade count
in IGV and Rotor time-step.
The operating point has been chosen so that the case with no incoming wake is near de-sign but exhibits a large spontaneously unsteady tip flow. Observations from Vu [25] with
UNSTREST on the same rotor geometry have been used as a basis to make this choice. He
computed a range of different operating points and tip gaps with an unperturbed inlet flow and noted the presence and qualitative strength of self-induced unsteadiness in the tip flow region.
A tip clearance of 3% span has been selected. This value also appeared to be the threshold
minimal value beyond which the computed self-induced oscillation had a significant amplitude. For this clearance, numerous calculations, each corresponding to a different backpressure as shown in Figure 2-9 , This set of computations essentially cover a wide range of operating points, from high corrected mass flow (extreme left of Figure 2-9 ), to low corrected mass flow (extrame right of Figure 2-9 , stalling), and in each computed flowfield the tip vortex exhibits a self-induced unsteadiness.
The case with a flow coefficient of 0.424 (design value is 0.405 [21]) was chosen as baseline for unsteady computations. The flow coefficient is 0.424, as opposed to 0.405 at design point
[21].
2.4.4 Wakes
A detailed description of boundary conditions implemented by UNSTREST can be found in J. Denton's manual for UNSTREST. Most of the work from our part on this topic has been
In order to simulate wakes created by stator blades, a duct has been put upstream to the rotor, the end walls in the duct are fixed in the absolute frame. At the inlet boundary of this duct the wake is created at a fixed position, its properties changing with time if necessary. It is simulated by superposing a stagnation pressure defect over the baseline uniform boundary conditions. The fluctuation introduced in the wakes are additional defects that add up to the mean defect. The purpose is to have the same mean properties for all wakes -steady or unsteady. Figure 2-7 confirms that we have succeeded in having comparable time-average loading of the rotor stage.
It depends on an amplitude parameter Ad and a width parameter w is of the following form:
Pt = Puif (1 - AfPc exp(-( 2 - ( Yc))2 (2.4)
w
where Af is the main parameter that set the relative amplitude of defect. It has a monochro-matic form:
Af = 1+ Pamp - sin(27r.
)
(2.5)Tfluct
Hence, the shape of the wakes are set by 5 parameters: Pc is the norm of the mean stagnation pressure defect
ye is the circumferential position of the maximum defect, it remains constant with time.
w controls the width of the wake 2.4 Pamp is relative amplitude of fluctuation Tfluct is the period of fluctuation
The values used for the generation of wakes in the various cases computed are given in Table 2.6 .
In the case of fluctuating wakes, the Pt defect has been chosen so that the maximum defect implies a zero velocity point (see eqn.2.4). Hence, the point of maximum defect simulate the position of the Trailing edge of the IGVs of the E3 compressor.
This wake convects through the duct to the interface between the steady duct and the rotating grid of the rotor. The proper transmission of the wakes through this interface was
Parameters INW_[ SW FW1 FW2 IFW3 FW4 [RSNW PC 0 0.08 0.08 0.08 0.08 0.08 0 yc(m) 0.045 0.045 0.045 0.045 0.045 0.045 0.045 w 0.005 0.005 0.005 0.005 0.005 0.005 0.005 Pamp 0 0 0.5 0.5 0.5 0.5 0 Tfluct(sec) 0 0 0.001148 0.0005 0.00135 0.0008 0
Table 2.6: Value of parameters for wake generation
an issue that has required modifications to the grid resolution and and to the mesh generation procedure in order to avoid an unwanted diffusion.
The upstream wakes are again represented by a symmetric two-dimensional Gaussian profile of stagnation pressure defect in the stator frame.
The velocity defect Au induced by the stagnation pressure defect is parallel to the overall flow direction in the absolute frame. In other words, the velocity defect has no radial component.
2.5
Summary
The challenge of assessing the additional effects observed in a multi-stage axial compressor on the blade forced response of a rotor or stator due the blade-row interaction has been assessed. The difficulty of approaching the complex problem of inter-blade-row interactions using numer-ical simulations has lead us to only consider a group of stator-rotor-stator as a module of the entire system. The purpose is to simulate and analyse the interactions within the group and
evaluate from the computed results how they could be extrapolated to a multistage environ-ment. The blade forced response in a stator have been studied in two situations: the stator is subjected to a steady wake or and an unsteady wake in the rotor frame. The assessment of the blade forced response in a rotor may require that sources of unsteadiness, internal to the rotor, be accounted for. Thus, three situations have been computed: (1) a rotor is subjected to a uni-form inlet flow so that inherent source of excitation can be assessed, (2) a rotor is subjected to a steady or unsteady wakes in the stator frame, (3) a rotor-stator group is subjected a uniform inlet flow, so that the effect of the pressure field disturbance induced by the downstream stator on the rotor blade excitation could be quantified. Different codes have been used for the rotor and stator computations, their respective characteristics have been described. In all cases, the
steady or unsteady incoming wakes have been simulated. The unsteady computations have been carried out with a single passage per blade row.


![Figure 2-7: StageB Characteristic of E 3 with 3% tip gap from [21]. Our computation mean estimates are shown as circles (see Appendix A.1 for details)](https://thumb-eu.123doks.com/thumbv2/123doknet/14252121.488339/34.918.316.695.182.486/figure-stageb-characteristic-computation-estimates-circles-appendix-details.webp)
![Figure 3-1: Contour of Disturbance Vorticity Distribution Associated With The Interaction Of Stator With Upstream Wakes (Assumed Steady In Rotor Frame) Moving In The Tangential Direction [Valkov]; The Arrow Indicates The Directio](https://thumb-eu.123doks.com/thumbv2/123doknet/14252121.488339/42.918.230.715.278.749/disturbance-vorticity-distribution-associated-interaction-tangential-direction-indicates.webp)


