Série Scientifique
Scientific Series
Montréal Février 1997 97s-07
The Location of Comparative
Advantages on the Basis of
Fundamentals Only
Ce document est publié dans l’intention de rendre accessibles les résultats préliminaires de la recherche effectuée au CIRANO, afin de susciter des échanges et des suggestions. Les idées et les opinions émises sont sous l’unique responsabilité des auteurs, et ne représentent pas nécessairement les positions du CIRANO ou de ses partenaires.
This paper presents preliminary research carried out at CIRANO and aims to encourage discussion and comment. The observations and viewpoints expressed are the sole responsibility of the authors. They do not necessarily represent positions of CIRANO or its partners. CIRANO
Le CIRANO est une corporation privée à but non lucratif constituée en vertu de la Loi des compagnies du Québec. Le financement de son infrastructure et de ses activités de recherche provient des cotisations de ses organisations-membres, d’une subvention d’infrastructure du ministère de l’Industrie, du Commerce, de la Science et de la Technologie, de même que des subventions et mandats obtenus par ses équipes de recherche. La Série Scientifique est la réalisation d’une des missions que s’est données le CIRANO, soit de développer l’analyse scientifique des organisations et des comportements stratégiques.
CIRANO is a private non-profit organization incorporated under the Québec Companies Act. Its infrastructure and research activities are funded through fees paid by member organizations, an infrastructure grant from the Ministère de l’Industrie, du Commerce, de la Science et de la Technologie, and grants and research mandates obtained by its research teams. The Scientific Series fulfils one of the missions of CIRANO: to develop the scientific analysis of organizations and strategic behaviour.
Les organisations-partenaires / The Partner Organizations
•École des Hautes Études Commerciales. •École Polytechnique.
•McGill University. •Université de Montréal.
•Université du Québec à Montréal. •Université Laval.
•MEQ. •MICST. •Avenor.
•Banque Nationale du Canada. •Bell Québec.
•Fédération des caisses populaires de Montréal et de l’Ouest-du-Québec. •Hydro-Québec.
•La Caisse de dépôt et de placement du Québec. •Raymond, Chabot, Martin, Paré.
•Société d’électrolyse et de chimie Alcan Ltée. •Téléglobe Canada.
Correspondence Address: Pierre Mohnen, CIRANO, 2020 University Street, 25th floor, Montréal, Qc, *
Canada H3A 2A5 Tel: (514) 985-4018 Fax: (514) 985-4039 e-mail: mohnenp@cirano.umontreal.ca A Royal Netherlands Academy of Science senior fellowship, research awards from the Canadian Government and the Fondation de l’Université du Québec à Montréal to the first author, an FCAR grant and Tilburg University CentER support to the second author, and a SSHRC grant to both authors, are gratefully acknowledged. We thank Ronald Rioux of Statistics Canada and Carlos Meira of Eurostat for providing unpublished data and good support, and Wilfrid Ethier and seminar participants for stimulating comments and suggestions.
Tilburg University †
The Location of Comparative Advantages
on the Basis of Fundamentals Only
*
Thijs ten Raa , Pierre Mohnen† ‡ Résumé / Abstract
Nous détectons les avantages comparatifs au Canada et en Europe à partir des éléments fondamentaux d’une économie : les dotations, les technologies et les préférences. Par la programmation linéaire, en utilisant les tableaux entrée-sortie et un algorithme servant à imposer l’équilibre de la balance commerciale, nous déterminons l’allocation optimale des ressources, qui soustend les échanges optimaux. Le Canada a un avantage comparatif par rapport à l’Europe dans les minéraux, la machinerie, les vêtements et les chaussures. Les gains à l’échange sont minimes pour la grande économie, l’Europe, mais substantiels pour le petit pays, le Canada. La structure des avantages comparatifs persiste quand nous permettons le libre choix entre les technologies et les préférences des deux pays. Les dotations ressortent donc comme étant le facteur déterminant de la structure des avantages comparatifs.
We locate the comparative advantages of Canada and Europe on the basis of their fundamentals only: endowments, technologies, and preferences. A linear program with an input-output core and an algorith for the balance of payments constraint will determine the efficient allocation of resources. The supporting allocations determine the optimum pattern of trade. The Canadian advantage compared to Europe is in minerals, machines and clothing & footwear. Gains to free bilateral trade are estimated to be negligible for the big economy, Europe, but significant for the small one, Canada. The pattern of comparative advantage persists when we allowfor free access to technology and consumption coefficients and, therefore, can be ascribed to the endowments. Mots Clés : Avantages comparatifs, gains au libre-échange Keywords : Comparative advantage, Gains to free trade JEL : F10
1. Introduction
One of the basic issues in trade theory is the determination of the sources of comparative advantage and hence of trade between countries. The early theories stressed one aspect at a time (such as differences in technology in the Ricardian model and differences in endowments in the Heckscher-Ohlin model). They neutralized the other possible sources of relative domestic price differences in order to prove their argument in the most simple possible way. That is what theory should do. Then, a number of studies has tried to test the various theories (see the survey by Leamer and Levinsohn, 1994). The problem with these tests is that they are counterfactual. For instance, to test the Heckscher-Ohlin-Vanek model, Bowen, Leamer and Sveikauskas (1987) assume common technologies and common preferences and then confront actual trade data with those produced by the model. That the model is rejected should come as no surprise.
However, by using independent data on trade, endowments, and technologies, Bowen, Leamer and Sveikauskas (1987) and Trefler (1993) make a fundamental improvement over previous studies. The data are country speci- fic as regards trade and endowments, but not for technologies. The rejection of their model calls for variation of technology across countries and they do so by allowing for neutral departures from the U.S. technology. But when doing so, the existing theory has to be modified in order to conform to the new, more realistic, environment in which the test is con- ducted.
We go a step further by setting up a model of a competitive economy which allows for country-specific endowments, preferences and technologies, the fundamentals of the economy according to neoclassical theory. The gain is two-fold. First and foremost, we need no reference country for technology as in Bowen, Leamer and Sveikauskas (1987) and Trefler (1993). Second, we compute the competitive benchmark head-on, including the optimal trade figures between Europe and Canada in 1980, keeping trade with the rest of the world fixed. The choice of economies is opportunistic. Since the model is truly general equilibrium, that is based on fundamentals only and with all prices endogenous, the incorporation of the rest of the world as a third economy (or family of economies) is a straightforward extension. The obvious candidate for inclusion is the United States.
Our benchmark is the competitive trade model, based on differences in all the fundamentals. We derive the competitive benchmark for the location of comparative advantage in the two countries and for the gains to free trade from the fundamentals directly. Numerous distortions, such as monopoly power, externalities, tariffs and other impediments, drive a wedge between the hypothetical and observed patterns of trade. However, rather than trying to get a handle on these departures from the competitive benchmark, we give up the information contained in the trade statistics altogether and return to the full set of fundamental data. From a theoretical point of
view, our contribution is modest as it merely implements ideas that have been around quite some time. A reference is the theoretical introduction of Ginsburgh and Waelbroeck (1981, pp. 30-31) where they consider the maximization of consumption subject to commodity and factor input constraints. In the empirical part, however, Ginsburgh and Waelbroeck (1981, p. 176) note that such a model could not be handled with available means. We carry out the program suggested by Ginsburgh and Waelbroeck. No statistics or constructs beyond the fundamentals of the economies are used. In particular, we employ no price statistics. Nor do we admit artificial limitations on the direction of trade. The model provides a true general equilibrium determination of the commodity pattern of trade. A linear program with an input-output core and an algorithm for the balance of payments will determine the efficient allocation of activity. It is known that this approach yields a high degree of specialization. This is merely a reflection of the dimensionality of the issue. A key test for the factor-endowments approach is whether it can accommodate reality in a context simple enough (i.e. of low enough dimensionality) to be theoretically tractable. Indeed, a distinctive feature of our attempt is to determine the disaggregated pattern of comparative advantage on the basis of only a few fundamentals, namely the primitives suggested by neoclassical theory. Consequently we face many more goods than factors and specialization is natural. Unlike Krueger (1984, p. 545) suggests, this property does not depend on the input-output assumption of fixed coefficients. As a matter of fact, input substitutability would widen the scope for specialization. To avoid the latter, one must resort to brute force. In linear programming, artificial constraints are used (e.g. trade and activity restrictions as in Williams, 1978). In a neoclassical study, Diewert and Morrison (1986) assume a form of jointness of output which is conditioned by the pattern of trade and preserves it. Chipman and Tian (1992) also bar trade reversals.
As is well known, estimates of inefficiencies of trade restrictions are modest when the patterns of trade and underlying activity are taken for granted. Within a framework of goods that agrees with the observed outputs, exports, and imports, the welfare losses are given by the Harberger triangles. The size of a triangle is half the base times the height and the two are related to each other by the elasticity of demand. In short, the welfare losses are quadratic in either the price or the quantity distortion, hence small. Romer (1994) shows that gains to free trade are of a higher order if the list of goods that defines the framework of an economy is endogenous, namely the outcome of profit maximization involving fixed costs. Free trade would lengthen the list and create new areas of consumer surplus. We will show that one does not have to go as far as Romer, questioning the observed categories of goods, to suggest high welfare stakes of free trade. It suffices to endogenize the direction of trade in order to show the existence of efficiency gains of a higher order than the ones implied by Harberger calculations.
[$E&8%(1&$)E(&8]&1/8
The solution to our linear program measures the maximum possible welfare gain and identifies the comparative advantages. All market imperfections and departures from the simple perfectly competitive model are ignored when the benchmark is calculated. To the extent that the very concept of comparative advantage is grounded in the fundamentals of the economy—endowments, technology, and preferences—imperfections outside these data must be excluded indeed. An example is monopoly power. It is a behavioral distortion, independent of the fundamentals. It has an impact on the trade position of an economy, but should not codetermine its comparative advantage. The latter, by definition, results from the preferred allocation of activity subject to the fundamentals only.
Some departures from the competitive benchmark cannot be separated from the fundamentals, but are grounded in the physical structure of the economies, particularly product differentiation and scale economies. Harris (1984) builds a real trade general equilibrium model to assess trade liberalization effects. This purpose, as well as the requirement that some historical data set is produced as an equilibrium, infringe on the "pureness" of the model. The theoretical requirement that supply and demand are derived from the fundamentals of the economy is sacrificed by installing CES-"muffles" (make "Armington") at four interfaces of supply and demand (Harris, 1984, pp. 1020, 1022 and 1026). "Muffles" limit substitutability between commodities which differ by origin. These components are combined in a nonadditive formula which is minimized to determine their shares. For example, to determine exports (E for domestic and E* for all other countries exports) CES-muffle
is supposed to be "produced" at minimum cost. Exports are thus "determined" as a smooth function of domestic and foreign prices. A Cobb- Douglas version of the muffle divides intermediate demand between domestic supply and imports. One might think of goods and services supplied by different countries or industries as being differentiated not only in transportation costs, but also in terms of intrinsic product characteristics. When the purpose of study is the location of comparative advantage, however, the procedure is unnecessary and unwanted. From an econometric perspective, the evidence is no longer indirect (estimates of muffle
parameters $ and 8), but direct (observations of endowments, technology, and
preferences). A second, related difference is that we are not plagued by the need to manipulate price formation. Harris averages Chamberlainan prices with the more oligopolistic ones of Eastman-Stijkolt. Deardorff (1986) shows that this element introduces a theoretical inconsistency, but is necessary to get effects of tariff
The location of comparative advantages in a system of more than two economies would involve a 1
vector scanner, (, and a fixed point algorithm to find the value such that the consequent vector of national surpluses for all but one economies is mapped into the observed surpluses. (Walras’ law would take care of the remaining economy.)
reductions.
In our opinion, product differentiation is an aggregation phenomenon. If products are differentiated, they constitute different commodities and the efficient pattern of trade must be determined at the most disaggregated level. Upon aggregation back to the level of differentiated products, intra-industry trade emerges. Cross-hauling actually represents different commodity components at the more detailed level of classification. Scale economies are a more intrinsic phenomenon. Since the related monopoly power is a priori excluded from our model as noted above, only the scale-induced changes in technical coefficients could be relevant for the detection of comparative advantages. This effect is ignored in this study. Inclusion would reinforce the gains to free trade. It is interesting to note that we can explain significant gains to free trade without using scale economies. In principle, scale economies might change the locational pattern of comparative advantages, but we do not expect them to be that high.
2. Locating comparative advantages
Woodland (1982) develops a neoclassical model of international trade with fixed domestic endowments and with tradeable and nontradeable commodities, used for intermediate or final consumption. We make it operational by substituting Leontief functions for the technologies and preferences and, sticking to the observed proportions of final consumption and investment in the national economies. The efficient allocation of resources is obtained by maximizing the level of final consumption (including investment) in one economy, subject to a level of final consumption in the other economy. The latter, predetermined level must be such that the outcomes preserve the actual bilateral balance of payments. We will find this balanced, efficient allocation by scanning the final consumption frontier for the two economies. Thus, let c denote the level of final consumption in Europe and c the same for Canada. Italic symbols represent Canadian items. We scan the
(c,c)-frontier with the Canadian-European final consumption ratio, (, by putting
c = c(. For every ratio (, a linear program will determine the maximum level of
final consumption, c, subject to material balance and endowment constraints . Apart1
from c itself, the variables are the vectors of gross outputs, x for Europe and x for Canada. The linear program is
max
x,x,c$0 e
yyc % eyy(c subject to
Tradable commodities are those for which Statistics Canada (1983) reports data of foreign trade. 2
(1)
for tradeable commodities:
(I - A)x + (I - A)x
$
(y + y()c + z + z (2)for nontradeable commodities:
(I - A)x
$
yc , (I -A)x$
y(c (3)and for factor inputs:
kx
#
K , lx#
L , kx#
K, lx#
L (4)The expression "for (non)tradeable commodities" restricts the announced vector
inequality to the respective components . In the objective function, e = (1 ... 1).2 y
The program features the following European parameters:
y = final consumption vector (including investment, excluding trade) z = net exports vector (except for bilateral trade)
A = commodity input coefficients matrix k = capital input coefficients row vector l = labor input coefficients row vector K = capital stock
L = labor force (5)
The Canadian parameters are in italic script. For normalization of the supporting price system, we have included a positive constant in the objective function. Variable c acts as an expansion factor. The solution is not affected by the monotonic transformation of the objective function. For every value of the final consumption
frontier scanner, ( =c/c, denote the optimum (European) consumption level by c(()
and the outputs in the two countries by x(() and x((), respectively. For low values
of (, Canadian consumption is unimportant and the bulk of net output is exported to Europe. Similarly, the trade balance shows a European surplus for high values of (. European net exports to Canada are given by the vector,
S0 ' ey(x0 & Ax0 & y & z)
(n%1 '
[S((n) & S0](n&1 & [S((n&1) & S0](n S((n) & S((n&1)
(8)
(9) In a general equilibrium framework like the above, the supporting competive prices are given by the shadow prices of the linear program. Denote them,
for tradeable commodities: p(() (7)
By the dual constraint associated with the c-coefficients in (2-3), the value of final
consumption, y + y(, under the shadow prices is equal to its nominal value, the
coefficient in (1). In other words, the coefficient in the objective function has been selected such that only relative prices change. By the dual constraint associated with the x-coefficients in (2- 4), European profits are nonpositive. Similarly, by the dual constraint associated with the x-coefficients in (2-4), Canadian profits are nonpositive. Sectors with negative profits are inactive by the phenomenon of complementary slackness.
European surplus on the bilateral trade account is equal to the (inner) product of
expressions (7) and (6) and will be denoted by S((). For ( low, S(() is negative,
and for ( high, S(() is positive. For some intermediate value, S(() will match the
observed surplus on the bilateral trade account,
where x is the observed value of gross output vector x. We find the intermediate0
value of ( by the Newton-Raphson algorithm,
with initial values ( = 0 and ( = 1.0 1
The limit of process (9) solves S(() = S and is, therefore, the general equilibrium0
value of the Canadian-European final consumption expansion ratio, ( = c/c. For this
value, the linear program determines the levels, c(() and c((), the allocations, x(()
and x(() and the bilateral trade vector, (6). The sign pattern of bilateral trade locates
the comparative advantages of the two economies. Notice that this is accomplished solely on the basis of parameters (5) for Europe and similar parameters for Canada. The parameters represent taste (y), technology (A, k and l) and endowments (K and L), and fix the rest of the world (z). In other words, we have located the comparative advantages on the basis of the fundamentals of the economies, without recourse to prices. All prices are endogenous. Prices of the tradeable commodities (7) are shadow prices associated with constraint (2). The prices of the nontradeable
In fact, algorithm (9) stopped after only six iterations and the difference between the computed and 3
actual deficits was only 24 ECU, an incredibly small fraction of the deficit.
commodities, associated with constraints (3), and those of the factor inputs, associated with constraints (4), are specific to the individual economies.
By letting consumption and input proportions represent taste and technology, we made a short-cut. Strictly speaking, technology is a blue- book of techniques and the choice of techniques depends on the relative prices. The observed input-output coefficients reflect the techniques prevailing under the observed prices. Now if the prices change to the general equilibrium values, the choice of technique and hence the input- output coefficients may be different. Induced change of techniques within the technology blue-book thus prompts further reallocations of endowments and gains to specialization. The same holds for consumption: taste is a blue-book of consumption coefficients and the latter may adjust. By restricting the blue-book of technology and consumption to a single page for each economy, our model ignores the further reallocations and, therefore, the results will be conservative. Since the point of this paper is to demonstrate how endogenous patterns of productive activity create significant gains to free trade, it suffices to do so in the context of the narrow Leontief framework that underlies the above model.
3. Canadian advantages compared to Europe
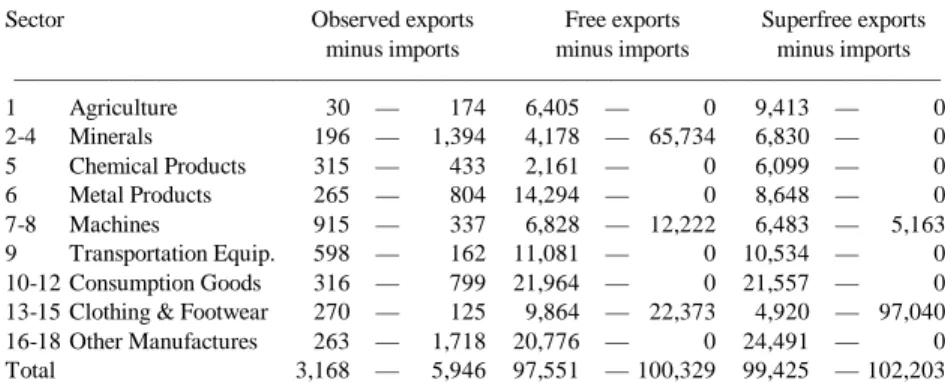
If bilateral trade were completely free and the national economies were perfectly competitive, the free trade pattern of table 1 would emerge, if we ignore the ramifications on the trade with the rest of the world. (The data and the superfree trade pattern are discussed in the appendix and in the course of this section. Ideally, the rest of the world is to be included as the third economy. The methodology remains perfectly applicable.) The first two columns of the table contrast the actual and the optimum trade figures (Statistics Canada, 1983 and equation 6). By
construction, the observed European trade deficit with Canada is the same . The3
second column reveals that the Canadian comparative advantage vis-à-vis Europe given the trade with the rest of the world rests in minerals, machines, and clothing
& footwear.
The resulting comparative advantage contrasts with observed trade (first column of table 1). In reality Canada exports chiefly minerals, metal products, consumption goods, and other manufactures, and imports machines, transportation equipment, and clothing & footwear. The endogenous comparative advantages may also conflict with intuition. For example, agricultural exports are not taken up by Canada, but by Europe. Such a discrepancy can be due to: (1) departures from free trade such as government support of farmers; (2) model limitations; (3) preconceptions. Certainly not the first explanation drives the wedge, since this distortion is less in Canada than
in Europe. The departure from free trade would not push the comparative advantage between actual agricultural trade and our model solution to the intuitive candidate, Canada. The second explanation may have some validity, since land is not modeled as a separate factor and the rest of the world is not included. The third explanation also has some sway. In fact, Canada has only a slight edge in agricultural value added per worker (10,110 versus 8,884 ECU per worker), whereas agricultural value added per unit of capital is the same in the two economies. Because of the scarcity of Canadian capital, it does not pay to exploit the mild Canadian technological edge in this sector.
Bilateral trade liberalization would multiply the volume of trade and let the small economy (Canada) specialize in only a few sectors. Note, however, that these sectors continue to feature two-way trade under perfectly competitive conditions. This is due to product differentiation. For example, in minerals the (dominant) Canadian export is in mining, but it is countered by European exports in petroleum & natural gas and non-metallic minerals. Similarly, Canadian exports of machines are countered by European electrical goods. And in clothing and footwear, Canada picks up the footwear.
The revelation of product differentiation in the phenomenon of two-way trade is limited by the level of disaggregation. In our model, where we want to determine comparative advantages on the basis of the fundamentals of the economies, we choose the most disaggregated classification of products that we could reconcile with the Eurostat and Statistics Canada production units. In this approach, footwear is footwear, be it European or Canadian. Seminar participants have suggested that Italian footwear is different from Canadian and that, therefore, trade should be two-way even at the disaggregated level. We admit that this is true in principle. However, in our opinion the only correct way of modeling this is to disaggregate the data. Our view deviates from the dominant one in the literature where product differentiation is imposed by taking into account the origin of commodities (the so called Armington assumption, Harris, 1984, and Srinivasan and Whalley, 1986). Such an imposition of two-way trade may be a practical (albeit brute force) device to obtain a good fit, but it is useless for the location of comparative advantages, particularly when they are not assumed to be revealed by the international trade statistics.
Let us give some idea of the relative importance of the determinants of comparative advantage. As is common in the literature, we will focus on the role of endowments by holding technology and taste constant across the economies. This is implemented in neoclassical fashion by assuming free access to each other's technology and, similarly, by introducing substitutability between the mean consumption vectors in either economy. The modification yields a model of free trade between economies with free access to technology in production and consumption. This so called superfree model is presented in the appendix and the consequent pattern of
superfree trade is reported in the last column of table 1. The Canadian comparative advantages in machines and clothing & footwear persist when technology differences in production and consumption are eliminated, but the minerals production is picked up by Europe. The initial conclusion is, therefore, that the Canadian comparative advantage is determined by endowments (for machines and clothing & footwear) and technology (for minerals). A qualification of the technology determinant seems in order. It turns out that Europe adopts the Canadian technology to produce minerals. The Canadian input coefficients are relatively small in this sector. Note, however, that our model does not account for natural resources separately. The Canadian abundance or quality of the ores is reflected in the level of the input coefficients. The superfree scenario, by moving this technology to Europe, sort of endows Europe with the Canadian edge in minerals. This peculiar role of input coefficients in minerals is known. Carter (1970) showed that it is the only sector where input-output developments indicate technical regress and that the underlying problem is not a deterioration of knowledge, but of the quality of the unaccounted resource. In so far the Canadian edge in mineral production is a reflection of the abundance of natural resources, the transfer of Canadian technology to Europe would not be supportable by a more detailed model. We therefore speculate that a fuller model, accounting for natural resources as a third endowment in addition to capital and labor, would ascribe the Canadian comparative advantage in minerals to the natural resource endowment, rather than technology. In short, the Canadian comparative advantage is determined by endowments.
Now let us shift attention from the product nature of trade to the factor contents. Are differences in European and Canadian factor endowment proportions leveled out by trade? We have calculated the factor contents embodied in the net trade vectors (actual, free, and superfree), see table 2. The technique is due to Leontief (1953), but now the pattern of the comparative advantage revealing trade is endogenous. The first line of table 2 shows the capital/labor endowments ratios of the two economies. (These figures are obtained by simple divisions of the data at the bottom of tables 4 and 5.) Europe is endowed with relatively much capital. The second and third lines of table 2 show agreement between the effects of observed and free trade. We focus on after trade ratios rather than exports and imports factor intensities to make the analysis Leamer (1980) proof. The capital-labor ratio in the big economy, Europe, is not affected. The capital-labor ratio of Canada deteriorates further. Obviously, the Heckscher-Ohlin theorem does not work here. There are numerous reasons for this, as pointed out by Batra and Casas (1973), Deardorff (1984), and Bowen, Leamer and Sveikauskas (1987). Perhaps the most important one is that the theorem assumes free access to technology and common preferences. Now these conditions are precisely the ones of the superfree trade scenario. Hence the last line of table 2 is a more appropriate test of the Heckscher-Ohlin theorem. The results show that with common access to technology and consumption patterns free trade
max
x ,d$0 eyy d subject to
(I & A)x $ yd % z
(11)
(12) would indeed level out factor intensity differences.
While differences in technology and consumption patterns played a minor role in the location of comparative advantages, they are important to the movements of factor contents. Because of such differences, factor intensities are leveled out neither in theory nor in practice. The observed movement, however, is in agreement with the optimal movement of factor contents between the economies with different technologies.
4. Gains to free trade
The solutions to (9) and (1-4) yield ( = c/c and c. The consequent
expansion factors for European and Canadian final consumption are
c = 1.075 and c = 1.40 (10)
respectively. Perfect competition and free bilateral trade would hence boost the European and Canadian economies by 7.5% and 40%, respectively. The difference reflects the relative importance of bilateral trade to the two economies. Gains accrue to both. Parts of the efficiency gains, however, are obtained by the elimination of the domestic waste of resources from misallocation and less than full utilization of resources. To isolate the gains to free trade, we must determine the domestic efficiency gains that the program can achieve without departing from the observed bilateral trade vector.
The domestic expansion factor for Europe, given the full net exports vector, z¯, is obtained by
kx
#
K , lx#
L (13)In italic script, this would be the domestic expansion factor program for Canada. The consequent allocations of production and consumption are feasible with respect
to the free trade program, (1-4), with ( = d/d, for the following reason. The
domestic material balances, (12), and same but in italics for Canada, sum to (2-3) because the bilateral net exports cancel out. The solutions to (11-13) and its Canadian version are
d = 1.073 and d = 1.18 (14) The bulk of the European efficiency gain can thus be ascribed to the elimination of domestic waste of capital and labor. Comparison of results (10) and (14) shows that Europe would gain only 0.2% to free trade with Canada. This underscores the insignificance of the Canadian economy to Europe. For Canada, however, the picture is different. Half of the efficiency gain of 40%, in fact 22%, can be ascribed to free trade with Europe, as seen by subtraction of the second figures of (10) and (14).
5. Conclusion
The location of comparative advantages of economies linked by international trade requires independent data of the three fundamentals: resources, technologies, and preferences. In practice, one of the ingredients is missing and the gap is filled by a neoclassical assumption. In case of a single observation, such an assumption amounts to fitting the observed trade to the comparative advantage, which is thus revealed trivially. In an econometric setting, the assumption tends to be rejected. We need no such assumption. The direction of trade is completely endogenous and comparative advantages have been located on the basis of the fundamentals only, by scanning the international consumption frontier. In one point, the supporting output allocation and the accompanying price system yield the observed bilateral balance of payments and the consequent pattern of trade locates the comparative advantages. The observed allocation is well within the frontier. The bulk of the difference can be ascribed to domestic inefficiencies. The remainder is the gain to free trade. The Canadian comparative advantage vis-à-vis Europe is in minerals, machines and clothing & footwear. The gains to free trade would be 0.2% for Europe and 22% for Canada. The pattern of comparative advantage persists when we allow for free access to technology and consumption coefficients and, therefore, can be ascribed to the endowments. This free access would alter, however, the movement of factor contents, in agreement with the Heckscher-Ohlin theorem.
Eurostat (1976, p. 162-67) uses 44 sectors in the input-output classification, and 25 sectors in the 4
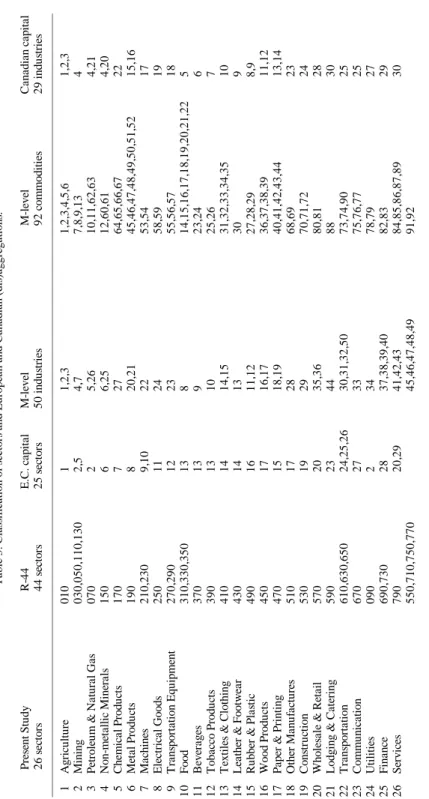
capital accounts. Statistics Canada (1987, 1990a) uses 50 industries and 92 commodities in the M-level input-output classification and 29 industries in the capital accounts. In either economy, the labor accounts follow basically the input-output classifications, slightly more aggregated. The so-called R-44 and M-level classifications have been aggregated into a common base of 26 sectors. Non-market services in Europe, which correspond to non-business activities in Canada, are treated as exogenous in this study. The labor and capital requirements in these sectors are subtracted from the local labor and capital availabilities, whereas their intermediate input requirements are treated as exogenous production requirements in each of 26 remaining sectors by inclusion in the final demand vector. The sectors are listed 1 to 26 throughout this study. These codes and the names we have assigned to the sectors are listed in the first column of table 3. The second column shows how they can be obtained by aggregating the R-44 sectors. The third column relates them to the European capital sector classification. The fourth and fifth columns show how the sectors can be obtained by aggregating the M-level industries and commodities, respectively. The sixth column relates them to the Canadian capital sector/classification. In R-25 sector 1 (agriculture), Belgium and Netherlands capital stock data are missing. The 5
capital/output ratio in the remaining countries, using Eurostat (1990) and Eurostat (1986), is 2.289. Multiplication with Belgium and Netherlands outputs yields stock estimates. Addition of the known stock of the other countries yields an estimated agriculture stock of 314457 million ECU, reported in table 5. In R-25 sectors 8, 9, 10, 11 and 12, Denmark is missing. The same procedure yields Danish stock estimates 1154.2, 1922.8, 294.0, 760.6 and 915.7 million ECU, respectively. The total Danish stock in these sectors is known, however, 7182. We have inflated the Danish stock estimates by a common factor to meet the total. For R-25 sectors 23, 28 and 29 capital stock data availability is as follows: DK FRG F B NL I UK R-25 sector 23 S X X X X 28 ; X X X 29 G X 9 X X
First, we disaggregate the French sectors 28 + 29, using the capital/output ratios of FRG + Italy + UK and deflation to meet the known total. Next, we disaggregate the Danish sectors 23 + 28 + 29, using the capital/output ratios of FRG + France + Italy + UK and a tiny inflation to meet the known total. Finally we fill the Belgium and Netherlands gaps using the capital/output ratios of Denmark + FRG + France
Appendix: Data and the superfree model
The European data base, comprising Denmark, Federal Republic of Germany, France, Belgium, the Netherlands, Italy and United Kingdom, will be presented
first . The transactions matrix and the final demand vector from Eurostat (1989)4
have been published by ten Raa and Chakraborty (1991). All output flows to the non-market services sectors (R-44 sectors 810, 850, 890, 930) are relegated to final demand. Capital stocks data were kindly released by Eurostat (1990). They are easily expressed in millions ECU, using the exchange rates given in Eurostat (1986), and reproduced in table 4. The E.C. capital accounts classification is the so-called R-25 system (see table 3). Some data are missing altogether. For others, only subtotals are available. Since the purpose is to construct sectoral capital/output coefficients, we fill data gaps by assuming that capital/output ratios in the other
+ Italy + UK. R-25 sectors 24 + 25 + 26 are treated as a conglomerate, since our own classification does not have this detail. Of the conglomerate, only the Belgium and Netherlands data are missing and estimated using the capital/output ratio from the other countries. The same holds for R-25 sector 27.
This proxy is missing for France and Italy. We fill this gap by estimating net operating surplus using 6
the net operating surplus/gross value added at market price ratio of Denmark + FRG + Belgium + Netherlands + UK and applying it to the gross value added at market prices figures of France and Italy.
Belgium data were provided to us by Eurostat (1990a). 7
Belgium shows a great reduction of market services n.e.c. in favor of classified services compared to 8
previous data. We have done the same with sectors 79 (market services n.e.c.) of the first six countries. The recipient R-44 sectors are 57 (wholesale and retail), 65 (auxiliary transport) and 69 (credit and insurance). (Unlike Belgium, sectors 55, 71 and 77 are ignored, as Eurostat (1986) input-output table has blanks only in these rows and columns.) For classification consistency, the key for the redistribution must be taken from the input-output table to be used. The only possibilities are gross value added at market prices and actual output. We have chosen the former, which are for sectors 57, 65, 69 and 79: 238019, 24432, 116606 and 108921, using Eurostat (1989). These figures include Belgium. We do not correct for this, since the classification of data across the sectors under consideration seems to vary between national accounts and the consolidated European input-output table. The shares of the first three figures are 48.78%, 5.01% and 23.90%. Applied to employment of market services n.e.c. of Denmark + FRG + France + Italy + Netherlands + UK (27851), this yields transfers of 13586, 1395 and 6656 (thousand of persons) to sectors 57, 65 and 69, respectively. Employment in the non-market services has been netted out of employment in sector 26 on the basis of their value added share of 71.16%.
transformation from R-25 to our classification involves a few aggregations and a few disaggregations. The aggregations are trivial summations. The disaggregations concern the split of the R-25 sectors 13, 14, 17 and 20 into our 10 + 11 + 12, 13 + 14, 16 + 18 and 20 + 26*, respectively, where 26* is part of 26, namely R-44 sector 55. We disaggregate by capital costs or the closest available proxy, net
operating surplus . The consequent estimates of total capital stock by our6
classification of sectors is given in table 4. Unfortunately, utilization rates are not available at sectoral levels. We have to use a macro figure and apply it to all sectors alike. The figure used in table 4 is the E.C. manufacturing capacity utilization rate from the Commission of the European Communities (1984, p. 17), 81.2%. Sectoral
labor employment figures are published by Eurostat (1986), at national levels . The7
employment data are aggregated into the R-44 classification by replacing the last
digit of a branch code by zero. A few transfers , which seem reasonable to us, and8
aggregation according to table 3, yield the sectoral employment data listed in table 4. The labor force figure, included in table 4, is the total labor force from Eurostat (1985) minus the employment in the non-market services.
The Canadian data base, involving one country only, is straight-forward. The use and make tables are directly available from Statistics Canada (1987). They relate to business activities only. Sectoral capital stock and labor employment data were
The stock of sector 26 (in the Canadian capital classification) is confidential and has been suppressed 9
by Statistics Canada (1990a).
For industries 1 and 2 at the M-level classification, we took the rate of industry 8 since the latter is its 10
main user. For industry 3, we took the weighted average of industries 16 and 18 with weights from the U -matrix of 1980. For industries 11 + 13 and 14 + 15, a weighted average of sectoral rates was computed, with weights taken from the V -matrix (industry totals). For industry 12 it was assumed to be the same as for industries 11 + 12 (i.e. plastics and rubbers). For industries 30-33 and 35-50, since the use of their output is widespread, we took the industrial utilization rate of 83.8%.
The capital funds of M-sectors 4 + 7, 5 and 6 are, respectively, 5496.1, 8026.8 and 150.2. The 11
consequent disaggregation of the utilized stock is 48152.468 + 28267.767 + 528.955 (million dollars). Adding M-sector 26 utilized stock to the middle term and M-sector 25 utilized stock to the last term, yields the reported figures.
The wage funds of M-sectors 4 + 7, 5 and 6 are, respectively, 3081.4, 1150.6 and 162.2. The consequent disaggregation of employment is 300593 = 210789 + 78703 + 11096 (thousand personhrs). Adding M-sector 26 employment to the middle term and M-M-sector 25 employment to the last term, yields 210789, 111257 and 114933. Since total employment is 10,143,535 persons, working 18090468 thousand personhours, multiplication with the ratio of the latter to the former, yields the reported labor figures.
The capital funds of M-sectors 13 and 11 are, respectively, 121.1 and 155.4. The consequent 12
disaggregation of the utilized stock is 1743.700 = 763.696 + 980.004 (million dollars). Adding M-sector 12 utilized stock to the last term, yields the reported figures.
These figures have been taken out of services by capital fund and wage fund shares. 13
These stock figures were obtained by disaggregation, using capital fund shares. 14
Lodging and catering have been subtracted. 15
kindly released by Statistics Canada (1990 and 1990a) . The capital utilization rates9
are from Government of Canada (1984) and from Bank of Canada (1983) for the10
construction sector. Disaggregations by capital funds and wage funds, respectively, yield the utilized capital and labor employment reported in table 5. The
disaggregations involve the following sectors of our classification: 2 + 3 + 4 , 1411
+ 15 (capital only) , 21 , 22 + 23 (capital only) , and 26 . We have included in12 13 14 15
table 5 the total capital stock figure computed from table 5 and the labor force figure of Statistics Canada (1989). We have also added the exchange rate to table 5, to express the capital stocks in millions ECU. The source is IMF (1985). The
commodity input coefficients matrix is given by A = UV (see Kop Jansen and ten-y
Raa, 1990; superscript -y denotes the composition of transposition and inversion,
two commuting operations), where U is the commodity by sector input matrix (use table) and V is the sector by commodity output matrix (make table). The capital and labor input coefficients row vectors are obtained in the same way by postmultiplication of the row vector of sectoral utilized capital stocks and of the row
max
x,˜x,x, ˜x,c,˜c,c$0 eyy(c% ˜c) % eyy((c % ˜c) subject to
(I& A)x % (I & A)˜x % (I & A)x % (I & A) ˜x $ yc % eyy
eyyy˜c% yc % eyy
eyyyc˜ % z % z
c% ˜c ' ((c % ˜c)
(I& A)x % (I & A)˜x $ yc % eyy eyyy˜c, (I& A)x % (I & A) ˜x $ yc % eyy
eyyy˜c
(1')
(2')
(2")
(3') The superfree trade model is obtained by the following modification of linear program (1-4).
for tradeable commodities:
~
with c determined by
for nontradeable commodities:
and for factor inputs:
~ ~
kx + kx
#
K, lx + lx#
L,~ ~
kx + kx
#
K, lx + lx#
L (4') ~European net output (I - A)x has been augmented with (I - A)x, the net output in Europe using Canadian technology. Any European gross output component is
~
generated by European or Canadian technologies with activity levels x and x ,i i
respectively. The same kind of substitutability is introduced in the consumption section. European consumers are assumed to be indifferent between European final consumption, y, and Canadian final consumption scaled up to the European level,
eyy eyyy.
These alternative life style vectors are multiplied by the consumption expansion ~
factors, c and c, respectively. Finally, premultiplication by the unit row vector yields the European terms in the objective function, (1'). The Canadian terms are
~
analogous, e y(c + c). We force them to trace the European consumption level byy
References
Bank of Canada, December 1983, Bank of Canada Review.
Batra, R.N. and F.R. Casas, 1973, Intermediate products and the pure theory of international trade: a neo-Heckscher-Ohlin framework, American Economic Review 63(3), 297-311.
Bowen, H., E.E. Leamer and L. Sveikauskas, 1987, Multicountry, multifactor tests of the factor abundance theory, American Economic Review 77(5), 791-809.
Carter, A.P., 1970, Structural change in the American economy (Harvard University Press, Cambridge).
Chipman, J.S. and G. Tian, 1992, A general equilibrium intertemporal model of an open economy, Economic Theory, 2(2), 215-46.
Commission of the European Communities, 1984, Economic Paper, 31.
Deardorff, A.V., 1984, Testing trade theories and predicting trade flows, in: R.W. Jones and P.B. Kenen, eds., Handbook of International Economics, Vol. 1 (North-Holland, Amsterdam), 467-517.
Deardorff, A.V., 1986, Comments, in: T.N. Srinivasan and J. Whalley, eds., General equilibrium trade policy modeling (MIT Press, Cambridge), 311-317.
Diewert, W.E., and C.J. Morrison, 1986, Adjusting output and productivity indexes for changes in the terms of trade, Economic Journal 96, 659-679. Eurostat, 1976, Methodology of the community input-output tables 1970-75, Vol.
1 (Statistical Office of the European Communities, Luxembourg). Eurostat, 1985, Employment and unemployment (Statistical Office of the European
Communities, Luxembourg).
Eurostat, 1986, National accounts ESA-input-output tables 1980, Theme 2, Series C (Statistical Office of the European Communities, Luxembourg). Eurostat, 1989, Input-output section, the input-output table of Europe 1980,
unpublished.
Eurostat, 1990, Fixed capital stock data, unpublished.
Eurostat, 1990a, Input-output section, total employment Belgium 1980 I/O Tables, unpublished.
Government of Canada, 1984, Rate of capacity utilization, regional industrial expansion.
Ginsburgh, V.A., and J.L. Waelbroeck, Activity analysis and general equilibrium modelling (North-Holland, Amsterdam).
IMF, 1985, International financial statistics, supplement on exchange rates 9. Harris, R., 1984, Applied general equilibrium analysis of small open economies
Review, 74(5), 1016-1032.
Kop Jansen, P., and T. ten Raa, 1990, The choice of model in the construction of input-output coefficients matrices, International Economic Review 31(1), 213-227.
Krueger, A.O., 1984, Trade policies in developing countries, in R.W. Jones and P.B. Kenen, eds., Handbook of International Economics, Vol. 1 (North-Holland, Amsterdam), 519-569.
Leamer, E.E., 1980, The Leontief paradox, reconsidered, Journal of Political Economy 88, 495-503.
Leamer, E.E., and J. Levinsohn, 1994, International trade theory: the evidence, NBER working paper, 4940.
Leontief, W., 1953, Domestic production and foreign trade: the American capital position re-examined, Proceedings of the American Philosophical Society 97.
Romer, P., 1994, New goods, old theory, and the welfare costs of trade restrictions, Journal of Development Economics 43, 5-38.
Srinivasan, T.N., and J. Whalley, 1986, eds., General equilibrium trade policy modeling (MIT Press, Cambridge).
Statistics Canada, 1983, External trade division, Trade of Canada, imports by countries, exports by countries (Minister of Supply and Services Canada, Ottawa).
Statistics Canada, 1987, System of national accounts - the input-output structure of the canadian economy 1961-1981 (Minister of Supply and Services Canada, Ottawa).
Statistics Canada, 1989, Household surveys division, Historical labour force statistics-actual data, seasonal factors, seasonally adjusted data (Minister of Supply and Services Canada, Ottawa).
Statistics Canada, 1990, Input-output division, current and constant price capital stock for 1980, unpublished.
Statistics Canada, Input-output division, 1990a, Persons-hours 1961-89, unpublished.
ten Raa, T., and D. Chakraborty, 1991, Indian comparative advantage vis-à-vis Europe as revealed by linear programming of the two economies, Economic Systems Research 3(2), 111-150.
Trefler, D., 1993, International factor price differences: Leontief was right!, Journal of Political Economy 101(6), 961-987.
Williams, J.R., 1978, The Canadian-United States tariff and Canadian industry: a multisectoral analysis (University of Toronto Press, Toronto).
Woodland, A.D., 1982, International trade and resource allocation (North-Holland, Amsterdam).
Table 1. Observed, free and superfree exports minus imports from Europe to Canada (million ECU at observed
and endogenous prices, respectively)
Sector Observed exports Free exports Superfree exports minus imports minus imports minus imports ——————————————————————————————————————— 1 Agriculture 30 — 174 6,405 — 0 9,413 — 0 2-4 Minerals 196 — 1,394 4,178 — 65,734 6,830 — 0 5 Chemical Products 315 — 433 2,161 — 0 6,099 — 0 6 Metal Products 265 — 804 14,294 — 0 8,648 — 0 7-8 Machines 915 — 337 6,828 — 12,222 6,483 — 5,163 9 Transportation Equip. 598 — 162 11,081 — 0 10,534 — 0 10-12 Consumption Goods 316 — 799 21,964 — 0 21,557 — 0 13-15 Clothing & Footwear 270 — 125 9,864 — 22,373 4,920 — 97,040 16-18 Other Manufactures 263 — 1,718 20,776 — 0 24,491 — 0 Total 3,168 — 5,946 97,551 — 100,329 99,425 — 102,203
Table 2. Capital-labor ratios (ECU per worker)
Europe Canada
———————————————————————————————————————
Endowments 96,096 38,101
Endowments plus net imports: Observed 96,060 37,730
Free 96,404 36,802
Superfree 94,334 55,501
Note. Factor contents of observed and free trade are calculated using domestic technical coefficients. Factor contents of superfree trade are calculated using the technical coefficients selected by the superfree trade model.
T a bl e 3 . C la ss if ica ti on of s ect or s a nd E u ropea n a nd C a na di a n ( d is )a ggr ega ti ons . P resent S tu d y R -4 4 E .C . ca pi ta l M -l evel M -l evel C a n a d ia n ca pi ta l 2 6 s ec to rs 4 4 s ec to rs 2 5 s ec to rs 5 0 in d u st rie s 9 2 c o m m o d itie s 2 9 in d u st rie s A g ri cul tu re 010 1 1 ,2 ,3 1, 2, 3, 4, 5, 6 1 ,2 ,3 M in in g 030, 050, 110, 130 2, 5 4 ,7 7, 8, 9, 13 4 P et ro le um & N a tu ra l G a s 070 2 5 ,2 6 10, 11, 62, 63 4, 21 N o n -m et a llic Min era ls 1 5 0 6 6 ,2 5 1 2 ,6 0 ,6 1 4 ,2 0 C h em ic a l P ro d u ct s 170 7 2 7 64, 65, 66, 67 22 M et al P ro d u ct s 190 8 20, 21 45, 46, 47, 48, 49, 50, 51, 52 15, 16 M ac h in es 210, 230 9, 10 22 53, 54 17 E lect ri ca l G oods 2 5 0 1 1 2 4 5 8 ,5 9 1 9 T ra n sp o rt a ti o n E q ui p m en t 270, 290 12 23 55, 56, 57 18 F o o d 310, 330, 350 13 8 14, 15, 16, 17, 18, 19, 20, 21, 22 5 B ev er a g es 370 13 9 23, 24 6 T o b a cc o P ro d u ct s 390 13 10 25, 26 7 T ex tile s & Clo th in g 4 1 0 1 4 1 4 ,1 5 3 1 ,3 2 ,3 3 ,3 4 ,3 5 1 0 L eat h er & F o o tw ear 430 14 13 30 9 R u b b er & P las ti c 490 16 11, 12 27, 28, 29 8, 9 W ood Pr odu ct s 4 5 0 1 7 1 6 ,1 7 3 6 ,3 7 ,3 8 ,3 9 1 1 ,1 2 P a p er & P ri n ti n g 470 15 18, 19 40, 41, 42, 43, 44 13, 14 O th er M a n u fa ct ur es 510 17 28 68, 69 23 C o n st ruc ti o n 530 19 29 70, 71, 72 24 W h o le sal e & R et a il 570 20 35, 36 80, 81 28 L odgi ng & C a te ri ng 5 9 0 2 3 4 4 8 8 3 0 T ran sp o rt a ti o n 610, 630, 650 24, 25, 26 30, 31, 32, 50 73, 74, 90 25 C o m m u n ic a ti o n 670 27 33 75, 76, 77 25 U tilitie s 0 9 0 2 3 4 7 8 ,7 9 2 7 F in a n ce 690, 730 28 37, 38, 39, 40 82, 83 29 S er v ic es 790 20, 29 41, 42, 43 84, 85, 86, 87, 89 30 550, 710, 750, 770 45, 46, 47, 48, 49 91, 92 . R -44 s ec to rs 810, 850, 890 an d 930 an d E .C . c ap it al s ec to r 22 p er ta in to non-ma rk et s er v ices , w h ic h a re excl u d ed fr om se ct o r 2 6 a nd model ed a s exogenou s i n t h e pr es ent
21
Table 4. Capital and labor in Europe, 1980 Table 5. Capital and labor in Canada, 1980 Sector Utilized gross stock Employment Sector Utilized gross stock Employment
(millions ECU) (1000 persons) (millions dollars) (persons)
1 255339 7278 1 47127 735518 2 131252 2006 2 19355 118192 3 335647 199 3 35010 62383 4 70347 1539 4 4912 64444 5 141435 1729 5 13642 87284 6 65256 2806 6 20016 305501 7 89933 3859 7 1793 98423 8 59177 2901 8 2531 141608 9 94758 2957 9 5823 195028 10 115891 2502 10 7749 204892 11 12127 370 11 2868 33323 12 3116 107 12 453 7622 13 55449 2960 13 3677 182166 14 15655 1015 14 764 27410 15 37657 1109 15 1642 62642 16 26868 1553 16 5635 177202 17 58342 1870 17 21977 245841 18 8980 504 18 1028 68201 19 90170 8265 19 5605 726220 20 333574 141616 20 20120 1713967 21 65645 3368 21 9276 433900 22 94553 5887 22 53712 499772 23 160684 1806 23 35659 210192 24 116174 978 24 91924 94176 25 253540 7045 25 25892 522077 26 246610 187388 26 33309 1003204 Total 8159849 97512 Total 471499 8021276 Force 10049079 104573 Force 563382 9450655
Exchange rate 1.5646 $/ECU Total stock 360081 million ECU
Vous pouvez consulter la liste complète des publications du CIRANO et les publications elles-mêmes
%
Liste des publications au CIRANO %%
Cahiers CIRANO / CIRANO Papers (ISSN 1198-8169)
96c-1 Peut-on créer des emplois en réglementant le temps de travail ? / par Robert Lacroix 95c-2 Anomalies de marché et sélection des titres au Canada / par Richard Guay,
Jean-François L'Her et Jean-Marc Suret 95c-1 La réglementation incitative / par Marcel Boyer
94c-3 L'importance relative des gouvernements : causes, conséquences et organisations alternative / par Claude Montmarquette
94c-2 Commercial Bankruptcy and Financial Reorganization in Canada / par Jocelyn Martel 94c-1 Faire ou faire faire : La perspective de l'économie des organisations / par Michel Patry
Série Scientifique / Scientific Series (ISSN 1198-8177)
97s-08 Living on a Noisy and Dusty Street: Implications for Environmental Evaluation / Tagreed Boules, Robert Gagné et Paul Lanoie
97s-07 The Location of Comparative Advantages on the Basis of Fundamentals Only / Thijs ten Raa et Pierre Mohnen
97s-06 GARCH for Irregularly Spaced Financial Data: The ACD-GARCH Model / Eric Ghysels, Joanna Jasiak
97s-05 Can Capital Markets Create Incentives for Pollution Control? / Paul Lanoie, Benoît Laplante et Maité Roy
97s-04 La régie des services informatiques : Le rôle de la mesure et des compétences dans les décisions d’impartition / Benoit A. Aubert, Suzanne Rivard et Michel Patry 97s-03 Competition and Access in Telecoms: ECPR, Global Price Caps, and Auctions / Marcel
Boyer
97s-02 L’économie des organisations : Mythes et réalités / Marcel Boyer
97s-01 Fixed Wages, Piece Rates, and Intertenporal Productivity: A Study of Tree Planters in British Columbia / Harry J. Paarsch et Bruce Shearer
96s-34 Structural Change and Asset Pricing in Emerging Markets / René Garcia et Eric Ghysels 96s-33 Monitoring of Pollution Regulation: Do Local Conditions Matter? / Catherine Dion, Paul
Lanoie et Benoit Laplante
96s-32 Technological Learning and Organizational Context: Fit and Performance in SMEs / Élisabeth Lefebvre, Louis A. Lefebvre et Lise Préfontaine
96s-31 Piece Rates, Fixed Wages, and Incentive Effects: Statistical Evidence from Payroll Records / Harry J. Paarsch et Bruce Shearer
96s-30 R&D Spillover and Location Choice under Cournot Rivalry / Ngo Van Long et Antoine Soubeyran
![[PDF] Initiation au Lua ressource de formation complet [Eng] | Cours informatique](data:image/gif;base64,R0lGODlhAQABAIAAAP///wAAACH5BAEAAAAALAAAAAABAAEAAAICRAEAOw==)