Submission PDF
Urban point sources of nutrients were the leading
cause for the historical spread of hypoxia across
European lakes
Jean-Philippe Jenny1,2,3, Alexandre Normandeau4, Pierre Francus1,2, Zofia Ecaterina Taranu5,6, Irene Gregory-Eaves5,7, François Lapointe1,2, Josue Jautzy8, Antti E. K. Ojala9, Jean-Marcel Dorioz10, Arndt Schimmelmann11, Bernd Zolitschka12 1Centre - Eau Terre Environnement, INRS, G1K 9A9 Québec (Qc), Canada2GEOTOP Research Center, Montréal (Qc), H3C 3P8, Canada3Max Planck Institute for Biogeochemistry, 10, 07745 Jena, Germany4Geological Survey of Canada, Bedford Institute of Oceanography, Dartmouth, NS B2Y 4A2, Canada-Atlantic 5Department of Biology, McGill University, Montréal (Qc), Canada H3A 1B16Departement des sciences biologiques, Université de Montréal, Montréal (Qc), Canada H2V 2S97Groupe de Recherche Interuniversitaire en Limnology (GRIL), McGill University, Montréal (Qc), Canada H3A 1B18Department of Earth Sciences, University of Ottawa, ON, Ottawa K1N6N59Geological Survey of Finland, P.O. Box 96, 02151 Espoo, Finland10INRA UMR 42 CARRTEL, Université de Savoie, 74203 Thonon-les-bains Cedex, France11Department of Geological Sciences, Indiana University, Bloomington, IN 47405, USA 12GEOPOLAR, Institute of Geography, University of Bremen, D-28359 Bremen, Germany
Submitted to Proceedings of the National Academy of Sciences of the United States of America
Enhanced phosphorus export from land into streams and lakes is a primary factor driving the expansion of deep-water hypoxia in lakes during the Anthropocene. However, the interplay of regional scale environmental stressors and the lack of long-term instrumen-tal data often impede analyses attempting to associate changes in land cover with downstream aquatic responses. Herein we performed a synthesis of data that link paleolimnological recon-structions of lake bottom-water oxygenation to changes in land cover/use and climate over the last 300 years in order to evaluate whether the spread of hypoxia in European lakes was primarily associated with enhanced phosphorus exports from either grow-ing urbanization, intensified agriculture or climatic change. We showed that hypoxia started spreading in European lakes around CE 1850 and was greatly accelerated after CE 1900. Socio-economic changes in Europe beginning in CE 1850 resulted in widespread urbanization as well as a larger and more intensively cultivated surface area. However, our analysis of temporal trends demon-strated that the onset and intensification of lacustrine hypoxia were more strongly related to the growth of urban areas than to changes in agricultural areas and the application of fertilizers. These results suggest that anthropogenically-triggered hypoxia in European lakes were primarily caused by enhanced phosphorus discharges from urban point sources. To date, there have been no signs of sustained recovery of bottom water oxygenation in lakes following the enactment of European water legislation in the 1970s to 1980s, and the subsequent decrease in domestic phosphorus consumption.
Anthropocene | lake hypoxia | land cover/uses | meta-analysis | varved sediment
Introduction
Changes in land cover and land use have been identified as impor-tant drivers of phosphorus (P) transfers from terrestrial to aquatic systems, resulting in significant impacts on water resources (1–3). In post-World War II Europe, changes in land cover, land use and P utilization caused widespread eutrophication of freshwaters (3). Elevated rates of P release from point sources to surface water bodies increased in step with population increases, with the novel use of P in domestic detergents and with enhanced connectivity of households to sewage systems that generated concentrated effluents (4). The intensification of agriculture and drastic increased use of fertilizers from industrial and manure sources resulted in elevated P concentrations in runoff from diffuse sources (4). These trends have now metastasized from Europe and North America to most nations, which explains the almost global development of eutrophication problems in surface waters (1).
Much of our understanding regarding the interactions among changes in land cover/use, climate and lake eutrophication comes from detailed studies of individual lakes (5), modeling exercises (1), and/or regional-scale syntheses of instrumental data (6,7); these studies are largely based on relatively short time series (8). Depending on the multitudinous local differences in catchment and lake morphology, river transport capacity, climate, geology and regional trajectories in socioeconomic development, the re-sponses of lakes to surrounding land changes can differ greatly in intensity, modalities and kinetics (9–12). Multiple sites need to be investigated in order to quantify a regional trend as well as evaluate local to regional heterogeneities. Only a few studies have interpreted the long-term trajectories of lakes (based on >100-year lake records) in terms of eutrophication on a regional scale by analyzing trends in nutrient and dissolved CO2concentrations
(13, 14), carbon burial rates (15), cyanobacterial dominance (16) and hypoxia development (17). However, none of these studies considered the temporal dynamics of land cover and use, and only a few studies (16, 17) considered modern land cover. Our current lack of knowledge of the effects arising from cumulative
Significance
Using a compilation of data arising from over 1,500 European watersheds, we have identified the relative role of different drivers in initiating hypolimnetic hypoxia, a critical indicator of lake health. In particular, our regional synthesis of lami-nated lake sediments indicated a significant acceleration in the spread of lacustrine hypoxia in the 1900s, which occurred well before the general use of commercial fertilizers in the mid-20th century and the onset of supraregional climate warming in the 1970s. The spread of hypoxia was best explained by urban expansion and the associated intensification of anthropogenic point sources of phosphorus, whereby changes in life style increased the discharge of nutrients from treated and raw sewage, and ultimately led to enhanced lacustrine biological productivity.
Reserved for Publication Footnotes 1 2 3 4 5 6 7 8 9 10 11 12 13 14 15 16 17 18 19 20 21 22 23 24 25 26 27 28 29 30 31 32 33 34 35 36 37 38 39 40 41 42 43 44 45 46 47 48 49 50 51 52 53 54 55 56 57 58 59 60 61 62 63 64 65 66 67 68 69 70 71 72 73 74 75 76 77 78 79 80 81 82 83 84 85 86 87 88 89 90 91 92 93 94 95 96 97 98 99 100 101 102 103 104 105 106 107 108 109 110 111 112 113 114 115 116 117 118 119 120 121 122 123 124 125 126 127 128 129 130 131 132 133 134 135 136
Submission PDF
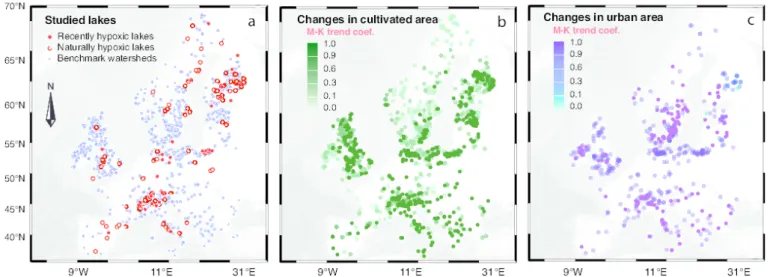
Fig. 1. Location of the 1,607 study sites and changes in land cover over the last 300 years (CE 1700-2000). (a) 51 recently hypoxic lakes (red dots), 97 naturally
hypoxic lakes (white dots), and 1,459 benchmark watersheds (blue dots) comprised of 769 from the Lake-Core Database and 690 randomly-selected European lakes from the GLWD database. (b-c) Increases in cultivated areas (%) and urban areas (%) for the last 300 years were observed in all the watersheds according to a Mann-Kendall test, where a higher coefficient indicates a stronger increase (69).
environmental pressures present the potential for a serious un-derestimation of the long-term impacts of land use changes and hinder our ability to identify the relative importance of P sources to lake ecosystems (18).
Recent progress in land use science has provided an insightful large-scale perspective spanning centuries to millennia (19–22). Additionally, European high-resolution datasets (23, 24) allow for investigations to be conducted at the scale of individual lake watersheds. The present study relies on existing datasets of changes in land cover at the watershed scale (HILDA model (24)), climate data (UDEL model (25)) and a database on the historical onset of hypoxia in lakes (17) to (i) reconstruct the Eu-ropean dynamic of lacustrine hypoxia during the Anthropocene, and (ii) decipher whether P from diffuse sources (agriculture) or point sources (urbanization) is responsible for the spread of lacustrine hypoxia in Europe.
One widely-studied response of lakes to eutrophication is bottom water hypoxia ([O2]<2 mg L-1). Bottom water hypoxia
in lakes is detrimental not only for the biota that would nor-mally inhabit oxic aquatic and benthic environments, but also facilitates biogeochemical reactions that generate methane and further mobilize pollutants from previously-accumulated sedi-ment, including P (26-28). Hypoxia can develop naturally, but more often is the result of: (i) cultural eutrophication which enhances biomass production and ultimately its decomposition through microbial oxygen respiration (29-31), and (ii) rising mean temperatures which decrease oxygen solubility in water (32), stimulate microbial oxygen respiration (30), and/ or strengthen thermal stratification (33, 34). Among these forcing mechanisms, recent paleolimnological studies identified excess P availability, and not climate, as the main driver for the onset of lacustrine hypoxia during the Anthropocene (17, 35). These studies used the presence and environmental signals of varved (i.e. annually-laminated) sediments in lakes distributed in the French Alps and worldwide to assess the long-term dynamics of hypoxia. Indeed, hypoxic conditions are recorded in lake sediments by virtue of preserved laminations after crossing a critical threshold in bottom water oxygenation that prevent macrobenthic bioturbation in the deeper parts of basins (35). The onset of sustained lamination (in-cluding varves) in modern lake sediments is an unambiguous and independent proxy for the timing of hypoxic, anoxic (i.e. complete absence of oxygen), or even euxinic (i.e. sulfidic) bottom water conditions on a regional scale. The well-defined geochronology
of lacustrine varves provides forensic evidence to quantify the timing, prevalence and causes of aquatic regime shifts (17).
Additive mixed-effect models (36) were used to analyze tem-poral trends and to depict differences among groups of water-sheds in Europe: (i) 51 waterwater-sheds with lakes recording recent hypoxia onset; (ii) 97 watersheds with lakes recording natural hypoxia; (iii) 769 benchmark watersheds extracted from the Lake
Core Database (37); and, (iv) 690 benchmark watersheds from
the Global Lakes and Wetlands Database (GLWD) (38). Lakes of the GLWD have been selected randomly in Europe to represent various gradients of human pressure, climate conditions, land cover and land use.
Results
Our sampling captured the wide ranges of lake morphometric properties, catchment sizes, modern human activities and climatic conditions that are spread across Europe (Figs. 1a, S1; Table S1). General trends in land cover change in Europe during the last 300 years corresponded to increases in the percentages of urban and cultivated areas, albeit some regions were more affected than others (Fig. 1b-c).
Based on our analyses (see Methods), we found that the fraction of lakes recording hypoxia in Europe increased over the past 300 years, from an initial annual rate of 0.06 ± 0.004 % a-1
(Pearson's test, p<0.0001) between CE 1850 and 1900 to rates of 0.20 ± 0.01 % a-1between 1900 and 2000 CE (p<0.0001; Fig.
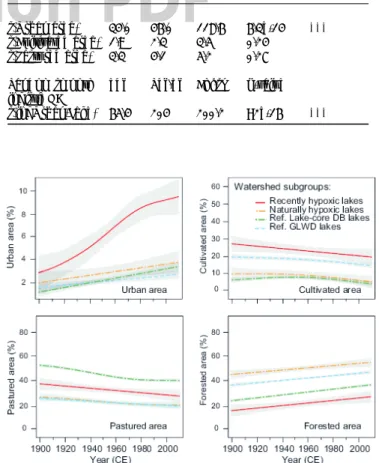
2a). In total, we found that 51 lakes shifted to hypoxia during the last 300 years (Table S2). The catchments of these 51 lakes with recent hypoxia onset had higher percentages of both cultivated and urban areas in CE 2000 than the benchmark watersheds (Fig. S2). Furthermore, most of the lakes with recent hypoxia onset were low elevation sites (48/51 were situated between sea level and the 1000 m above). We also found that the patterns of historical change in land cover and land use for these 51 lakes were best described by nonlinear (i.e. additive mixed-effect) models; urbanized areas increased sharply at the end of the 19th century (from 0.02 % in CE 1700 to 4.1 % in CE 2000), whereas the proportion of cultivated lands have expanded more gradually since the early 18th century (from 7.8 % in 1700 to 23.4 % in 2000) and occurred well before the first spread of hypoxia (Fig. 2b-c). More than half of the 51 lakes shifted to hypoxia before the introduction of fertilizers in Europe in the middle of the 20th century. Climate warming, as well as changes in precipitations, 137 138 139 140 141 142 143 144 145 146 147 148 149 150 151 152 153 154 155 156 157 158 159 160 161 162 163 164 165 166 167 168 169 170 171 172 173 174 175 176 177 178 179 180 181 182 183 184 185 186 187 188 189 190 191 192 193 194 195 196 197 198 199 200 201 202 203 204 205 206 207 208 209 210 211 212 213 214 215 216 217 218 219 220 221 222 223 224 225 226 227 228 229 230 231 232 233 234 235 236 237 238 239 240 241 242 243 244 245 246 247 248 249 250 251 252 253 254 255 256 257 258 259 260 261 262 263 264 265 266 267 268 269 270 271 272
Submission PDF
Fig. 2. Trends in the prevalence of lake hypoxia and urbanization as well as
observed climate change dynamics during the past 300 years in Europe. (a) Spread of lacustrine bottom water hypoxia shown as a cumulative number of lakes (blue curve) based the onset of varve deposition in lake sediments from the 51 lakes subset, and the human population in these watersheds (red dashed curve). (b) Percentages of urban and (c) agriculturally-cultivated areas in watersheds of the 51 lakes that shifted to hypoxia during the last 300 years. In (b, c), temporal trends and 95 % confidence intervals were calculated according to centennial land use data and the additive mixed-effect model (AMM). Black arrow in (b) indicates early European water legislation in the 1970s and 1980s (70). Dark grey and green shaded peaks in (c) indicate the respective nitrogen (N) and phosphate (P2O5) fertilizer applications in the European Union since the 1950s (71). European trends in (d) air temperature and (e) April-May-June (AMJ) precipitation reconstructed from tree rings (72).
is also an unlikely primary driver for the onset of hypoxia as the
Fig. 3. Probability of hypoxia onset increased as a function of urban area
(%) in the 51 lake subset.The logistic GAMM showed that the probability of a hypoxia onset in lakes increased as the proportion of urban area increased over the last 300 years (a). The random smooth logistic GAMM further detected that the vast majority of lakes experienced an increase in probability of hypoxia as urban land cover increased but that the timing of the onset varied among lakes (b).
Table 1. Random slope logistic GAMM
edf Ref.df Chi.sq p-value Signif.
s(Urban area) 34.0 46.0 118.6 6.3e-14 ***
s(Cultivated area) 1.9 2.3 3.5 0.24
s(Pastured area) 3.3 4.1 5.2 0.27
Random smooth logistic GAMM
edf Ref.df Chi.sq p-value
s(logUrban,Lake) 65.4 204 200.2 <2e-16 ***
Fig. 4. One hundred year trends for land cover in Europe based on an additive mixed-effect model (AMM), grouping watersheds according to their history of downstream lake hypoxia or reference source. Trends in Europe represent decadal percentages of urban, cultivated, grassland and forested areas. Note the higher increase in urbanization for the recently hypoxic sites during the last 110 years compared to the reference sites. Grey bands indicate 95 % confidence intervals of the predicted means based on the AMM. main warming signal in the air-temperature record post-dates the initial spread of hypoxia (Fig. 2d-e).
Our statistical analyses support the conclusion that urban point sources were the leading driver for the onset of hypoxia. 273 274 275 276 277 278 279 280 281 282 283 284 285 286 287 288 289 290 291 292 293 294 295 296 297 298 299 300 301 302 303 304 305 306 307 308 309 310 311 312 313 314 315 316 317 318 319 320 321 322 323 324 325 326 327 328 329 330 331 332 333 334 335 336 337 338 339 340 341 342 343 344 345 346 347 348 349 350 351 352 353 354 355 356 357 358 359 360 361 362 363 364 365 366 367 368 369 370 371 372 373 374 375 376 377 378 379 380 381 382 383 384 385 386 387 388 389 390 391 392 393 394 395 396 397 398 399 400 401 402 403 404 405 406 407 408
Submission PDF
Using a general additive mixed model (i.e. GAMM) we found that the probability of hypoxia onset in our 51 lake subset increased as the proportion of urban area increased over the last 300 years (p<0.0001), but was unrelated to the changes in cultivated and pastured land area (p>0.1) (Fig. 3; Table 1; R2=0.23). A common observation across the lakes with hypoxia developing only recently is the acceleration of urbanization around CE 1900 that coincided with the onset of hypoxia (Fig. S3). However, the timing of hypoxia onset was quite variable across lakes (Fig. 3b). The varve records showed no evidence of a sustained return to improved oxygenated conditions, despite many efforts of remedi-ation (Fig. 2a).
Centennial trends in land cover for the 51 watersheds dif-fered notably from trends in the 97 study watersheds recording natural hypoxia (i.e. sites with sustained varves for >300 years; see Methods) and the 1,459 benchmark watersheds (Fig. 4). The rate of expansion of urban areas was significantly higher in watersheds associated with recent hypolimnetic hypoxia than in other European watersheds (Table 1, Fig. 4). To the contrary, the rate of changes in cultivated and pastured areas are similar in watersheds with recent hypoxic lakes and other European watersheds, although the absolute magnitude of cultivated land was generally higher around the sites with recent hypoxia. M-K tests indicated that hypoxia onsets were preceded by centennial increases in urban (45 % of the sites), cultivated (95 % of the sites) and pastured areas (80 % of the sites). However, during the transition toward hypoxia (-/+ 20 years centred on the time of the onset), urban areas expanded in 71 % of the sites, whereas cultivated and pastured areas were decreasing in 61 % and 74 % of the sites, respectively (Tables S3, S4). Collectively, these findings suggest that urban point sources of nutrients were the leading factor explaining the spread of lacustrine hypoxia in Europe over the last few centuries. The prevailing importance of urban point sources of nutrients as the preeminent trigger towards the spread of hypoxia was also validated by M-K and AMM analyses of decadal-scale landscape and climatic recon-structions spanning the period between CE 1900-2010 (24; Figs. 4, S3, S4). Finally, basin-scale analyses of modern characteristics confirmed the prevailing importance of local human activities on the presence of hypoxia (Fig. S5).
Discussion
This regional-scale analysis of paleolimnological records adds to the growing evidence that modern human activities are a widespread force in shaping the structure and functioning of inland waters (13, 39–42). Our previous paper (17) demonstrated that the spread of lacustrine hypoxia at the global scale was pre-dominantly the result of non-descript human impact. However, the current study specifically pinpoints urban point sources of nutrients as the main forcing mechanism within Europe. Based on earlier water quality studies and paleoecological data, it is known that algal blooms decreased water transparency for most lakes in Europe starting in the middle to late 19th century (37). The eutrophication phase was often more pronounced beginning CE∼1950 (37, 43), but the development of widespread hypolim-netic hypoxia has largely predated the more visible effects of eutrophication in the epilimnion (this study). As such, the spread of hypolimnetic hypoxia can be considered as an early warning of eutrophication, caused by enhanced sediment and organic matter fluxes towards bottom waters. The hypolimnion acts as an integrator of processes taking place over the entire water column. It is generally well accepted that contemporary freshwater eutrophication is predominantly caused by diffuse P sources, principally from agriculture (2), in developed nations (i.e. nations having very high human development in 2014 according to the UN Human Development Index). In contrast, the situation in developing nations is mixed and includes diffuse sources of P
and domestic point sources (18). However, our analysis of longer-term trends in Europe (Fig. 2) provides an important historical perspective, whereby intensive fertilization of agricultural soils and associated diffuse sources of P and N increased through the middle of the 20th century largely post-dated the initial spread of lake hypoxia (Fig. 2a, c) (2, 18). As such, diffuse sources of P appear to have had a subordinate role compared to point sources for most of the last 300 years, and were not decisive for the onset of lacustrine hypoxia in most of the studied lakes. However, nutrient arising from agricultural areas likely had some effect as the long-term M-K tests demonstrated that hypoxia onsets were preceded by increases in cultivated and pastured areas, as well as urban areas. Overall, we suggest that lakes have suffered a slow loss of resilience as a result of both point and diffuse P inputs over time until a disproportionate increase from urban point sources tipped the balance towards hypoxia.
In present-days Europe and North America, domestic sewage and industrial waste water mostly receive an efficient treatment, including P removal prior to discharging effluents into lakes (44). However, the situation around the end of the 19th century was
quite different as urban waste waters with increasing P content were directly discharged into waterways (44) and began affecting downstream aquatic ecosystems. The problem was fuelled by urban expansion, a growing population, an accelerating economy during the industrial revolution, the rising standard of living, and novel domestic and industrial uses of P (45). The first P-containing detergents were introduced around the end of the 19thcentury and soon enjoyed wide acceptance (45). All of these
developments were synchronous with the rapid spread of lake hypoxia.
Importantly, our study shows that lakes with recent hypoxia shifted abruptly and irreversibly to an alternate stable state. For instance, among the lakes considered in this study, three peri-alpine lakes (Geneva, Bourget, Annecy, Fig. S6) that were pre-viously oxygenated over the last millennia shifted to hypolimnic hypoxia between CE 1930 and CE 1950 following a slight P increase (i.e. with enrichments of only∼8-10 µg P L-1; (35, 46-47). This illustrates that even a small increase in P availability can stimulate enough primary productivity to trigger hypoxia without generating algal blooms (as blooms were only observed after CE 1950). Likewise, the temporal trend of oxygenation in European lakes (Fig. 2a) shows a slowing down of rate of increase, but no turning off of hypoxia after the 1980s, despite the implementation of restoration programs and successful controls on nutrient influx. The crossing of critical thresholds of nutrient loading appeared to have abruptly and irreversibly shifted lacustrine ecosystems from one state to another (48). Imported P, both from watersheds (external load) and remobilized from lake sediments (internal load) can explain the stability of hypoxia over the last ca. 30 to 40 years. P loads from watersheds to downstream lakes initially accumulate in lake sediments, but later may be remobilized from sediments into overlying waters under hypoxic conditions. P-rich sediments have been identified as the key factor in sustaining hypoxia (49, 50). For instance, the accumulation of organic matter during eutrophic conditions and the subsequent diagenetic re-lease of P from near-surface sediments is known to cause lakes to remain in a eutrophic state even if the external input of P has diminished (1). In addition, a reduced ability of ecosystems to remove nitrogen via denitrification and anaerobic ammonium oxidation may be related to hypoxia and could lead to accelerated eutrophication (49). Finally, an increase in water temperature could also decrease the threshold of P concentrations sustaining hypoxia, with more intense stratification, reduced solubility of oxygen at higher water temperatures and enhanced metabolic rates in warmer bottom waters (51).
Unfortunately, the lack of past land cover data at a suffi-ciently high spatial resolution in other regions prevents from 409 410 411 412 413 414 415 416 417 418 419 420 421 422 423 424 425 426 427 428 429 430 431 432 433 434 435 436 437 438 439 440 441 442 443 444 445 446 447 448 449 450 451 452 453 454 455 456 457 458 459 460 461 462 463 464 465 466 467 468 469 470 471 472 473 474 475 476 477 478 479 480 481 482 483 484 485 486 487 488 489 490 491 492 493 494 495 496 497 498 499 500 501 502 503 504 505 506 507 508 509 510 511 512 513 514 515 516 517 518 519 520 521 522 523 524 525 526 527 528 529 530 531 532 533 534 535 536 537 538 539 540 541 542 543 544
Submission PDF
expanding this work globally. Nonetheless, the observed regime shifts to new stable hypoxic conditions highlight the challenges for developing countries facing persistent diffuse P emissions, growing P demands together with changes in lifestyle (e.g., diet shifts), and expanding urban areas (including the development of megacities and peri-urbanization). Moreover, wastewater from sewage and industry is often untreated and may be the primary contributor towards eutrophication (52). For example, only 35 % of wastewater in Asia and <1 % in Africa were treated in CE 2005 (52). Without implementation of wastewater treatment of P in point and mixed sources, the future of lakes in these regions will likely result in prevalent hypoxic hypolimnetic conditions, degraded water quality and the necessity for decade-long restora-tion efforts.
In conclusion, our analyses of varved sediment records indi-cate that nutrient point sources from growing urban areas were the leading driver for the onset of hypoxia in the hypolimnion of downstream lakes. Point and diffuse sources have always both contributed to the total supply of nutrient inputs to lakes, but with varying intensities over time and space. Our results show that urban point sources of P were the dominant driver of lake eutrophication in European lowland systems during the Anthro-pocene. During the last few decades, the relative contribution of diffuse P sources has progressively become a major cause of modern freshwater eutrophication in developed countries, as point sources have been reduced and fertilizer use has increased. The lack of re-oxygenation of the hypolimnion evident from our analyses highlight the importance of the history and legacy of past land uses, and the need for long-term strategies to maintain and restore water quality in modern lake ecosystems.
Materials and Methods Reconstructing the dynamics of hypoxia
The sediment textures of many lakes offer a simple proxy for the oxygenation history of bottom waters (53-55). Indeed, the appearance of laminated sediment on top of homogeneous sediment indicates that annual oxygenation conditions fell below a critical threshold in both duration and concentration (35, 56, 57), hence recording the die-out of macrobenthos and the end of its related bioturbation (Fig. S7, 54, 58, 59). If laminations are proven to reflect annual cycles of sedimentation, they offer the additional advantage that the shift from well-oxygenated to at least seasonal hypoxic hypolimnic conditions can often be precisely dated by counting varves from the sediment/water interface down-core (54). The Varves Working Group of PAGES (VWG) has intensively investigated varved lakes over the last decade (54, 60, 61), enabling the assembly of a large dataset of lake hypoxia (17). In Europe, 148 varved sediment records were referenced in the global compila-tion of the VWG (17) and indicated that the European dynamics of lacustrine hypoxia encompassed: (i) a period of relatively undisturbed conditions prior to CE 1850 serving as a pre-industrialized baseline reference; (ii) a period of major changes during the early industrialization of western countries and the following “Great Acceleration” phase of the so-called Anthropocene (42); and, (iii) the initiation of European lake restoration programs since the 1970s. Land use changes in watersheds of recently varved lakes have been compared to a set of 97 naturally varved lakes in order to dismiss any sampling bias related to morphometric properties. Preservation of laminated sediments usually indicates that lakes have strong hypoxia; however, strong seasonal hypoxia may not systematically develop laminations, notably due to the absence of contrasting seasonal sedimentation, or as a consequence of wind causing sediment resuspension. Our data matrix does not attempt to include all lakes with hypoxia but instead includes a conservative and large selection of well-characterized lakes with laminated sediments to provide a statistically sound and relevant basis for constraining the dynamics of hypoxia in Europe.
Paleolimnological data
A literature search was conducted in April 2014 (17) and updated in June 2015 using the ISI Web of Science database and Google Scholar with different combinations of the following keywords: ‘varve’ and ‘lake’, and ‘lamin’ and ‘lake sediment’. The search yielded 148 relevant European lakes that contain laminated or varved sediments. Descriptions and data on varved sites, sediments and dating methods are available in (17) and references
therein. The original chronologies were expressed in Common Era (CE) calendar years. Laminated lacustrine sites had to satisfy several conditions in order to be included in this synthesis. Accepted sites (i) contained a varved or well-preserved laminated sedimentary sequence, (ii) featured a published age-model relying on varve counting and/ or radiometric dating, and (iii) the lakes’ sediment texture had to be explicitly described or illustrated by pictures outlining the laminated intervals. The timing of the first onset of hypoxia was obtained for each lake by examining all relevant published varve data. Where time intervals could not be dated precisely with the help of published data, corresponding authors were contacted and asked for advice. The water depth for each lake was collected and used to verify that lake level fluctuations were not the cause of changes in preservation conditions of the varves. Descriptions and data for lake sites were compiled in this study (Table S1).
Land use and climate data
Modern data and temporal changes in land use and climate during the last 300 years were analyzed for 1,607 watersheds. Hydrological basins of each site were calculated using the flow accumulation and flow direction rasters made available from HydroSHEDS together with lake perimeters and areas, using the Global Lakes and Wetlands Database from the World Wildlife Foundation (38). The following variables were extracted from mod-eled areas using the geographic information system ArcGIS: (i) modern site characteristics; (ii) past land use from CE 1900 to 2010 at decadal steps and with a 1 km2spatial resolution and (iii) past land use from CE 1700 to 2000 with centennial resolution. Mean local temperatures, precipitation, population densities (62), changes in urban area, cultivated, pastured and forest areas (24) as well as past human population densities (63) were extracted from modeled areas for each watershed.
Numerical analysis
An additive mixed-effect model (AMM) framework generated using the mgcv library in R (64) was used to describe the general nonlinear trends in land uses over the last three centuries. It was anticipated from (17) that watersheds with recently hypoxic lakes would contain an environmental signal reflecting a more urbanized and agriculturally-cultivated landscape compared to watersheds serving as benchmarks as well as naturally hypoxic lakes. Thus, the relationships among urban, cultivated, pastured and forested areas were evaluated for the four watershed categories of this study. Con-fidence intervals were derived using the standard errors produced by the predict.gam function in R (65), with type = ‘response’ specified in the model (mgcv library (66)).
Multiple regression analyses were conducted to identify the main drivers of hypoxia onsets. For each recently hypoxic lake (n = 51), we created a binomial time series indicating whether the first hypoxic event had occurred or not at each date of the land cover data (i.e. 1700, 1800, 1900, 1910, ... , 2010). To test the relative importance of the different land cover types, we then ran a logistic general additive mixed-effect models (GAMM) using the binomial time series as the response variable, the percentage of urban, cultivated and pastured areas as fixed effect explanatory variables, and lake ID as the random effect (testing a random slope and intercept for each lake). To further test whether the smooth term varied among lakes, we tested a random smooth logistic GAMM, which not only allowed the slope to vary among lakes but also the shape of the nonlinear relationship. All GAMMs were fit using the bam function of the itsadug package in R (67).
Non-parametric Mann–Kendall (M-K) tests for monotonic trends were used to quantify trends of land use for each of the 1,607 watershed time series within the past 300 years. This analysis was based on the Kendall rank correlation coefficient and was conducted using the Kendall library (68). A positive score shows a monotonically increasing trend, whereas a negative value shows a monotonically decreasing trend (69). For each site, M-K tests were run for two time windows to identify the potential effects of slow and fast land cover changes on the hypoxia onset: (i) we anticipated that fast changes in the land cover would show an effect within a short period of time (±20 years) centered on the time of the onset to be consistent with the uncertainties of reconstructions, and (ii) slow changes in the land cover would show an effect over a longer period of time (∼200 years) preceding the onset of hypoxia to be consistent with the long-term history and potential legacy effects of past land changes in Europe.
Acknowledgements
This study was supported by the Natural Sciences and Engineering Re-search Council of Canada (NSERC) to P.F., the NSERC and the Canada ReRe-search Chair of I-G.E., Fonds de recherche du Québec (FRQNT) to Z.T., the Academy of Finland to A.O. and is a product of the Varve Working Group (VWG) within the International Geosphere-Biosphere Programme IGBP-PAGES (Past Global Changes). The authors thank J.P. Schimmelmann for editing the English and declare no competing interests.
1. Carpenter SR (2005) Eutrophication of aquatic ecosystems: Bistability and soil phosphorus.
Proc Natl Acad Sci USA 102(29):10002–10005.
2. Carpenter SR, et al. (1998) Nonpoint pollution of surface waters with phosphorus and nitrogen. Ecol Appl 8(3):559–568.
3. Vollenweider RA (1968) Water management research. Scientific fundamentals of the
eutrophi-cation of lakes and flowing waters with particular reference to nitrogen and phosphorus as factors in eutrophication. (OECD, Paris, France).
4. Garnier J, et al. (2015) Phosphorus budget in the water-agro-food system at nested scales in two contrasted regions of the world (ASEAN-8 and EU-27). Glob Biogeochem Cycles 29(9): 1348–1368. 545 546 547 548 549 550 551 552 553 554 555 556 557 558 559 560 561 562 563 564 565 566 567 568 569 570 571 572 573 574 575 576 577 578 579 580 581 582 583 584 585 586 587 588 589 590 591 592 593 594 595 596 597 598 599 600 601 602 603 604 605 606 607 608 609 610 611 612 613 614 615 616 617 618 619 620 621 622 623 624 625 626 627 628 629 630 631 632 633 634 635 636 637 638 639 640 641 642 643 644 645 646 647 648 649 650 651 652 653 654 655 656 657 658 659 660 661 662 663 664 665 666 667 668 669 670 671 672 673 674 675 676 677 678 679 680
Submission PDF
5. Patterson RT, Dalby A, Kumar A, Henderson LA, Boudreau REA (2002) Arcellaceans(thecamoebians) as indicators of land-use change: settlement history of the Swan Lake area, Ontario as a case study. J Paleolimnol 28(3):297–316.
6. Taranu ZE, Gregory-Eaves I (2008) Quantifying relationships among phosphorus, agricul-ture, and lake depth at an inter-regional scale. Ecosystems 11(5):715–725.
7. O’Reilly CM, et al. (2015) Rapid and highly variable warming of lake surface waters around the globe. Geophys Res Lett 42(24):2015GL066235.
8. Anneville O, Gammeter S, Straile D (2005) Phosphorus decrease and climate variability : mediators of synchrony in phytoplankton changes among European peri-alpine lakes. Freshw
Biol 50(10):1731–1746.
9. Ramstack J, Fritz S, Engstrom D (2004) Twentieth century water quality trends in Minnesota lakes compared with presettlement variability. Pap Earth Atmospheric Sci. Available at: http://digitalcommons.unl.edu/geosciencefacpub/43.
10. Fraterrigo JM, Downing JA (2008) The Influence of Land Use on Lake Nutrients Varies with Watershed Transport Capacity. Ecosystems 11(7):1021–1034.
11. Pham SV, Leavitt PR, McGowan S, Peres-Neto P (2008) Spatial variability of climate and land-use effects on lakes of the northern Great Plains. Limnol Oceanogr 53(2):728–742. 12. Perga ME, et al. (2015) High-resolution paleolimnology opens new management perspectives
for lakes adaptation to climate warming. Front Ecol Evol 3:72. doi: 10.3389/fevo.2015.00072 13. Keatley BE, Bennett EM, MacDonald GK, Taranu ZE, Gregory-Eaves I (2011) Land-use
legacies are important determinants of lake eutrophication in the Anthropocene. PLoS ONE 6(1):e15913.
14. Anderson NJ, Bennion H, Lotter AF (2014) Lake eutrophication and its implications for organic carbon sequestration in Europe. Glob Change Biol 20(9):2741–2751.
15. Perga M-E, et al. (2016) A century of human-driven changes in the carbon dioxide concen-tration of lakes. Glob Biogeochem Cycles 30(2):2015GB005286.
16. Taranu ZE, et al. (2015) Acceleration of cyanobacterial dominance in north temperate-subarctic lakes during the Anthropocene. Ecol Lett 18(4):375–384.
17. Jenny J-P, et al. (2016) Global spread of hypoxia in freshwater ecosystems during the last three centuries is caused by rising local human pressure. Glob Change Biol 22(4):1481–1489 18. Bennett EM, Carpenter SR, Caraco NF (2001) Human impact on erodable phosphorus and eutrophication: A global perspective increasing accumulation of phosphorus in soil threatens rivers, lakes, and coastal oceans with eutrophication. BioScience 51(3):227–234. 19. Pongratz J, Reick C, Raddatz T, Claussen M (2008) A reconstruction of global agricultural
areas and land cover for the last millennium. Glob Biogeochem Cycles 22(3):GB3018. 20. Verburg PH, et al. (2015) Land system science and sustainable development of the earth
system: A global land project perspective. Anthropocene. doi:10.1016/j.ancene.2015.09.004. 21. Vliet J van, et al. (2015) Meta-studies in land use science: Current coverage and prospects.
Ambio 45(1):15–28.
22. Klein Goldewijk K, Beusen A, van Drecht G, de Vos M (2011) The HYDE 3.1 spatially explicit database of human-induced global land-use change over the past 12,000 years. Glob
Ecol Biogeogr 20(1):73–86.
23. Fuchs R, Herold M, Verburg PH, Clevers JGPW (2013) A high-resolution and harmonized model approach for reconstructing and analysing historic land changes in Europe.
Biogeo-sciences 10(3):1543–1559.
24. Fuchs R, Herold M, Verburg PH, Clevers JGPW, Eberle J (2015) Gross changes in recon-structions of historic land cover/use for Europe between 1900 and 2010. Glob Change Biol 21(1):299–313.
25. Willmott CJ, Robeson SM (1995) Climatologically aided interpolation (CAI) of terrestrial air temperature. Int J Climatol 15(2):221–229.
26. Frossard V, et al. (2013) Chironomid assemblages in cores from multiple water depths reflect oxygen-driven changes in a deep French lake over the last 150 years. J Paleolimnol 50(3):257–273.
27. R A Mah, D M Ward, L Baresi, Glass and TL (1977) Biogenesis of methane. Annu Rev
Microbiol 31(1):309–341.
28. Wahlen M (1993) The Global methane cycle. Annu Rev Earth Planet Sci 21(1):407–426. 29. Nixon SW (1995) Coastal marine eutrophication: a definition, social causes, and future
concerns. Ophelia 41:199–219.
30. Müller B, Bryant LD, Matzinger A, Wüest A (2012) Hypolimnetic oxygen depletion in eutrophic lakes. Environ Sci Technol 46(18):9964–9971.
31. Conley DJ, et al. (2009) Hypoxia-related processes in the Baltic Sea. Environ Sci Technol 43(10):3412–3420.
32. Deutsch C, Brix H, Ito T, Frenzel H, Thompson L (2011) Climate-forced variability of ocean hypoxia. Science 333(6040):336 –339.
33. Straile D, Jöhnk K, Rossknecht H (2003) Complex effects of winter warming on the physicochemical characteristics of a deep lake. Limnol Oceanogr 48(4):1432–1438. 34. Coma R, et al. (2009) Global warming-enhanced stratification and mass mortality events in
the Mediterranean. Proc Natl Acad Sci 106(15):6176–6181.
35. Jenny J-P, et al. (2014) Inherited hypoxia: A new challenge for reoligotrophicated lakes under global warming. Glob Biogeochem Cycles (28):1944–9224.
36. Simpson GL, Anderson NJ (2009) Deciphering the effect of climate change and separating the influence of confounding factors in sediment core records using additive models
Limnol-ogy and Oceanography 56(6):2529–2541
37. Battarbee RW, et al. (2010) A palaeolimnological meta-database for assessing the ecological status of lakes. J Paleolimnol 45(4):405–414.
38. Lehner B, Döll P (2004) Development and validation of a global database of lakes, reservoirs and wetlands. J Hydrol 296(1–4):1–22.
39. Wolfe AP, et al. (2013) Stratigraphic expressions of the Holocene–Anthropocene transition revealed in sediments from remote lakes. Earth-Sci Rev 116(0):17–34.
40. Crutzen PJ (2002) Geology of mankind. Nature 415(6867):23–23.
41. Crutzen PJ, Steffen W (2003) How long have we been in the Anthropocene Era? Clim Change 61(3):251–257.
42. Steffen W, Crutzen PJ, McNeill JR (2007) The Anthropocene: are humans now overwhelming
the great forces of nature. AMBIO J Hum Environ 36(8):614–621.
43. Vallentyne JR (1974) The Algal Bowl: Environment Canada, vol. 22. Miscellaneous Special
Publication, Ottawa, Ontario.
44. Selman M, Greenhalgh S, Diaz RJ, Sugg Z (2015) Water quality: eutrophication and hypoxia. Available at: http://pdf.wri.org/eutrophication and hypoxia in coastal areas.pdf. 45. Ashley K, Cordell D, Mavinic D (2011) A brief history of phosphorus: From the philosopher’s
stone to nutrient recovery and reuse. Chemosphere 84(6):737–746.
46. Jenny J-P, et al. (2013) A spatiotemporal investigation of varved sediments highlights the dynamics of hypolimnetic hypoxia in a large hard-water lake over the last 150 years. Limnol
Oceanogr 58(4):1395–1408.
47. Berthon V, et al. (2013) Trophic history of French sub-alpine lakes over the last∼150 years:
phosphorus reconstruction and assessment of taphonomic biases. J Limnol 72(3):e34. 48. Barnosky AD, et al. (2012) Approaching a state shift in Earth/’s biosphere. Nature
486(7401):52–58.
49. Conley DJ, Carstensen J, Vaquer-Sunyer R, Duarte CM (2009) Ecosystem thresholds with hypoxia. Hydrobiologia 629(1):21–29.
50. Colen CV, et al. (2012) Organism-sediment interactions govern post-hypoxia recovery of ecosystem functioning. PLOS ONE 7(11):e49795.
51. Meire L, Soetaert KER, Meysman FJR (2013) Impact of global change on coastal oxygen dynamics and risk of hypoxia. Biogeosciences 10(4):2633–2653.
52. Howarth R, Ramakrrshna K (2005) Nutrient Management. Millennium Ecosystem Assessment
(MA) (Washington, DC: Island Press.). K. Chopra, R. Leemans, P. Kumar, and H. Simons.
Ecosystems and Human Wellbeing: Policy Responses.
53. O’Sullivan PE (1983) Annually-laminated lake sediments and the study of Quaternary environmental changes – a review. Quat Sci Rev 1(4):245–313.
54. Zolitschka B, Francus P, Ojala AEK, Schimmelmann A (2015) Varves in lake sediments – a review. Quat Sci Rev 117:1–41.
55. Lotter AF, Sturm M, Teranes JL, Wehrli B (1997) Varve formation since 1885 and high-resolution varve analyses in hypertrophic Baldeggersee (Switzerland). Aquat Sci 59(4):304–325.
56. Rabalais NN, Turner RE, Union AG (2001) Coastal hypoxia: consequences for living resources
and ecosystems (American Geophysical Union).
57. Cicchetti G, et al. (2006) Relationships between near-bottom dissolved oxygen and sediment profile camera measures. J Mar Syst 62(3-4):124–141.
58. Tylmann W, Zolitschka B, Enters D, Ohlendorf C (2013) Laminated lake sediments in north-east Poland: distribution, preconditions for formation and potential for paleoenvironmental investigation. J Paleolimnol 50(4):487–503.
59. Christensen CJ, Gorsline DS, Hammond DE, Lund SP (1994) Non-annual laminations and expansion of anoxic basin-floor conditions in Santa Monica Basin, California Borderland, over the past four centuries. Mar Geol 116(3-4):399–418.
60. Francus P, Ridge JC, Johnson MD (2013) The rise of varves. GFF 135(3-4):229–230. 61. Ojala AEK, Francus P, Zolitschka B, Besonen M, Lamoureux SF (2012) Characteristics of
sedimentary varve chronologies – A review. Quat Sci Rev 43:45–60.
62. Center for International Earth Science Information Network - CIESIN - Columbia Univer-sity, Centro Internacional de Agricultura Tropical - CIAT (2005) Gridded population of the world, Version 3 (GPWv3): population density grid. Available at: http://dx.doi.org/10.7927/H-4XK8CG2.
63. Ellis EC, Klein Goldewijk K, Siebert S, Lightman D, Ramankutty N (2010) Anthropogenic transformation of the biomes, 1700 to 2000. Glob Ecol Biogeogr 19(5):589–606. 64. Wood S (2006) Generalized additive models: an introduction with R (Chapman and Hall/CRC
Press).
65. R Development Core Team (2008) R: A language and environment for statistical computing.
R Foundation for Statistical Computing, Vienna, Austria. Available at: URL
http://www.R-project.org.
66. Wood SN (2011) Fast stable restricted maximum likelihood and marginal likelihood estima-tion of semiparametric generalized linear models. J R Stat Soc Ser B Stat Methodol 73(1):3–36. 67. Rij J van, Wieling M, Baayen RH, Rijn H van (2016) itsadug: Interpreting
Time Series and Autocorrelated Data Using GAMMs Available at:
https://cran.r-project.org/web/packages/itsadug/index.html [Accessed July 5, 2016].
68. McLeod AI (2011) Kendall: Kendall Rank Correlation and Correlation and Mann-Kendall trend
test, R package version 2.2. Available at: http://cran.rproject.org/package=Kendall. Last accessed 5 February 2015.
69. Legendre P, Legendre LFJ (2012) Numerical Ecology, Volume 24, Third Edition (Elsevier, Amsterdam). 3 edition.
70. Sands P, Galizzi P (2006) Council Directive 76/160/EEC of 8 December 1975 concerning the quality of bathing water (OJ L 031 05.02.1976 p. 1). Documents in European
Com-munity Environmental Law (Cambridge University Press). Second edition Available at:
http://dx.doi.org/10.1017/CBO9780511610851.053.
71. European Commission (2010) The EU Nitrates Directive. [Online] Available at:
http://ec.europa.eu/environment/pubs/pdf/factsheets/nitrates.pdf [Accessed 22 1 2012].
72. Büntgen U, et al. (2011) 2500 Years of European climate variability and human susceptibility.
Science 331(6017):578–582.
73. De Vicente I, Cattaneo K, Cruz-Pizarro L, Brauer A, Guilizzoni P (2006) Sedimentary Phosphate Fractions Related to Calcite Precipitation in an Eutrophic Hardwater Lake (Lake Alserio, Northern Italy). Journal of Paleolimnology 35(1):55–64.
74. Meriläinen JJ, Hynynen J, Palomäki A, Mäntykoski K, Witick A (2003) Environmental history of an urban lake: a palaeolimnological study of Lake Jyväsjärvi, Finland. Journal of
Paleolimnology 30(4):387–406.
75. Garibaldi L, Mezzanotte V, Brizzio MC, Rogora M, Mosello R (1999) The trophic evolution of Lake Iseo as related to its holomixis. Journal of Limnology 58(1):10–19.
76. Renberg I (1986) Photographic demonstration of the annual nature of a varve type common in N. Swedish lake sediments. Hydrobiologia 140(1):93–95.
681 682 683 684 685 686 687 688 689 690 691 692 693 694 695 696 697 698 699 700 701 702 703 704 705 706 707 708 709 710 711 712 713 714 715 716 717 718 719 720 721 722 723 724 725 726 727 728 729 730 731 732 733 734 735 736 737 738 739 740 741 742 743 744 745 746 747 748 749 750 751 752 753 754 755 756 757 758 759 760 761 762 763 764 765 766 767 768 769 770 771 772 773 774 775 776 777 778 779 780 781 782 783 784 785 786 787 788 789 790 791 792 793 794 795 796 797 798 799 800 801 802 803 804 805 806 807 808 809 810 811 812 813 814 815 816