OATAO is an open access repository that collects the work of Toulouse
researchers and makes it freely available over the web where possible
Any correspondence concerning this service should be sent
to the repository administrator:
tech-oatao@listes-diff.inp-toulouse.fr
This is an author’s version published in: http://oatao.univ-toulouse.fr/27129
To cite this version:
Hultmann Ayala, Helon Vicente and Rakotondrabe, Micky
and
Dos Santos Coelho, Landro Piezoelectric micromanipulator dataset
forhysteresis identification. (2020) Data in Brief, 29. 1-6. ISSN
2352-3409
Official URL:
Data Article
Piezoelectric micromanipulator dataset for
hysteresis identification
Helon Vicente Hultmann Ayala
a
,
*
, Micky Rakotondrabe
b
,
Leandro dos Santos Coelho
c
aDepartment of Mechanical Engineering, Pontifical Catholic University of Rio de Janeiro, Brazil bLaboratoire G!enie de Production, National School of Engineering in Tarbes / INPT, France cIndustrial and Systems Graduate Program, Pontifical Catholic University of Paran!a, Brazil
a r t i c l e
i n f o
Article history:
Received 10 December 2019
Received in revised form 15 January 2020 Accepted 16 January 2020
Available online 25 January 2020
Keywords: Micromanipulators System identification Piezoelectric actuator Mechatronics
a b s t r a c t
This data in brief presents displacement measurements acquired
from a piezoelectric cantilevered actuator when subjected to
har-monic excitations. The micro displacements are measured with
optical sensors. The dataset has been used recently for the purpose
of nonlinear black-box modelling, where the hysteretic behaviour
of such devices has been modelled [1,2]. We hope to enable
reproducibility by sharing the data used in [1,2], which are
pre-vious works by the authors, allowing the comparison of new
methods on a common basis. Additionally, researchers interested
in piezoelectric actuators for high precision tasks may also benefit
on working with the present dataset.
©
2020 The Author(s). Published by Elsevier Inc. This is an open
access article under the CC BY license (
http://creativecommons.
org/licenses/by/4.0/
).
1. Data description
The dataset is composed of two input/output data pairs. The system is excited with a sine voltage
input of (a) 150 V and 1 Hz; and (b) 5 V and 300 Hz. The dataset (b) has been employed for identification
in Refs. [
1
,
2
]. The goal of measuring both datasets is to evaluate the modelling activity when working
* Corresponding author.
E-mail address:helon@puc-rio.br(H.V. Hultmann Ayala).
Contents lists available at
ScienceDirect
Data in brief
j o u r n a l h o m e p a g e :
w w w . e l s e v i e r . c o m / l o c a t e / d i b
https://doi.org/10.1016/j.dib.2020.105175
2352-3409/© 2020 The Author(s). Published by Elsevier Inc. This is an open access article under the CC BY license (http://
under different frequencies and amplitudes. Dataset (a) has not been explored thus far in any
publications.
The datasets (a) and (b) are provided in two comma separated values (CSV) files. In these files,
which can be visualized in any text editor, each line refers to a sampling time instant. Both CSV files are
zipped in a single file, which is provided as a supplement to this article. In this zip file, there is also a
MATLAB code to plot the data. It is possible to find below a detailed description of both datasets,
ac-cording to their filename:
(a) h50us.csv: this dataset contains 200,001 measurements sampled in time every 50
microsec-onds. The second, third, and fourth columns are respectively the vector with time, output
displacement, and input voltage. The measurements are drifted, so a pre-processing is needed
(in the code provided this is already arranged).
(b) hysteresis_v_150_1hz.csv: the second dataset has the same file structure with respect to the
columns as (a) but measured every 20 milliseconds with 50,001 samples. The sinusoidal signal
starts at approximately 3.25 seconds, so the first samples of the dataset should be discarded (in
the code provided this is already arranged).
Specifications Table
Subject Control and Systems Engineering
Specific subject area System identification and hysteresis modelling Type of data Deflection and displacement measurements How data were acquired Optical sensors
Data format Raw
Parameters for data collection The piezoelectric actuator was excited using a sine driving voltage. The amplitudes and frequencies tested were 5V and 150 V and 300Hz and 1 Hz, respectively.
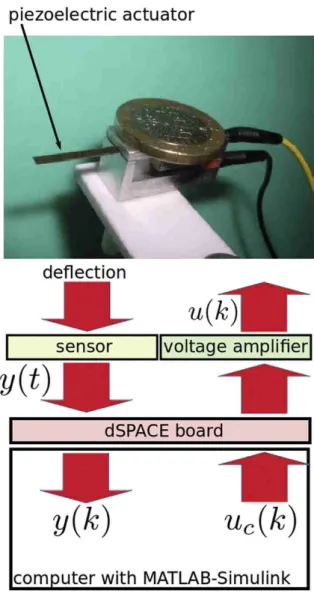
Description of data collection The entire test bench constructed to collect data is composed of (a) the piezoelectric actuator, (b) an optical sensor (LK2420 from Keyence company) which is employed to measure the deflection (displacement) of the above actuator and has been tuned to have 10nm resolution and in excess of 5kHz bandwidth, (c) a computer which is used to generate the sine driving voltage and to acquire the measurement from the optical sensor, (d) a dSPACE (type DS1104) acquisition board that serves as digital-to-analogic and as analogic-to-digital converters between the computer and the rest of the physical setup, with sampling period set as 50
m
s, and (e) a high voltage amplifier that multiplies by 20 thedriving voltage from the computer before sending it to the actuator. Data source location Institution: ENIT/Toulouse University, University of Toulouse
City/Town/Region: Tarbes Country: France
Data accessibility With the article
Related research article Helon Vicente Hultmann Ayala, Didace Habineza, Micky Rakotondrabe, Leandro dos Santos Coelho, Nonlinear Black-box System Identification through Coevolutionary Algorithms and Radial Basis Function Artificial Neural Networks, Applied Soft Computing, vol. 87, 105990, 2020.
Value of the Data
! The dataset provided is important for nonlinear modelling of hysteretic systems
! Researchers in the system identification community at large may benefit for testing nonlinear modelling techniques. Researchers and engineers working with piezoelectric actuators for high precision positioning applications may also be interested with and benefit from the data.
! The present dataset enable comparison among methods for modelling a phenomenon that is frequently found in posi-tioning applications, but not only.
H.V. Hultmann Ayala et al. / Data in brief 29 (2020) 105175
Datasets (a) and (b) characteristics are summarized in
Table 1
and depicted graphically in
Fig. 1
. They
are sampled at different rates as the dynamics due to the excitation is faster in case (a). It is possible to
see that the voltage amplitudes and frequencies are different for each file, as
Table 1
shows.
None-theless, the amplitudes for the deflections are in the same order of magnitude, as the input/output gain
for each frequency is different for the system. For the sinusoidal-like type of input, it is possible to plot
the graph with input versus output through time, where the hysteretic behaviour can be clearly
observed.
2. Experimental design, materials, and methods
A schematic of the experimental benchmark setup is described in
Fig. 2
. The components used in
this setup are described in detail in
Table 2
. The piezoelectric micromanipulator is manufactured with
Table 1
Dataset characteristics for each file provided.
Dataset Input Amplitude [V] Input Frequency [Hz] Sampling Frequency [kHz] Time [s]
(a) 5 300 20 10
(b) 150 1 5 10
Fig. 1. Input and output data for case (a) e top - and (b) - bottom. On the left we see the time histories for both input and output and on the right the semi-static curves (input vs. output) are given.
15 " 2 x 0.3 (length, width, and thickness, in millimetres), where the piezoelectric and passive layers
have, respectively, 0.2 and 0.1 mm. For a real picture of the setup with the measurement device, please
refer to
Fig. 3
.
The dataset is provided with a MATLAB code (read_plot_data.m) that reads the data into memory
and plots the graphs given in
Fig. 1
.
Fig. 2. Schematic of the measurement setup and the data flow among its components.
Table 2
Hardware used for instrumentation of the test bench and respective purpose description. Hardware Manufacturer Purpose
DS1104 dSPACE - converts the sine driving voltage generated from MATLAB-Simulink in the computer into analogic voltage outside the computer,
- converts the measured displacement from the sensor into numeric measurement inside MATLAB-Simulink.
LK2420 Keyence Optical sensor that measures the deflection (displacement) of the piezoelectric actuator.
A400DI FLC Amplifies the voltage from the acquisition board and computer before driving the piezoelectric actuator.
Computer
(with MATLAB-Simulink)
Any MATLAB-Simulink has been used to program the voltage to be amplified and sent to the actuator and used to save or display the measurement from the sensor.
H.V. Hultmann Ayala et al. / Data in brief 29 (2020) 105175
Acknowledgments
The authors would like to thank the financial support from CAPES (Coordination for the
Improvement of Higher Education Personnel - Brazilian Government) grant no. 88887.163347/2018-00,
the National Council of Scientific and Technologic Development of Brazil – CNPq (Grants number:
303906/2015-4-PQ, 404659/2016-0-Univ, 430395/2018-3-Univ, and 400119/2019-6-ERC) and FA
(Fundaç~
ao Arauc
!aria) PRONEX:042/2018 for their financial support.
Conflict of Interest
The authors declare that they have no known competing financial interests or personal
relation-ships that could have appeared to influence the work reported in this paper.
Appendix A. Supplementary data
Supplementary data to this article can be found online at
https://doi.org/10.1016/j.dib.2020.105175
.
References
[1] Helon Vicente Hultmann Ayala, Didace Habineza, Micky Rakotondrabe, Leandro dos Santos Coelho, Nonlinear Black-Box System Identification through Coevolutionary Algorithms and Radial Basis Function Artificial Neural Networks, Appl Soft Computing (2020).https://www.sciencedirect.com/science/article/abs/pii/S1568494619307719.
[2] Helon Vicente Hultmann Ayala, Didace Habineza, Micky Rakotondrabe, Carlos Klein, Leandro S. Coelho, Nonlinear black-box
system identification through neural networks of a hysteretic piezoelectric robotic micromanipulator, IFAC-PapersOnLine
48 (28) (2015) 409e414.
H.V. Hultmann Ayala et al. / Data in brief 29 (2020) 105175