TRF2: A new target for telomere dysregulation in human lymphoid
cells
Par
Joannie St-Germain
Département de Microbiologie et d’Infectiologie
Mémoire présenté à la Faculté de Médecine et des Sciences de la Santé
en vue de l’obtention du grade de Maître ès sciences (M. Sc.) en
Microbiologie
Sherbrooke, Quebec, Canada
Date: 15 June 2018
Membres du jury d’évaluation
Pr. Raymund Wellinger, Département de Microbiologie et
d’Infectiologie
Pr. Hans Knecht, Département de Médecine
Pr. Alfredo Menendez, Département de Microbiologie et
d’Infectiologie
RÉSUMÉ
TRF2: A new target for telomere dysregulation in human lymphoid cells Par
Joannie St-Germain du Programme de Microbiologie
Mémoire présenté à la Faculté de médecine et des sciences de la santé en vue de l’obtention du diplôme de maître ès sciences (M.Sc) en microbiologie, Faculté de médecine et sciences
de la santé, Université de Sherbrooke, Sherbrooke, Québec, Canada, JIH 5N4 LMP1 est une protéine oncogène qui est observée dans les cellules tumorales dans le lymphome de Hodgkin associé au virus d'Epstein-Barr (EBV). LMP1 est responsable de
l'interaction et / ou de l'interférence avec plusieurs voies de signalisation. Certaines de ces voies finiront par affecter l'activité transcriptionnelle de nombreux gènes en activant et en réprimant leurs promoteurs. Dans les cellules de lymphome hodgkinien EBV-négatives et EBV-positives, des expériences antérieures ont découverts des fusions-extrémitées chromosomiques, des translocations, des duplications chromosomiques et un dysfonctionnement des télomères. Le complexe Shelterin, composé des six sous-unités TRF1, TRF2, RAP1, TIN2, POT1 et TPP1, est associé à la formation de la structure de la boucle T-loop au niveau des télomères, formant ainsi un embout pour les chromosomes. Notre laboratoire a montré que l'expression de LMP1 induit une régulation négative des composants de Shelterin TRF1, TRF2 et POT1 au niveau
transcriptionnel. Dans le complexe Shelterin, le TRF2 s'est avéré être la principale protéine affectée par l'induction de LMP1. Il a été montré que lorsque la protéine TRF2 conduite par myc est réintégrée dans une lignée cellulaire exprimant la protéine oncogène LMP1, cette LMP1 n'a plus d'effet sur sa régulation. Mon projet de maîtrise visait à comprendre comment LMP1 régule TRF2 au niveau de son promoteur. Notre hypothèse est que LMP1 interfère avec TRF2 au niveau du promoteur puisque les niveaux d'ARN de TRF2 sont réversibles lorsque LMP1 est supprimée. Plusieurs constructions de promoteurs de TRF2 fusionnées avec un gène rapporteur GFP ont été introduites dans une lignée cellulaire LMP1-tet-OFF et le niveau d'expression du gène rapporteur a été analysé par Western blot. Par cartographie appropriée de la région
promotrice, un fragment de 30 pb du promoteur TRF2 a été identifié jouant un rôle central dans sa régulation. En utilisant la sequence du promoteur de 30 pb, une sonde radiomarquée a été créer. Un EMSA a été réalisé avec des extraits nucléaires provenant de cellules qui ont été induites ou non induites par LMP1. Les résultats révèlent des bandes distinctes et spécifiques pour des extraits nucléaires induits par LMP1 et non induits par LMP1 in vitro. Un séquençage de l'ARN avec un extrait cellulaire total a été réalisé pour obtenir des données sur les gènes qui sont régulés à la baisse et régulés à la hausse en présence de LMP1. Cela a été fait pour
déterminer la composition dynamique cellulaire en l'absence et la présence de LMP1. Avec ces nouvelles données, une région spécifique sur le promoteur de TRF2 pour la régulation a été analysée par chromatographie d'affinité d'ADN et spectrométrie de masse. La découverte de protéines régulatrices du promoteur TRF2 aura un grand impact sur la compréhension des mécanismes régulateurs en jeu pour l'abondance de TRF2 in vivo.
II SUMMARY
LMP1 is an oncogenic protein that is observed in tumor cells of Epstein-Barr virus (EBV)-associated Hodgkin’s lymphoma. LMP1 is responsible for interacting and/or interfering with multiple signaling pathways. At least some of those pathways will eventually affect transcriptional activity on many genes by activating and repressing their promoters. In EBV-negative as well as EBV-positive Hodgkin lymphoma cells, previous experiments uncovered chromosomal end-fusions, translocations, chromosomal duplications and telomere dysfunction. The Shelterin complex, consisting of the six subunits TRF1, TRF2, RAP1, TIN2, POT1 and TPP1, is associated with the formation of the T-loop structure at telomeres, thus forming an end cap for chromosomes. Our lab showed that expression of LMP1 induces a downregulation of the Shelterin components TRF1, TRF2 and POT1 at the transcriptional level. In the Shelterin complex, TRF2 was found to be the major protein affected by the induction of LMP1.
It was shown that when a myc-driven TRF2 is reintegrated into a cell line expressing LMP1 oncogenic protein, that LMP1 had no longer effect on its regulation. My master’s project focused on understanding how LMP1 regulates the TRF2 at its promoter level. Our hypothesis is that LMP1 interferes with TRF2 at the promoter level since TRF2 RNA levels are reversible when LMP1 is suppressed. Several TRF2 promoter constructs fused with a GFP reporter gene were introduced into a LMP1-tet-OFF cell line and reporter gene expression level were monitored using Western blot. In that way, a LMP1-induced transcriptional shutdown could be documented. By appropriate mapping of the promoter region, a 30bp fragment of the TRF2 promoter was identified to play a pivotal role in this regulation. Using this 30bp as a dsDNA radio-labelled probe, EMSA was performed with nuclear extracts from cells that were induced or uninduced to express LMP1. The results reveal distinct and specific bands for LMP1-induced and LMP1-uninduced nuclear extracts in vitro. An RNA seq on the total cell extract was performed to obtain data of the genes that are downregulated and upregulated in the prescence of LMP1. This was done to determine the cellular dynamic composition in the absence and presence of LMP1-induction. These new data outline a specific region on the promoter of TRF2 for regulation that was analyzed by DNA affinity chromatography and mass spectrometry. The finding of regulator proteins of the TRF2 promoter will have great impact in understanding the regulatory mechanisms at play for TRF2 abundance in vivo.
III List of Tables and Figures
Tables:
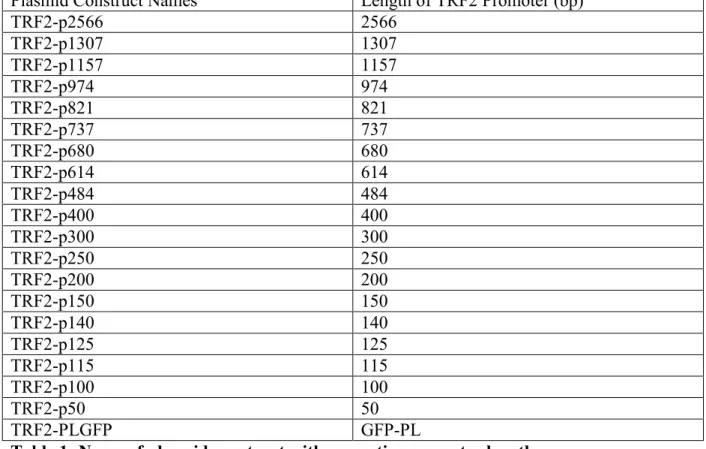
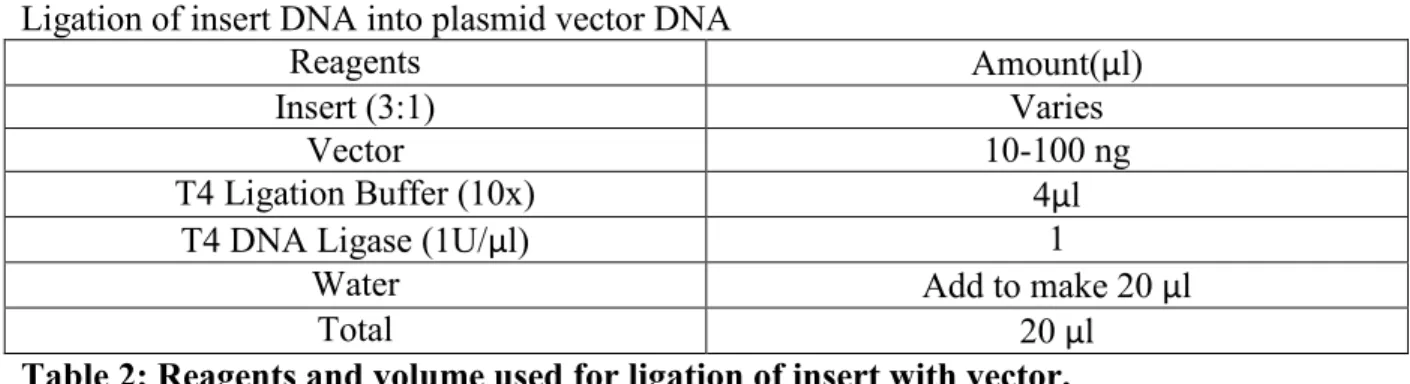
Table 1: Name of plasmid construct with respective promoter length. Table 2: Reagents and volume used for ligation of insert with vector. Table 3: Reagents and volume used for circularization ligation.
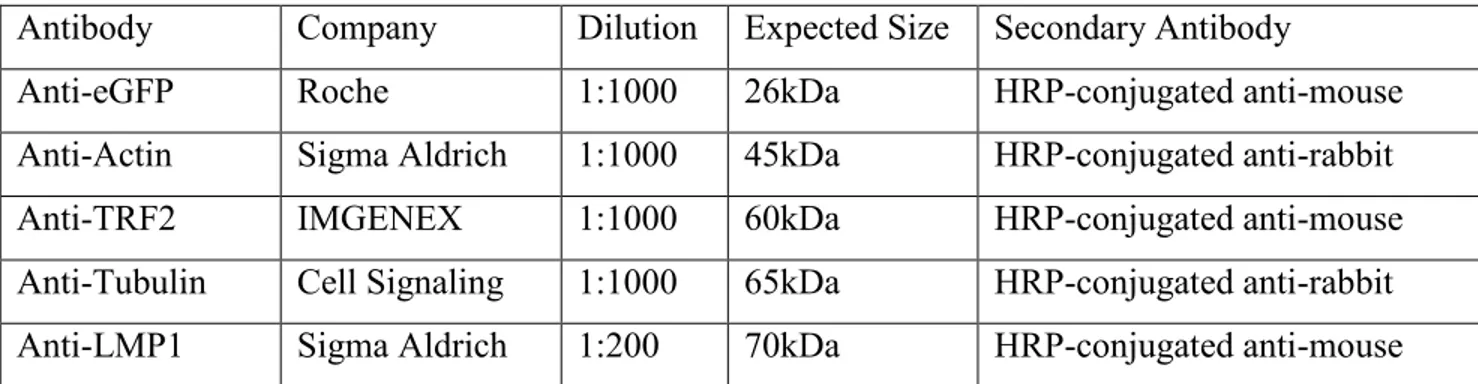
Table 4: Primary antibodies with their properties for Western Blot usage. Table 5: Secondary antibody and dilution.
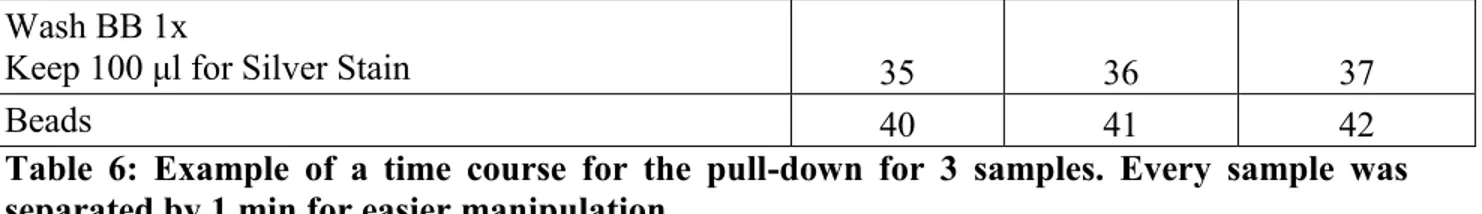
Table 6: Example of a time course for the pull-down for 3 samples. Every sample was separated by 1 min for easier manipulation.
Table 7: Primers used in this study
Table 8: RNA-Seq data of the most downregulated genes in LMP1-induced BJAB tTA LMP1 cells.
Table 9: Common motifs found in promoters of TRF2 and 119 downregulated genes.
Table 10: Motifs found with bioinformatics and its regulation in the presence of LMP1-induction in the RNA-Seq sample
Table 11: Proteins found in both No LMP1 and LMP1 sample with no apparent change in the mass spectrometry analysis and that are sequence-specific DNA binding proteins.
Table 12: Top 10 proteins found in mass spectrometry for sample with No LMP1 induction (+Tet) that are either core promoter binding proteins or sequence-specific DNA binding proteins. Table 13: Top 10 proteins found in mass spectrometry in sample induced with LMP1 (-Tet) that are either core promoter binding proteins or sequence-specific DNA binding proteins.
Table 14: Downregulated genes in the presence of LMP1-induction found via RNA Seq Table 15: Upregulated genes in the presence of LMP1-induction found via RNA Seq
Table 16: The 293 specific proteins found in the group No LMP1 from Mass Spectrometry pull-down during DNA Affinity chromatography
Table 17: The 144 specific proteins found in the group LMP1 from Mass Spectrometry pull-down during DNA Affinity chromatography
Figures:
Figure 1: Telomeric structure.
Figure 2: Cellular effects of TRF2 mutations.
IV Figure 4: Model of cancer initiation
Figure 5: Origin of Hodgkin and Reed-Sternberg cells.
Figure 6: Correlation of telomere dysfunction and of RS-cell formation. Figure 7: Histology of cells transfected with LMP1.
Figure 8: LMP1 structure and targeted pathway.
Figure 9: LMP1 expression in BJAB tTa LMP1 cell line.
Figure 10: Quantitative reverse-transcriptase polymerase chain reaction analysis of the TRF2 mRNA upon LMP1 expression and suppression.
Figure 11: LMP1 increases multinucleation but expression of mycTRF2 eradicates multinuclearity in the presence of LMP1
Figure 12: Schematic representation of LMP1 possibly interfering with TRF2 at its promoter region.
Figure 13: Tet-Off system
Figure 14: pJSTG-GFP plasmid construct Figure 15: Fluorescence microscopy
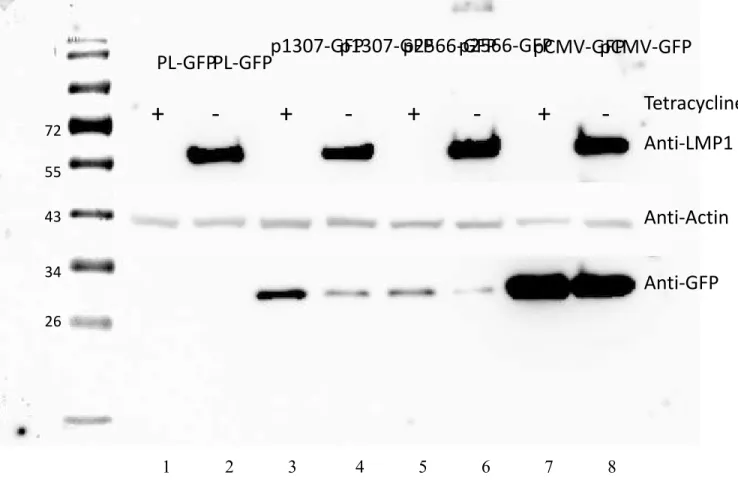
Figure 16: Graph depicting the transfection analysis of pCMV-GFP using BJAB tTA cell line Figure 17: Western blot of TRF2 promoter analysis
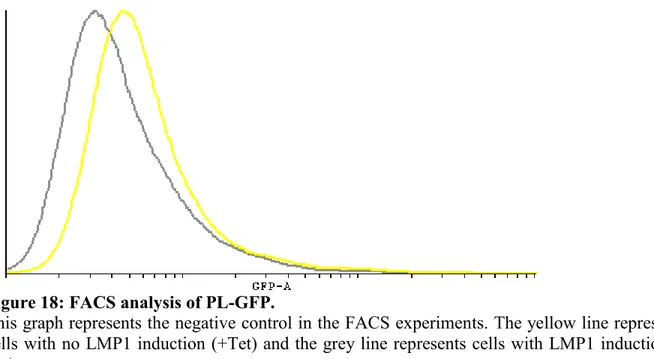
Figure 18: FACS analysis of PL-GFP
Figure 19: FACS Analysis of PL-GFP and CMV-GFP
Figure 20: FACS analysis of negative and positive controls versus p2566-GFP Figure 21: FACS analysis of negative and positive controls versus p1307-GFP.
Figure 22: RT-qPCR results of quantification of mRNA GFP in the BJAB tTA LMP1 cells transfected with the different promoter constructs
Figure 23: RT-qPCR quantification of mRNA TRF2 Figure 24: RT-qPCR quantification of mRNA LMP1
Figure 25: ddPCR analysis of expression levels of GFP RNA using primers GFP F16-R16 Figure 26: ddPCR analysis of expression levels of GFP RNA using primers GFP F18-R18 Figure 27: ddPCR analysis of expression levels of LMP1 RNA
Figure 28: ddPCR analysis of expression levels of TRF2 RNA
Figure 29: Western Blot of BJAB tTA LMP1 transfected with TRF2 promoter plasmids containing different promoter lengths.
V Figure 30: Western Blot of BJAB tTA LMP1 transfected with TRF2 promoter plasmid containing different promoter lengths.
Figure 31: Western Blot of BJAB tTA LMP1 transfected with TRF2 promoter plasmid containing different promoter lengths.
Figure 32: Western Blot of BJAB tTA LMP1 transfected with TRF2 promoter plasmid containing different promoter lengths.
Figure 33: Quantification of three independent western blots for GFP analysis. Figure 34: Electrophoretic-mobility shift assay (EMSA) with the 30bp dsDNA
Figure 35: Silver stain from sample obtained after DNA affinity chromatography experiment. Figure 36: Schematic chart analysis of the Mass Spectrometry results of No LMP1 versus LMP1 samples from DNA Affinity Chromatography experiments.
VI Table of Contents
Introduction ... 1
Importance of Telomere Function and the Shelterin Complex ... 1
Telomere Integrity and Cancer ... 4
Hodgkin Lymphoma (HL) ... 7
Cellular Origin of B cells including HRS cells ... 7
Origin of Reed-Sternberg cells ... 9
Pathogenic role of Epstein-Barr Virus and its trans-membrane protein called “Latent Membrane Protein 1” (LMP1) ... 11
Epstein-Barr virus positive Hodgkin Lymphoma ... 14
Hypothesis and Objectives ... 17
Materials and Methods ... 19
Cell Lines ... 19
Manipulation of cell lines ... 20
DNA Extraction Protocol ... 21
Plasmid Construction ... 21 Electrophoresis Gel ... 23 Ligation ... 23 Enzyme Digestion ... 24 Klenow Treatment ... 24 Bacteria Transformation ... 25
BJAB tTA/LMP1 Transfection ... 25
Flow Cytometry ... 26
Fluorescent Microscopy ... 27
Western Blot ... 27
RNA Analysis ... 28
Nuclear Extraction Protocol ... 28
5’ γ-ATP32 labelling... 29
Annealing of Oligonucleotides ... 29
EMSA ... 30
DNA Affinity Chromatography (Pull-Down) Assay for DNA-Protein Affinity ... 30
VII
Primers used in this study ... 33
Results-Chapter 1 ... 35
Preamble ... 35
pTRF2-GFP Construct and Transfection Optimization ... 35
Western Blot Analysis of promoter regulation via GFP protein levels ... 38
Analysis of GFP through Flow Cytometry ... 40
RT-qPCR analysis of GFP mRNA ... 42
GFP mRNA analysis through ddPCR ... 45
Results-Chapter 2 ... 50
Preamble ... 50
Identification of a promoter region affected by LMP1-induction ... 50
Electrophoretic-mobility shift assay (EMSA) ... 57
RNA Sequencing ... 59
DNA Affinity Chromatography ... 62
Discussion and Conclusions ... 69
LMP1-induction affects TRF2 at its promoter... 69
Identifying a smaller region of TRF2 affected by LMP1-induction ... 72
RNA Sequencing Analysis ... 73
Protein Analysis on promoter region between -130bp and -100bp ... 74
VIII List of Symbols, Abbreviations, and Acronyms
°C: Degrees Celsius μg: Microgram μl: Microliter μM: Micromolar
3’: 3’ Extremity of a nucleotide, free OH group on the 3’ carbon of ribose ring
5’: 5’ Extremity of a nucleotide, free OH group or phosphate ester on 5’ carbon of ribose ring ALL-RW: all-around the world PCR
ATM: Ataxia telangiectasia mutated ATR: Rad3-related
B: Base(s)
BB: Binding buffer Bp: Base pair(s)
BJAB: Burkitt lymphoma cell line B&W: Bind and wash buffer
BSA: Bovine Serum Albumin solution
CHAPS detergent: (3-((3-cholamidopropyl) dimethylammonio)-1-propanesulfonate) cHL: Classical Hodgkin lymphoma
CMV: Cytomegalovirus
ddPCR: Droplet digital polymerase chain reaction DDR: DNA Damage Repair
DMSO: Dimethyl sulfoxide DNMT: DNA methyltransferase DNA: Deoxyribonucleic acid
dNTP: Deoxynucleoside triphosphate DTT: Dithiothreitol
EBNA1: EBV nuclear antigen 1 EBV: Epstein-Barr virus
ECL: Electrochemiluminescence or electro generated chemiluminescence EDTA: Ethylenediaminetetraacetic acid
EMSA: Electrophoretic mobility shift assay FBS: Fetal Bovine Serum
GC: Germinal center
GFP: green fluorescent protein
HEPES: 4-(2-hydroxyethyl)-1-piperazineethanesulfonic acid HL: Hodgkin Lymphoma
HRP: Horseradish peroxidase
HRS: Hodgkin and Reed-Sternberg cells JAK: Janus kinase
JNK: C-Jun N-terminal kinase Kb: Kilobases
kDa: KiloDalton
KCl: Potassium chloride LB: Luria Broth medium
IX LMP2A: Latent membrane protein 2 a
M: Molar
MCS: Multi-cloning site Mg: Milligram
MgCl2: Magnesium chloride Min: Minute
Mini-prep: Mini-preparation of plasmid DNA Ml: milliliter
Mm: millimeter Mmole: millimole
MMS: Methyl methanesulfonate mRNA: Messenger ribonucleic acid MS: Mass Spectrometry
m/v: Mass per volume NaCl: Sodium chloride NaOAc: Sodium acetate NE: Nuclear extract
NEB: New England Biolabs
NF-κB: Transcription factor nuclear factor κB ng: Nanograms
NHL: Non-Hodgkin lymphoma NHEJ: Non-homologous end joining Nm: Nanometer
nM: Nanomolar Nt: Nucleotide
ORF: Open Reading Frame PBS: Phosphate-buffered saline
PBS-T: Phosphate-buffered saline with 0.1% Tween-20 PCR: Polymerase Chain Reaction
pH: Measure of acidity or basicity of a solution PMSF: Phenylmethylsulfonyl fluoride
PNK: Polynucleotide 5'-hydroxyl-kinase POT1:Protection of telomeres 1
RAP1: Repressor/activator protein 1 RNA: Ribonucleic acid
RNase: Ribonuclease
RPM: Revolutions per minute
RPMI 1640: Roswell Park Memorial Institute medium RS: Reed-Sternberg cells
RT: Room Temperature
RT-qPCR: Real-time PCR quantification STAT: Signal transducer of activation SDS: Sodium dodecyl sulfate
SDS-PAGE: SDS-Polyacrylamide Gel Electrophoresis
TAE: 40 mM Tris, 20 mM glacial acetic acid, 1 mM EDTA pH 8.0 TBE:Tris base, boric acid and EDTA
X TCA: Trichloroacetic acid
TERC: Telomerase RNA Component TERT: Telomerase Reverse Transcriptase Tet: Tetracycline
TIN2:TRF1-interacting nuclear factor 2 TPP1:Tripeptidyl-peptidase I
TRE: Transactivator response element TRF1: Telomeric repeat-binding factor 1 TRF2: Telomeric repeat-binding factor 2 tTa: Tetracycline transactivator
v/v: Volume per volume V: Volt
XI Acknowledgments
I’d like to thank Raymund Wellinger for accepting me in his lab for giving me the opportunity to work with such a great mind in the field of telomere biology. Not only was he an exceptional mentor but he also helped me with my greatest fear, public speaking. I would never have imagined that I would be able to so confidently present my project in both my master seminars and speak at the 4th Canadian Symposium on Telomeres and Genome Integrity Symposium. I would also like to thank Bruno Lemieux for supervising my project and also giving me great expert advice. I’d like to especially thank Erin for being a great office partner and also correcting my memoire. I’d like to thank Dr. Hans Knecht for being my co-director in this project. I would also like to thank Pr. Alfredo Menendez and Pr. Martin Bisaillon for agreeing to be part of my jury.
1 Introduction
The goal of this study is to understand the impact of LMP1 on telomeres, more specifically, the telomeric protein TRF2, in the context of Hodgkin Lymphoma (HL). The study will focus on TRF2’s promoter, and the regulation thereof in the context of a virus-associated cancer.
Importance of Telomere Function and the Shelterin Complex
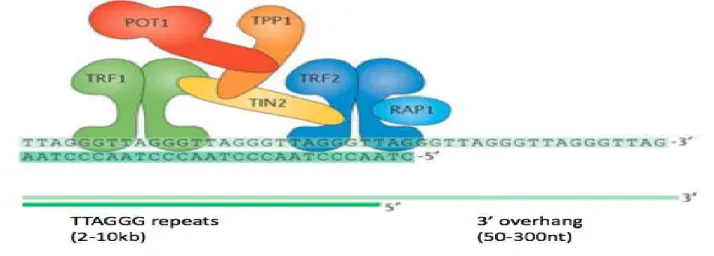
Telomeres are unique structures found at the physical ends of linear eukaryotic chromosomes, which have multiple functions in preserving chromosomal stability, including protecting the ends of chromosomes from degradation and end to end fusion (Bailey & Murname, 2006). Telomeric functions depend on three important factors: telomeric DNA, the shelterin complex and telomerase. In humans and mice, the telomeric ends are composed of 2-30 kb of double-stranded TTAGGG repeats with the termini carrying a long 75-200 nt single-stranded overhang (Figure 1). The telomeric DNA is protected by the shelterin complex, which is comprised of several specific proteins that either bind telomeric DNA directly or are associated with telomeric chromatin (Maciejowski & de Lange, 2017). More specifically, the shelterin complex consists of the proteins TRF1, TRF2, POT1, TINT1/PTOP/PIPI (TPPI), RAP1, and TIN2 (Figure 1) (Palm & de Lange, 2008).
Figure 1: Telomeric structure.
A protein complex called shelterin forms the constitutive telomere architecture that is required for vital telomere function. The shelterin complex consists of six proteins, TRF1, TRF2, TIN2,
2 Rap1, TPP1 and POT1. TRF1 and TRF2 directly bind double strand telomeric DNA with high affinity, TIN2 binds both TRF1 and TRF2 to stabilize their association; Rap1 interacts with TRF2 and improves its selective binding to telomeric DNA while POT1 binds single strand telomere DNA. The 3’ single strand overhang facilitates T-loop formation (Adapted from Maciejowski & de Lange, 2017).
The shelterin complex is recruited to the telomeres through TRF1 and TRF2 binding to the double-strand telomeric DNA and TIN2 that serves as a linker between the two homodimers. POT1 binds to the single stranded DNA and is linked to TRF1 and TRF2 through TPP1, which is associated with TIN2 (Maciejowski & de Lange, 2017).
The six components of the shelterin complex are responsible for formation of the t-loop structure (Griffith et al., 1999) which protects telomeres by repressing the DNA damage response (DDR) and repair pathways: the ATM kinase signaling pathway and non-homologous end joining (NHEJ) (Benarroch-Popivker et al., 2016). T-loops are formed through strand invasion of the single-stranded (ss) 3’ telomeric overhang into the double-stranded (ds) part of the telomere, thereby forming a three-way junction at the base of the t-loop (Schmutz, Timashev, Patel & de Lange, 2017). This way, a telomeric DNA end is shielded from the DDR factors. The 3’ overhang required for the t-loop formation is made by exonucleolytic degradation of the 5’ ends of the telomeres, which therefore, shortens telomeres by about 50 bp per cell division (de Lange, 2005). Telomere shortening can be counteracted by telomerase which adds telomeric repeats at the end of the chromosome (Greider & Blackburn, 1987). Telomerase is a reverse transcriptase that synthesizes telomeric DNA using the integral RNA as the template and the 3’end of the telomere as the primer (Chan & Blackburn, 2002). Human telomerase is composed of a catalytic subunit TERT, an RNA component TERC and multiple accessory factors required for the activity of telomerase and its recruitment to telomeres (Cohen et al., 2007). During human development, telomerase will become deactivated through the downregulation of TERT (Holysz, Lipinska, Paszel-Jaworska & Rubis, 2013). As a result; somatic cells will undergo telomere shortening after each cellular division (Maciejowski & de Lange, 2017). This process of telomeric shortening will lead to the loss of telomeric DNA, chromosomal deprotection and activation of DDR pathways, which in turn leads to cell cycle arrest, senescence or apoptosis (Oeseburg, de Boer, van Gilst & van der Harst, 2009). Unlike normal cells, cancer cells will be under constant stress such as oncogenic stress, genomic instability and activation of apoptosis pathways. However, these cells escape apoptosis via genetic inactivation of certain pro-apoptotic
3 genes such as inactivation of BH3-only or caspase genes (Boyd et al., 1995). As a result, many cancer cells accumulate chromosomal abnormalities that are the direct result of telomere dysfunction due to inhibition of apoptosis (Mai & Garini, 2005).
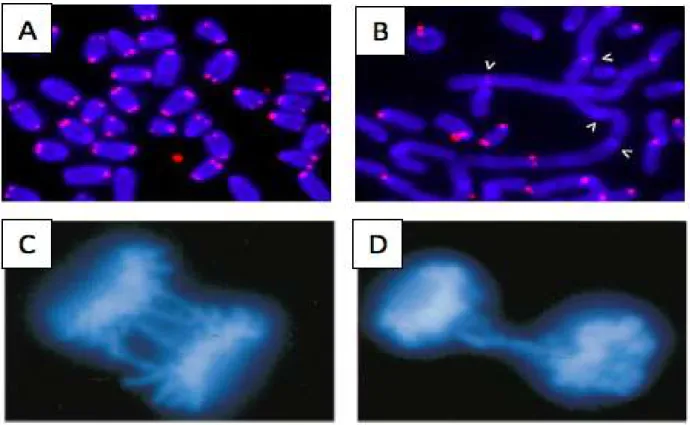
TRF2 is the main shelterin component required for proper configuration of the telomeric t-loop, repression of DNA damage repair mechanisms at telomeres, and hence, protection of telomeres from fusions during cellular division. Deletion of the TRF2 protein has been shown to lead to chromosomal end fusion, DNA bridges, lagging chromosomes and giant, dicentric chromosomes during metaphase and anaphase (Figure 2) (van Steensel, Smogorzewska & de Lange, 1998; de Lange, 2005). This shows the importance that the shelterin complex plays in telomeric integrity and genome stability overall.
Figure 2: Cellular effects of TRF2 mutations.
a) Metaphase chromosomal spread, b) Metaphase chromosomal spread with removal of TRF2 by shRNA displaying DNA fusion, c) and d) Anaphase cells displaying TRF2 mutant missing its Myb domain induced bridges and lagging chromosomal in which the DNA was stained with DAPI (Adapted from van Steensel et al., 1998, Rai, Chen, Lei & Chang, 2016)
4 Telomere Integrity and Cancer
Due to the lack of telomerase activity in somatic cells, telomeres will shorten with each cellular division (Watson, 1972). This is a consequence of the telomeric end replication problem. In eukaryotes, DNA replication occurs via the leading and lagging strand synthesis. The leading strand is replicated in a continuous fashion by extension of a single RNA primer. The opposite lagging strand is replicated in short sections called Okazaki fragments and therefore requires multiple RNA primers. (Badaracco, Bianchi, Valsasnini, Magn & Plevani, 1985; Frick & Richardson, 2001). These primers are subsequently substituted with DNA due to the extension of the downstream Okazaki fragment (Balakrishman & Bambara, 2013). When the terminal RNA primer at the telomeric 3’ end is removed, it cannot be replaced by DNA resulting in a short 3’-overhang. This process will be repeated in every consecutive round of replication, leading to the decrease in telomere length. Eventually, telomeres will become too short for shelterin proteins to bind, causing a loss of telomere protection and activation of DDR signaling pathway (Harley, Futcher & Greider, 1990). The DDR will in turn trigger activation of tumor suppressor mechanisms such as ATM, NHEJ, p53 and p16, driving cells into G1 arrest and inducing senescence or apoptosis (Figure 3) (d’Adda di Fagagna et al., 2003). Therefore, these tumor suppressor mechanisms are in place to eliminate and prevent the growth of cancerous cells (Yao & Dai, 2014).
5 Figure 3: Telomeric integrity and role of the shelterin complex during cellular divisions. Telomeres are bound by the shelterin complex and with each cellular division, telomeres get shorter. If telomeres get too short, the shelterin complex will not bind, causing telomeric deprotection and activating the DDR pathway forcing the cells into senescence or apoptosis (Adapted from Jacobs, 2013).
There is a dynamic relationship between telomeres and genomic stability. The genome is susceptible to exogenous, endogenous and multiple other cellular processes that can compromise its integrity (Jackson & Bartek, 2009). Important mechanisms have been put into place to protect the genome from damage and instability (Nair, Shoaib & Sorensen, 2017). DDR mechanisms are the first responses to any genomic damage and tight regulation of these mechanisms is required (Ciccia & Elledge, 2010). Defects in DDR pathways such as a loss of function of p53, ataxia telangiectasia (ATM), or Rad3-related (ATR) kinases are associated with tumor initiation as well as tumor progression and metastasis (Broutas & Lieberman, 2014). Genomic and telomeric instability both interact closely in tumorigenesis. TRF2 mediates t-loop formation and maintenance, thus sequestering DDR pathways and protecting the telomeric ends from being processed by the NHEJ. When it comes to telomeric end deprotection due to short telomeres, the ATM-dependent pathway will become activated, inducing NHEJ and generating telomeric end fusions. However, functional DDR will drive cells into apoptosis, thus stopping propagation of genetically unstable cells. On the other hand, in the absence of the DDR pathway, cells will not
Senescence Or Cell Death C el lu la r D iv is io n Telomere Shortening
6 be forced into senescence or apoptosis but instead, will continue into division, initiating chromosomal instability (Figure 4) manifested by chromosomal translocations, duplications, chromosome loss, endomitosis and polyploidization (Davoli & de Lange, 2012). Pre-malignant cancer cells need to acquire a telomere maintenance mechanism during neoplastic transformation and for proliferation (Yakoob, Hu, Fan & Zhang, 1999). Telomerase reactivation may occur in late tumorigenesis as a result of ongoing genetic instability. It was recently found that a single nucleotide somatic mutation in the proximal promoter of telomerase reverse transcriptase (TERT) was enough for telomerase reactivation (Horn et al., 2013). This discovery emphasized the importance of promoter mutation in the progression of genomic instability in cancer development.
The cell depends on the ability of the DDR checkpoint to induce cell cycle arrest when critically short telomere length is reached. The effectiveness of DDR can either inhibit or promote cancer. Therefore, short telomeres are the earliest detectable hallmark of cancer. One form of cancer in which short telomeres are noticeable in its early stage is Hodgkin lymphoma (Jacobs, 2013).
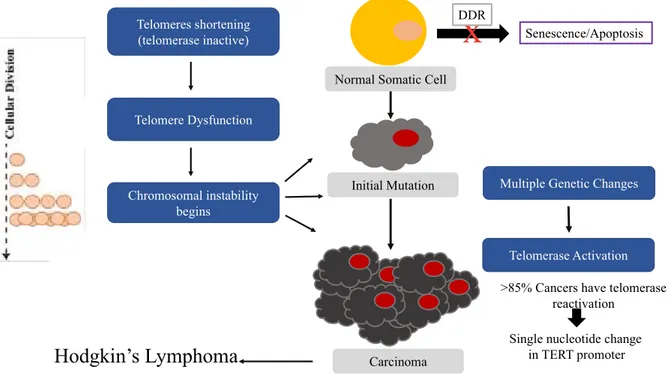
Figure 4: Model of cancer initiation.
Cancer development caused by mutation in the DDR pathway when short telomeres are present. Short telomeres will progress with each cellular division, causing chromosomal instability and genomic instability. Telomerase will be reactivated during late tumorigenesis.
Telomeres shortening (telomerase inactive) Telomere Dysfunction Chromosomal instability begins Telomerase Activation
Normal Somatic Cell
Initial Mutation
Carcinoma
Multiple Genetic Changes
Hodgkin’s Lymphoma
Senescence/Apoptosis
x
Single nucleotide change in TERT promoter >85% Cancers have telomerase
reactivation DDR
7 Hodgkin Lymphoma (HL)
Lymphomas are a group of blood cancers that develop in the lymphatic system. Malignant cells accumulate in the lymphatic system, eventually causing enlargement of the lymph nodes (Ganti, Albershardt, Iritani & Ruddell, 2015). There are two types of lymphomas: the classic Hodgkin lymphomas (cHL) and the Non-Hodgkin-Lymphomas (NHL). The latter are divided into B-NHL and T-NHL (Swerdlow et al. 2016). The Hodgkin lymphomas are characterized by the
mononuclear Hodgkin (H) cells and the diagnostic binucleated or multinucleated Reed-Sternberg (RS) cells. H and RS cells are often summarized as HRS cells. HRS cells do not express the majority of proteins proper to B-cell immunoblasts. A typical characteristic of both are Hodgkin mononucleated cells and multinucleated Reed-Sternberg cells, but contrary to non-Hodgkin lymphoma, cHL does not express the majority of proteins proper to B-cell immunoglobulins. Instead, they display different molecules not normally expressed by B cells (Gobbi, Ferreri, Ponzoni & Levis, 2013). Interestingly, in cHL several transcription factors are deregulated, but not in nHL. The mononucleated and multinucleated cells lack transcription factors such as OCT2, BOB.1 and PU.1, which are required for activation of the promoter or enhancers of immunoglobulin genes. These differences between the immunophenotypes and gene expression clearly puts Hodgkin lymphoma in a different category of lymphomas (Stein & Bob, 2009). Cellular Origin of B cells including HRS cells
B cells are lymphocyte cells that play a crucial role in the immune system response. The main function of B lymphocytes is to produce specific antibodies. Their production and development begins by stimulation by exogenous factors such as bacteria or viruses that activate the production of hematopoietic stem cells in the bone marrow (Tobon, Izquierdo & Canas, 2013). Once exiting the marrow, all B cells are morphologically similar and also referred to as immature B cells (Gathings, Lawton & Cooper, 1977). Immunoglobulins play a critical part in the immune system by recognizing and binding to particular antigens. Antibodies are a form of immunoglobulin secreted by B cells to bind, neutralize, and send a signal to activate other defenses like macrophages to destroy foreign invaders (LeBien & Tedder, 2008). These immature B cells only become activated once the immunoglobulin binds to an antigen. This antigen binding induces B cell-activation, proliferation and differentiation in secondary
8 lymphoid tissues. These dynamic changes in gene expression and immunoglobulin mutation happen in the germinal center follicles of secondary lymphoid organs (Küppers
,
2009). The B cells then undergo rapid proliferation to generate a large number of cells. Subsequently, immunoglobulins undergo somatic hypermutation to generate high-affinity antibodies unique to the antigen of the foreign invaders. This biological process also has a program that eliminates B cells not expressing the correct antibody and forces them into apoptosis (Figure 5). Only B cells harboring favorable mutations with specific antibodies will undergo class-switch recombination and differentiate to become plasma cells or memory B cells. A large number of genes are involved in the regulation of proliferation, differentiation and apoptosis, and can occasionally become dysregulated by errors during antibody gene modifications, thus causing genomic alterations. A series of checkpoints normally control the B-cells’ selection for unfavorable mutations resulting in cellular apoptosis. In some cases, unfavorable B cells avoid apoptosis because of genetic modifications or due to the presence of the Epstein-Barr virus (EBV), thus resulting in oncogenic transformation, resulting in cancers such as Burkitt Lymphoma and Hodgkin Lymphoma (Klein & Dalla-Favera, 2008). In cHL the 5-year survival rate of patients that will become long-term survivors is 85%, but 15% of patients will die from a rapid reoccurrence of the disease or become resistant to drug-therapy (et al., 2011). HL is diagnosed by the presence of multinucleated Reed-Sternberg cells (Shanbhag & Ambinder 2018). With a better understanding of the processes involved in the formation of the Reed-Sternberg cells, we think new drug treatments for treating Hodgkin’s lymphoma may emerge.9 Figure 5: Origin of Hodgkin and Reed-Sternberg cells.
In the germinal center, the antigen-activated B-cells enter proliferation and somatic hypermutation. The somatic hypermutation will diversify B cell immunoglobulin receptors to adapt to the foreign invader, creating rearrangements in the immunoglobulin gene. The B-cells then go through antibody class switching recombination. This will allow the cells to have antigenic specificity with antibodies of different subtypes. The B-cells that have obtained a favorable rearrangement will continue to differentiate into plasma cells or memory B cells. Hodgkin and Reed-Sternberg cells (HRS) are cells that have acquired unfavorable rearrangements and should have undergone apoptosis, but because of genetic alterations or the presence of Epstein –Barr virus (EBV) derived proteins, they have survived (Adapted from Klein & Dalla-Favera, 2008).
Origin of Reed-Sternberg cells
HL is characterized by the presence of the mononuclear H cells, and bi or multinucleated Reed-Sternberg cells (HRS cells). It has been shown that HL cells have a large number of chromosomes with aberrations, genetic alterations, and chromosomal deletions (Knecht et al., 2008). A multitude of translocations have been identified in HRS cells and their nuclear architecture becomes progressively more disorganized as the number of nuclei increases. As well
10 as chromosomal disorganization, HRS also have an increased number of centrosomes, defective spindle formation, and genomic instability. The hallmark of HRS tumor cells is telomeric dysfunction (Knecht, Sawan, Lichtensztejn, Z., Lichtensztejn, D. & Mai, 2010). It is the main mechanism through which mononucleated Hodgkin cells become multinucleated Reed-Sternberg cells, in which the Hodgkin cells increase the disruption of their telomeres, genomic DNA and dynamically progress towards becoming Reed-Sternberg cells. These multinucleated cells are formed by endomitosis, a process in which the cells duplicate their chromosomes but this is not followed by cellular division. This phenomenon is associated with disturbed cytokinesis and jumping translocations due to severe telomere dysfunction. Hans Knecht et al. 2008, provided a 3D telomere analysis diagram on the transition of H to RS cells, providing a direct graphical demonstration for how an H cell becomes an RS cell (Figure 6). This 3D nuclear approach allowed the visualization of telomeric organization as the cells underwent transformation from an H to an RS cell. The mononucleated Hodgkin cells already have distinctive short telomeres, and telomere aggregates. As the cells undergo endomitosis, they will produce binucleated Reed-Sternberg cells, with more telomeric dysfunction such as telomeric aggregates, even shorter telomeres and some losses of telomeric signal (Knecht et al., 2008). This progression continues until the cell reaches the end stage multinucleated Reed-Sternberg cell, in which the cell no longer duplicates its genome, possibly due to extreme telomeric dysfunction and genomic instability (Knecht et al., 2010). Reed-Sternberg cells indeed show little proliferative capacity, thus demonstrating that Hodgkin cells could be the main cells with proliferative ability and the main reason for the generation of these Reed-Sternberg cells (Rengstl et al., 2013). Interestingly, in about 40-50% of cases of HL, patient biopsies of their H and RS cells have been found to express the Epstein Barr virus-encoded LMP1 oncoprotein (Knecht et al., 1993).
11 Figure 6: Correlation of telomere dysfunction and of RS-cell formation.
The model illustrates the evolution from a mononuclear H cell to a multinuclear RS cell. 3D reconstructed representative nuclei and their telomeres. A mononuclear H cell may either progress to a telomere-poor, binucleated RS cell or to a binucleated RS cell with a ‘ghost’ nucleus probably telomere-poor end-stage cells, or progress to a still telomere-rich, binucleated RS cell or large twisted H cell capable of further nuclear duplications. This may result in a trinuclear or tetranuclear RS cell. Depending on the 3D configuration of telomeres and the number of telomere aggregates, these RS cells may or may not be able to perform further nuclear division, resulting in multinucleated end-stage RS cells (Adapted from Knecht et al., 2008).
Pathogenic role of Epstein-Barr Virus and its trans-membrane protein called “Latent Membrane Protein 1” (LMP1)
Epstein-Barr virus (EBV) is a gamma-herpesvirus that establishes life-long sero-positivity and infects 90% or more of the world’s population. Most people become infected at some point in their childhood, with a generally asymptomatic primary infection that can become symptomatic in their adolescence or adulthood, causing infectious mononucleosis (Hau & Tsao, 2017). Rarely, the disease incites a range of malignancies including nasopharyngeal carcinoma, lymphoproliferation disorders and Burkitt lymphoma (Kutok & Wang, 2006). In about 40% of cases of classical HL, the HRS cells are infected with the Epstein-Barr virus, thus indicating an importance of EBV in HL pathogenesis. EBV has a 170kb double-stranded DNA genome that forms an episome in the infected host cell, and exists as an extrachromosomal DNA wrapped
Mononucleated
Hodgkin Cells Binuclear Reed-
Sternberg cells Tetranuclear Reed- Sternberg cells
End Stage Multinucleated Reed- Sternberg cells
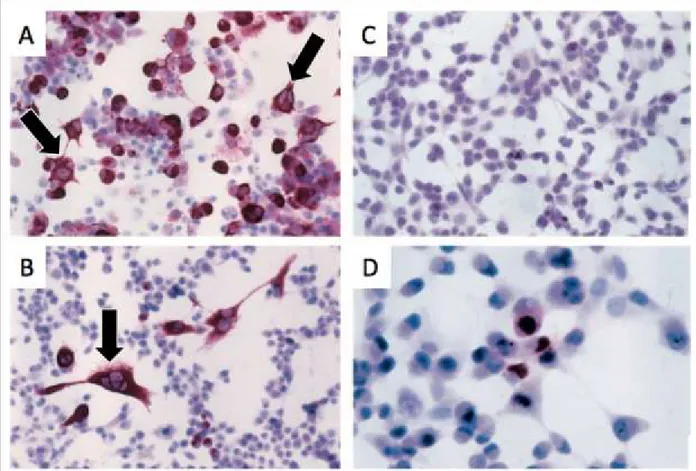
12 with histones. EBV will infect epithelial cells as well as B-lymphocytes (Riley et al., 2012). EBV does not usually replicate in B-lymphocytes, but instead establishes a latent infection, which is characterized by the limited expression of a subset of virus latent genes (Babcock, Hochberg & Thorley-Lawson, 2000). These subsets of individualized latent genes are the three main viral proteins called: EBNA1 (EBV nuclear antigen), LMP1 and LMP2A (Hau & Tsao, 2017). EBNA1 is a mandatory protein responsible for the replication of the viral genome and may have additional roles (Gahn & Sugden, 1995). LMP2A mimics an Ig receptor and recruits cytoplasmic kinases (Mancao & Hammerschmidt 2007). LMP1 is the main viral protein required for B cell immortalization and promotes the formation of Reed-Sternberg cells as shown by Knecht et al. 1999 (Figure 7).
Figure 7: Histology of cells transfected with LMP1.
Impact of LMP1 expression in myelomonocytic HD-MyZ cells. A) represents cells that have been transfected with LMP1, showing evidence of multinucleated cells or cells larger than the normal surrounding cells. B) Immunostaining showing LMP1 expression C) Transfection cells with an empty vector D) Transfection with another viral protein EBNA1 with immunostaining revealing no change of cell morphology. Concluding that LMP1 is the viral protein of EBV causative of the multinucleated cells (Adapted from Knecht et al., 1999).
13 LMP1 is the major transforming protein of EBV and also plays a crucial role in the pleiotropic effects on cellular phenotypes and in the maintenance of EBV-induced tumours (Ahsan, Kanda, Nagashima & Takada, 2005). It is the first protein being produced during EBV latency establishment (Dawson, Tramountanis, Eliopolis & Young, 2002). Functionally, LMP1 resembles CD40, a member of the TNFR family, and can partially substitute for CD40 in vivo, providing both growth and differentiation responses in B cells (Brauninger et al., 2005). The LMP1 protein is a trans-membrane protein of 63 kDa and can be subdivided into three domains: (a) an N-terminal cytoplasmic tail (amino acids 1–23) which tethers and orientates the LMP1 protein to the plasma membrane; (b) six hydrophobic transmembrane loops that are involved in self-aggregation and oligomerization (amino acids 24–186); (c) a long C-terminal cytoplasmic region (amino acids 187–386) that possesses most of the molecule's signaling activity (Uchida et al., 1999). Two functional domains referred to as C-terminal activation regions 1 and 2 (CTAR1 and CTAR2) have been identified for their ability to activate the
NF-κB transcription factor pathway (Eliopoulos, 1999). This effect contributes to the many
phenotypic consequences of LMP1 expression including the induction of various apoptosis inhibition pathways and cytokine genes (Figure 8) (Huen, Henderson, Croom-Carter & Rowe, 1995). LMP1 contributes to 25% of transcriptional changes in HL cells transferase (Vockerodt et al., 2014). It will also modulate the expression of key tumor suppressor genes such as p53 and contributes to cell survival by activating several pathways such as NF-kappa B (NF-kB), JAK/STAT, and P13L/AKT pathways (Hoesel & Schmidt, 2013; Vaysberg, Lambert, Krams & Martinez, 2009). It is also involved in the loss of expression in mitotic spindle formation, disorganizes interphase microtubules, promotes chromosome breaks, promotes cells survival and B cell immortalization and is involved in promoter regulation through methylation by DNA methyl transferase (Vockerodt, Cader, Shannon-Lowe & Murray, 2014). Therefore, LMP1 contributes to cellular dysregulation and tumorigenesis.
14 Figure 8: LMP1 structure and targeted pathway.
Expression in EBV-positive cases, contributing to NF-kB activation as it mimics an activated CD40 receptor which supports survival of the deregulated B lymphoma cells (Adapted from Brauninger et al., 2005).
Epstein-Barr virus positive Hodgkin Lymphoma
The EBV-negative and EBV-positive HRS cells show a distinct somatic mutation pattern underlining that the EBV infection happened in a B-cell in the germinal center (Thorley-Lawson & Gross, 2004). The EBV-positive HRS cells show a similar phenotype: B cell nuclear division becomes impossible with telomeric loss, telomeric shortening, end to end fusions and telomere-poor or telomere-free ‘ghost’ nuclei (Knecht et al., 2010). LMP1 expression was shown to be associated with multinuclearity in which many of the cells resembled RS cells (Figure 9) (Lajoie et al., 2015).
15 Figure 9: LMP1 expression in BJAB tTa LMP1 cell line.
A) cells without LMP1 are showing a stable percentage of bi or multinuclearity and B) cells expressing LMP1 showing a distinctive increase pattern of bi and multinuclearity, C) a graph representing the increase of multinuclearity over a period of 21 days (Adapted from Lajoie et al., 2015).
RS cells are characterized by telomeric disorganization, short telomeres and loss of total telomeres and same morphology can be observed in RS cells associated with LMP1. This led to the hypothesis that LMP1 indirectly interferes with the shelterin complex, thereby initiating the telomeric disruption and assisting in the formation of H and RS cells. To determine if LMP1 expression favored the formation of multinucleated cells, Lajoie et al., 2015 used a system a tet-off inducible LMP1 in a stable BJAB tTa LMP1 cell line lacking chromosomal translocations. LMP1-expressing and LMP1-suppressed BJAB tTa cells, as well as the parental BJAB tTa cell line not harboring the LMP1 oncogene, were analyzed over a period of 21 days for formation of multinucleated cells, (Figure 9 C) and the expression of key proteins of the shelterin complex at the transcriptional, translational, and topographic protein level. The results show that the telomeres and the shelterin complex are responsive to the expression of the LMP1 oncogene (Figure 10).
16 Figure 10: Quantitative reverse-transcriptase polymerase chain reaction analysis of the TRF2 mRNA upon LMP1 expression and suppression.
The TRF2 mRNA levels (in relative units) at days 1, 3, 7, and 14 were normalized with expression of 3 housekeeping genes to the LMP1-suppressed cells at each time point. Yellow bars represent TRF2 levels when LMP1 is expressed. Burgundy bars represent TRF2 levels after the expression on LMP1 was suppressed at day 3 and the blue bar when level of LMP1 suppressed at day 7 (Adapted from Lajoie et al., 2015).
The results also show that LMP1 exerts profound effects on shelterin protein expression, in particular the TRF1, TRF2, and POT1 proteins. TRF2 levels were the most affected when LMP1 was induced in the cells. Continuous LMP1 expression results in downregulation at the transcriptional level and is associated with a highly significant formation of multinucleated RS-like cells (Lajoie et al. 2015). Given that it was previously shown that deletion of TRF2 leads to chromosomal end fusions, bridges, and lagging chromosomes (van Steensel et al., 1998), it was suspected that it might be one of the key players for producing the multinucleated cells. To test this hypothesis, a myc-TRF2 driven by a CMV promoter was introduced into the BJABJ-tTA LMP1 cell line with and without the induction of LMP1 to verify if the multinucleation would still proceed. The independent expression of CMV-myc-TRF2 blocked the formation of multinucleated RS (Figure 11) thus showing that LMP1 appears to mimic the signaling pathway involved in the pathogenesis of the EBV-negative HL. Importantly, LMP1 induced changes in the expression of several shelterin proteins that act as gatekeepers for correct DNA replication telomeric integrity. These findings may eventually lead to the unraveling of the molecular pathogenesis of EBV-associated HL (Lajoie et al., 2015).
17 Figure 11: LMP1 increases multinucleation but expression of mycTRF2 eradicates multinuclearity in the presence of LMP1
Count of multinucleated cells in BJAB tTA and BJAB tTA LMP1 in the presence or absence of tetracycline over a period of 10 days (Adapted from Lajoie et al, 2015).
Hypothesis and Objectives
The ability of EBV viral proteins such as LMP1 to induce phenotypic changes when expressed individually in human B–cells lines implies that these viral proteins are key effectors in the immortalization process and changes of gene expression. No differences in clinical presentation are found between EBV negative and positive forms of HL, suggesting a common mechanism in pathogenesis. TRF2 appears to be a major target of LMP1 but is not the sole downstream effector of telomere dysfunction in this setting, therefore the hypothesis of this project is that LMP1 indirectly interferes with TRF2 at the promoter/gene level, since TRF2 levels are reversible upon removal of LMP1 (Figure 10, Figure 12). The objective of this project is to firstly determine if LMP1 indirectly interferes with the TRF2 promoter since LMP1 did not affect the regulation of pCMV-TRF2 when transfected into the BJAB tTa induced with LMP1. Secondly, we hope to identify a smaller region within the TRF2 promoter in which potential inhibitors or missing activators are affecting TRF2 levels.
18 Figure 12: Schematic representation of LMP1 possibly interfering with TRF2 at its promoter region.
The hypothesis is that LMP1 indirectly downregulates TRF2 at the promoter, and when LMP1 is removed or stopped by the addition of Tetracycline, TRF2 basal levels are restored.
TRF2
Normal Basal TRF2
LM P1
TRF2
Downregulation of TRF2
Removal of LM P1 (+Tet) restoresbasal TRF2 levels
LM P1-induction (-Tet) produces a cascade of pathways leading to TRF2
19 Materials and Methods
Cell Lines
The cell lines BJAB tTA and BJAB tTA LMP1 were obtained from Martin Rowe (Floettmann, Ward, Rickinson & Rowe, 1996). The BJAB cell line is an EBV-negative B lymphoma that shares many characteristics with typical Burkitt lymphoma except that it lacks the chromosomal translocation that is a marker for Burkitt Lymphoma diagnosis (Menezes, Leibold, Klein & Clements, 1975). Both cell lines have been integrated with a Tet-off system. The Tet-off system was made by adding a C-terminal portion of VP16 fused to the tetR-gene and is flanked upstream by a PCMV and downstream by the SV40 poly(A) site. This tetR with the activation domain VP16 from HSV (Herpes simplex virus) generates a specific transactivator by binding to tetO sequences. Transactivation is prevented by the addition of the antibiotic tetracycline. When bound to TetO-placed upstream promoters, tTA (tetracycline-controlled transactivator) activates transcription (Gossen & Bujard, 1992).
BJAB tTA is the parental cell line of BJAB tTA LMP1, integrated with the plasmid pUHD15-1 that has been modified by insertion of a hygromycin-resistance gene to give rise to pJEF-3, which expresses the tTA system. The tTA system is derived from fusion of two genes: tetR and a VP16 transactivator that is continuously expressed from a cytomegalovirus immediate-early enhancer (CMV/IE) promoter on the pJEF3 plasmid. The TET repressor (tetR) protein is a transcription repressor from Escherichia coli (E. coli) and the vP16 domain transforms the tetR repressor into an activator (Floettmann et al., 1996). This will allow us control the gene expression by the addition or removal of Tetracycline. BJAB tTA LMP1 is the BJAB tTA cell line that has been integrated with not only pJEF-3 but also a plasmid called pJEF-6 containing a transactivator response element (TRE) that is located in front of the cytomegalovirus promoter (PCMV) that controls the expression of the gene producing the LMP1 protein to produce stable clones requiring binding of tTA to a 5’regulatory region containing promoter (Kim et al., 2009). (Figure 13)
20 Figure 13: Tet-Off system.
The tTA binds specifically to the tet-Off (tetO) operator sequences upstream of the CMV promoter (P CMV). The tetO/P CMV represents the tetracycline response element (TRE) (Lajoie et al., 2015)
Manipulation of cell lines Passage of Suspension Cultures
Replacement of growth medium is carried out every 3 days by directly diluting the cells in the culture flask for further growth or withdrawing a portion of the cells and diluting the remaining cells down to a seeding density appropriate for the cell line. This keeps the cell density in the range of continuous growth until used for a transfection experiment. Transfection requires 4 million cells per sample. Cells are always incubated at 37°C and 5% CO2.
Cryopreservation of Mammalian cells
Mammalian cells are cryopreserved to avoid loss by contamination, to minimize genetic change, and to avoid aging or transformation of cell lines. Cells are counted in order to have 2 million cells per vial. The cells are centrifuged at 600 rpm for 5 minutes to pellet cells. Supernatant is then removed and the pellet is washed twice with 1X PBS. The cells are then resuspended in freezing medium composed of 90% RPMI-1640 and 10% DMSO and aliquoted into cryogenic
21 storage vials. The vials are placed at -20°C for 2-3 hours then placed at -80°C overnight before being transferred into a liquid nitrogen tank for storage (Freshney, 1994).
Thawing frozen Mammalian cells
Cell vials are removed from the liquid nitrogen, placed in a 37°C water bath for 15 minutes until thawed, and spun at 600 rpm for 5 minutes. The supernatant is removed and cells are resuspended in pre-heated medium (RPMI-1640 with FBS) and transferred into a 75ml vented cap flask (Freshney, 1994).
DNA Extraction Protocol
Cells were centrifuged 4000rpm/5min/4°C and the supernatant was removed. The pellet was rinsed twice with 1X PBS and was centrifuged at 4000rpm/5min/4°C. The pellet was resuspended in 100ul of Dit buffer (10mM Tris pH8.0+0.1% Polyoxyethylene 10 lauryl ether (decaethylene glycol)) to lyse cells. Proteinase K was added to a ratio of 1/100 (stock 10 mg/ml, final concentration of 100 μg/ml). The mix was incubated at 65°C for 2 hours to digest proteins. It was then incubated at 95°C for 15 minutes to inactivate the Proteinase K. The genomic DNA was stored at -20°C for future use.
Plasmid Construction
Using plasmids pGL3 and eGFP-N1, the luciferase and eGFP gene were isolated by digesting with XbaI and HindIII and purifying on 0.8% agarose gel. The vector fragment from pGL3 and eGFP insert fragment were ligated together and transformed into DH5α E. coli. This created plasmid JSTG-GFP (Figure 14) with a multi-cloning site for future promoter insertion and an ampicillin resistance gene (AMP). Primers to amplify the candidate promoter region of TRF2 were designed using NCBI reference NM_005652.4. The TRF2 promoter sequence was extracted and used to design specific primers using primer blast. The primers were checked against the whole human genome for specificity to the TRF2 promoter (see Table 7 for primers). The JSTG-GFP vector was digested with XhoI and HindIII to be able to ligate with the PCR product. All forward primers contained an XhoI restriction enzyme sequence and all reverse primers contained a HindIII sequence in order to facilitate ligation with the JSTG-GFP vector.
22 Figure 14: pJSTG-GFP plasmid construct.
A multi-cloning site and eGFP gene were integrated into a plasmid with the AMP gene using enzymes XbaI and HindIII.
PCR Mix: 2 μl of 10μM Forward primer 2 μl of 10μM Reverse primer 10 μl of 5X Q5 Buffer (NEB) 1 μl of 10 mM dNTPs 1.0 μl of Q5 polymerase (NEB)
1 μl DNA (~20 ng genomic DNA or 10 ng plasmid DNA) 33.0μl of ddH2O
50 μl total volume
The following PCR conditions were used for all the reactions: Step 1: 95°C for 2 minutes
Step 2: 95°C for 30 seconds Step 3: 59°C for 30 seconds Step 4: 72°C for 3 minutes Repeat step from 2 to 4 for 30x Step 5: 72°C for 10 minutes
23 Plasmid Construct Names Length of TRF2 Promoter (bp)
TRF2-p2566 2566 TRF2-p1307 1307 TRF2-p1157 1157 TRF2-p974 974 TRF2-p821 821 TRF2-p737 737 TRF2-p680 680 TRF2-p614 614 TRF2-p484 484 TRF2-p400 400 TRF2-p300 300 TRF2-p250 250 TRF2-p200 200 TRF2-p150 150 TRF2-p140 140 TRF2-p125 125 TRF2-p115 115 TRF2-p100 100 TRF2-p50 50 TRF2-PLGFP GFP-PL
Table 1: Name of plasmid construct with respective promoter length.
Electrophoresis Gel
PCR reactions were loaded on a 1X TAE 1% agarose gel and run at 100 V for 60 min. 1kb+ DNA ladder (Invitrogen) was loaded as a DNA marker. The gel was placed in an ethidium bromide bath for 30-60 seconds then run for 15 minutes and visualized using a UV transilluminator and photographed with digital software.
Ligation
A T4 DNA ligase kit (New England Biolabs, product M0202S) was used according to manufacturer’s instructions for ligation to either clone an insert into a vector or circularize a vector after cloning. The samples were incubated for 30 min at RT. The reaction mixture was then stored at 4°C or used right away for transformation into E. coli.
24 Ligation of insert DNA into plasmid vector DNA
Reagents Amount(μl)
Insert (3:1) Varies
Vector 10-100 ng
T4 Ligation Buffer (10x) 4μl
T4 DNA Ligase (1U/μl) 1
Water Add to make 20 μl
Total 20 μl
Table 2: Reagents and volume used for ligation of insert with vector. Recircularization of linear DNA
Reagents Amount(ul)
Vector 10-50 ng
T4 Ligation Buffer (10x) 10 μl
T4 DNA Ligase (1U/μl) 1 μl
Water To 50 μl
Total 50 μl
Table 3: Reagents and volume used for circularization ligation. Enzyme Digestion
All enzymes are obtained from NEB. All enzyme digestion reactions were incubated at 37°C for 1 hour.
Digestion Mix
1 µg DNA (purified plasmid DNA, PCR amplicons, vector plasmid) 1 µl of each Restriction Enzyme
5 µl of 10x Buffer
x µl dH2O (to bring total volume to 30µL) Klenow Treatment
This protocol blunts ends by 3’overhang removal or fill-in 3’ resected (5’ overhang) ends using DNA polymerase I, Large (Klenow) Fragment. Using 30ng purified digested plasmid, 2U Klenow, 1x buffer, 5mM dNTP, and water were mixed and incubated for 20 minutes at room temperature. The reaction was stopped by adding EDTA to a final concentration of 10mM and heating for 15 minutes at 75°C (NEB, 2015).
25 Bacteria Transformation
Bacterial transformation was performed using E. coli DH5α competent cells stored at -80°C and defrosted on ice. 50 μl was transformed with 5 μl of ligation product, pipetting up-and-down gently to mix, and incubated for 15 minutes on ice. The samples were heat shocked in a 42°C water bath for 90 seconds and then placed on ice for 2 minutes. 950 μl of LB broth was added and bacteria were incubated at 37°C for 1 hour with agitation. The bacteria were centrifuged for 2 min at 12000 rpm, 950ul of the supernatant was removed and bacteria was resuspended in the remaining 50 μl of LB and spread onto LB-agar plates containing a selection antibiotic such as ampicillin (100mg/ml). The plates incubated overnight at 37°C. Single colonies were selected and grown in 2 ml of LB + ampicillin overnight at 37°C. Plasmids were extracted using EZ-10 spin column plasmid DNA mini-prep kit (Biobasic) and aliquots were frozen at -20°C to be thawed at 4°C as needed for downstream applications.
BJAB tTA/LMP1 Transfection
Human suspension cell lines BJAB tTA/BJAB tTA LMP1 were transfected with a plasmid containing a portion of the TRF2-promoter linked to a GFP gene (Table 7) using either electroporation method or the nucleofection kit (Lonza 10064-154). The day before the transfection, the cells were washed twice with PBS 1x and incubated overnight with 0.8 μg/ μl tetracycline at 37°C and 5% CO2. On the day of the transfection cells were counted using a hematocytometer and cell number was calculated as follows: Cell Concentration (cells/ml) = Dilution Factor (Total cell count/4) x104. 4.0 x 10⁶ cells per sample were used to perform the transfection. Cells were washed twice 1x PBS, suspended in RPM1+FBS without tetracycline and incubated for 4 hours to remove all traces of tetracycline in order to induce LMP1 expression.
When the electroporation procedure was used, it was performed as follows: after 4 hours of incubation, the cells were washed twice with PBS to remove RPMI+FBS and resuspended in 100 μl per sample of RPM1 without FBS to have 1 million cells per 100 μl. One hundred microliters of the solution with cells was transferred into 1.5 ml Eppendorf tubes with their respective amount of plasmid (5μg) required for transfection. Once samples were homogenized with the
26 plasmid, the mixture was added to the 100 μl cuvettes and transfected using a cuvette of 0.2 cm with the program conditions of 975 uF, 200 ohms, 150 V to pulse. After transfection, 100 μl of RPMI+FBS was added into each cuvette containing cells, then the 200 μl was transferred into 1.5 ml Eppendorfs where it was split: 100 μl was pipetted into 6 well plate with 5ml RPM1+FBS and the other 100 μl was pipetted into 5 ml RPM1+FBS+Tetracycline. The cells were incubated for 72 hrs. After 24 hrs, the media was changed by spinning the cells for 5 min at 600 rpm, removing the supernatant, and adding fresh media. Cell were harvested after 72 hrs, spun for 5 min at 1000 rpm in 15 ml plastic tubes, washed once with 1x PBS and transferred into 1.5 ml Eppendorf tubes. The cells were washed another time with 1x PBS and the pellet was left in 50 μl of PBS (for easier resuspension of cells for Protein Lowry or RNA extraction) and were preserved at -20°C.
If the nucleofection technique was used with Lonza nucleofection kit: after 4 hours, the cells were washed twice with PBS to remove RPMI+FBS and were resuspended in 100 ul per sample of reagent to have 4 million cells per 100 μl. One hundred microliters of the solution with cells was transferred into 1.5ml Eppendorfs with their respective amount of plasmid (3μg) required for transfection. Once samples were homogenized with plasmid, the mixture was added to the 100 μl cuvettes and transfected using the program provided by the company. After transfection, 100 μl RPMI+FBS was added to each respective cuvette containing cells, then the 200 μl was transferred into 1.5 ml Eppendorfs, where it was split: 100ul was pipetted into a 6 well plate with 5 ml RPM1+FBS and the other 100ul was pipetted into 5 ml RPM1+FBS+tetracycline. The cells were incubated for 72 hrs. After 24 hrs, the media was changed by spinning the cells for 5 min at 600 rpm, removing the supernatant, and adding fresh media. Cells were harvested after 72 hrs, spun for 5 min at 1000 rpm in 15 ml plastic tubes, washed once with 1x PBS and transferred into 1.5 ml Eppendorfs. They were then washed another time with 1x PBS and the pellet was left in 50 ul of PBS (for easier resuspension of cells for Protein Lowry or RNA extraction) and was preserved at -20°C.
Flow Cytometry
After the 72 hours transfection, the cells were aliquoted into a 15 ml tube, spun for 5 min at 600 rpm then washed twice with 1x PBS and resuspended in 1 ml of fresh cold PBS and transferred
27 into the flow cytometry tubes. The FACS DIVA system was used according to manufacturer’s instructions with the following parameters: FSC 165 SSC 245 GFP 385 intensity).
Fluorescent Microscopy
To determine if the transfection was successful, after 72 hrs, the cells were left in the 6 well plates and centrifuged at 1000 rpm. Once the cells were spun down, the 6 well plates were brought to the microscope. A pre-established program by Sheriff Lab was used for analysis. Western Blot
The pellet previously harvested or stored at -20°C was resuspended in 50 μl of 2X Laemmli loading buffer with DDT added (62.5 mM Tris pH 6.8, 25% v/v glycerol, 2% m/v SDS, 0.01% m/v bromophenol blue, 10% v/v 1M DDT and 50 μl of water. The samples were sonicated for 10 min at 100 V in an ice bath (1 min sonication with 25 sec pause). The samples were boiled for 5 minutes at 100°C in order to denature the proteins. The amount of protein per microliter was quantified using Protein Lowry colorimetry, which is a widely used method to estimate the amount of proteins within a biological sample, (Lowry, Rosenbrough, Farr & Randall, 1951) and 20 μg of each sample was then analyzed on a 10% SDS-PAGE gel. For all Western blots, samples were migrated for 1 hour 40 min at 100 V. The proteins where then transferred to Hybond-C nitrocellulose membrane (GE Healthcare) using a BioRad mini Trans-blot Cell apparatus for 75 minutes at 100 V. Membranes were stained with Ponceau S in order to verify the quality of the proteins and transfer efficacy. The membranes were blocked with 5% m/v powdered milk dissolved in 1X PBS-T for 30 minutes. They were then washed 3 times for 5 minutes each in PBS-T with agitation at room temperature. Membranes were incubated with rotation overnight at 4°C with antibody (Table 4). They were then washed 3 times for 5 minutes in 1X PBS-T at room temperature with agitation. Membranes were incubated for 1 hour at room temperature with the secondary antibody (Table 5). After this incubation, the membranes were washed again 3 times for 5 minutes with 1X PBS-T. Enhanced 32 chemiluminescence (ECL) was used to visualize the results with an ImageQuant LAS 4000 (GE Healthcare).
28 Primary Antibodies used for Western Blot
Antibody Company Dilution Expected Size Secondary Antibody
Anti-eGFP Roche 1:1000 26kDa HRP-conjugated anti-mouse
Anti-Actin Sigma Aldrich 1:1000 45kDa HRP-conjugated anti-rabbit
Anti-TRF2 IMGENEX 1:1000 60kDa HRP-conjugated anti-mouse
Anti-Tubulin Cell Signaling 1:1000 65kDa HRP-conjugated anti-rabbit Anti-LMP1 Sigma Aldrich 1:200 70kDa HRP-conjugated anti-mouse Table 4: Primary antibodies with their properties for Western Blot usage.
Secondary Antibodies used for Western Blot
Secondary Antibody Company Dilution
Mouse Cell Signaling 1:5000
Rabbit GE Healthcare Life Sciences 1:5000
Table 5: Secondary antibodies and dilution. RNA Analysis
Total cellular RNA was extracted by Trizol reagent and RNA extraction kit (Zymo Research, Direct-zol kit R2050, R2051) and purity of each sample was measured by optical density using a Nanodrop spectrophotometer. Total RNA (1 μg) was used to generate cDNA using the Qiagen QuantiTect Reverse Transcriptase kit following the manufacturer's instructions. Real-time PCR was performed with a hot start step 95°C for 10 min followed by 40 cycles of 95°C for 30 s, 60°C for 30 s and 72°C for 30 s using iQTM SYBR Green Supermix (Bio-Rad Laboratories Inc.) on Real Time PCR System (Applied Biosystems).
Nuclear Extraction Protocol
Cells were incubated at 37°C and 5% CO2 until a density of 1x10⁹cells/culture was obtained. The cells were spun for 10 min at 2000 rpm in 50 ml plastic Falcon tubes at room temperature. Supernatant was removed and the cells were washed twice with cold 1x PBS for 5min at 2000 rpm and 4°C. The cells were then resuspended in 5 volumes (compared to pellet volume) of autoclaved Buffer A (10 mM Hepes pH 7.9, 1.5mM MgCl2, 10 mM KCl and 0.5 mM DTT). The pellets with buffer were incubated for 10min on ice, centrifuged for 5 min at 2000 rpm at 4°C
29 and supernatant was removed. The pellet was then resuspended in 2 volumes of Buffer A and transferred into a 7 ml glass pestle Dounce homogenizer Type A with 15 strokes to lyse the cells. The mixture was then transferred to 15 ml Falcon tube and centrifuged for 10 min at 2000 RPM at 4°C to precipitate the nuclei. Supernatant containing the cytoplasmic mixture was removed and stored at -80°C for other experiments and the pellet was resuspended in 2 volumes (compared to nucleus pellet volume) of the Buffer A and centrifuged for 20 min at 17000 RPM (25000g) at 4°C (rotor SS34, Sorvall). The supernatant was removed and the pellet resuspended in 2 volumes of Buffer C (20mM Hepes pH 7.9, 25% Glycerol, 420 mM KCl, 0.2 mM EDTA, 0.5 mM DTT and 0.5 mM PMSF). The mixture was homogenized using the 7ml glass pestle dounce homogenizer Type B with 10 strokes on ice. The mixture was incubated on ice for 30 min with occasional agitation. The pellet mixture was then centrifuged for 30 min at 17000 RPM. The supernatant was transferred into a dialysis membrane (Spectra/Por 7 Dialysis Membrane MWCO 10Kd, #132119) in 1L Buffer D (20 mM Hepes pH 7.9, 20% glycerol, 100 mM KCl, 0.2 mM EDTA, 0.5 mM DTT and 0.5 mM PMSF) for 1h-2h at 4°C lightly mixing with a stir bar. The dialysis buffer was changed an additional time and left overnight at 4°C. The next day, buffer D was changed and fresh buffer was added for 1h at 4°C. The samples were then centrifuged for 20 min at 17000 RPM and aliquoted on ice. Sample nuclear proteins were then measured using the Bradford technique (Bio-Rad Solutions), using a BSA standard curve and measured at 595 nm using a spectrometer.
5’ γ-ATP32 labelling
For the electrophoretic mobility shift assay (EMSA), the single stranded oligonucleotides were 5’ labelled with γ-ATP32. A total reaction volume of 20μl was comprised of 5μl of the 1uM oligonucleotides, 2μl 10x PNK Buffer, 8μl sterile water, 4μl Gamma-ATP32and 1μl of T4 PNK (10U/ml). The mixture was incubated at 37°C for 45 min and the reaction was stopped by heating at 65°C for 10 min. For the double stranded portion of the experiment, radiolabelled oligonucleotide were annealed together as described below.
Annealing of Oligonucleotides
In an Eppendorf, 22.5 μl of sense and 22.5 μl of antisense single-stranded oligonucleotides were mixed together with 5 μl of T4 DNA ligase buffer. The mixture was heated for 2 min at 95°C,