Titre:
Title:
Numerical simulations with the P-Hydroslag model to predict
phosphorus removal by steel slag filters
Auteurs:
Authors:
Dominique Claveau-Mallet, Benoit Courcelles, Philippe Pasquier et
Yves Comeau
Date: 2018
Type:
Article de revue / Journal articleRéférence:
Citation
:
Claveau-Mallet, D., Courcelles, B., Pasquier, P. & Comeau, Y. (2017). Numerical simulations with the P-Hydroslag model to predict phosphorus removal by steel slag filters. Water Research, 126, p. 421-432. doi:10.1016/j.watres.2017.09.032
Document en libre accès dans PolyPublie
Open Access document in PolyPublieURL de PolyPublie:
PolyPublie URL: https://publications.polymtl.ca/3134/
Version: Version finale avant publication / Accepted versionRévisé par les pairs / Refereed Conditions d’utilisation:
Terms of Use: CC BY-NC-ND
Document publié chez l’éditeur officiel Document issued by the official publisher
Titre de la revue:
Journal Title: Water Research (vol. 126)
Maison d’édition:
Publisher: Elsevier
URL officiel:
Official URL: https://doi.org/10.1016/j.watres.2017.09.032
Mention légale:
Legal notice: "In all cases accepted manuscripts should link to the formal publication via its DOI"
Ce fichier a été téléchargé à partir de PolyPublie, le dépôt institutionnel de Polytechnique Montréal
This file has been downloaded from PolyPublie, the institutional repository of Polytechnique Montréal
1
Numerical simulations with the P-Hydroslag model to predict phosphorus removal
1by steel slag filters
2By Dominique Claveau-Mallet*, Benoît Courcelles, Philippe Pasquier, and Yves Comeau 3
Department of Civil, Geological and Mining Engineering, Polytechnique Montreal, Montreal, Quebec, 4
Canada, H3C 3A7 5
* corresponding author: Dominique.claveau-mallet@polymtl.ca 6
ABSTRACT 7
The first version of the P-Hydroslag model for numerical simulations of steel slag filters is presented. 8
This model main original feature is the implementation of slag exhaustion behavior, crystal growth and 9
crystal size effect on crystal solubility, and crystal accumulation effect on slag dissolution. The model 10
includes four mineral phases: calcite, monetite, homogeneous hydroxyapatite (constant size and 11
solubility) and heterogeneous hydroxyapatite (increasing size and decreasing solubility). In the proposed 12
model, slag behavior is represented by CaO dissolution kinetic rate and exhaustion equations; while slag 13
dissolution is limited by a diffusion rate through a crystal layer. An experimental test for measurement 14
of exhaustion equations is provided. The model was calibrated and validated with an experimental 15
program made of three phases. Firstly, batch tests with 300g slag sample in synthetic solutions were 16
conducted for the determination of exhaustion equation. Secondly, a slag filter column test fed with 17
synthetic solution was run for 623 days, divided into 9 cells and sampled at the end of the experiment. 18
Finally, the column was dismantled, sampled and analyzed with XRD, TEM and SEM. Experimental 19
column curves for pH, oPO4, Ca and inorganic carbon were well predicted by the model. Crystal sizes
20
measured by XRD and TEM validated the hypothesis for homogeneous precipitation while SEM 21
observations validated the thin crystal layer hypothesis. 22
KEYWORDS 23
slag, phosphorus, wastewater treatment modelling, PHREEQC, hydroxyapatite, calcite, precipitation 24
ABBREVIATIONS 25
*Manuscript
2
Symbol Description
26
General abbreviations
27
BOF Basic oxygen furnace
28
CW Constructed wetands
29
EAF Electric arc furnace
30
HRTV Hydraulic retention time of voids
31
MONtoHAP Transformation of MON into HAP
32
o-PO4 Ortho-phosphates
33
SEM Scanning electron microscope
34
TEM Transmission electron microscope
35
TIC Total inorganic carbon
36
WW Wastewater
37
XRD X-Ray diffraction
38
Abbreviations for mineral phases
39
CAL Calcite CaCO3
40
HAP Hydroxyapatite Ca5OH(PO4)3
41
HAP_HO Primary hydroxyapatite via homogeneous precipitation Ca5OH(PO4)3
42
HAP_HE Primary hydroxyapatite via heterogeneous precipitation Ca5OH(PO4)3
43
HAP2 Secondary hydroxyapatite via monetite transformation Ca4OH2(PO4)2
44
MON Monetite CaHPO4
45
Symbol Description Units (value)
46
Constants
47
𝑎𝐻𝐴𝑃_0 HAP crystal size in homogeneous precipitation [m] 48
𝐵1 and 𝐵2 Regression coefficients in 𝑘𝑑𝑖𝑠𝑠 exhaustion function 49
𝐷∗ Dispersivity (transport model) [cm]
50
𝐷𝑛Exchange factor between effective and immobile porosity (transport model) [s-1] 51
𝑘𝐶𝐴𝐿 CAL precipitation constant [mol CAL/s m2 slag] 52
𝑘𝐻𝐴𝑃 HAP precipitation constant [mol HAP/s m2 slag] 53
𝑘𝑀𝑂𝑁 MON precipitation constant [mol MON/s m2 slag] 54
𝑘𝑀𝑂𝑁𝑡𝑜𝐻𝐴𝑃 MONtoHAP precipitation constant [M HAP2/(M MON s)] 55
𝐾𝑠𝑝𝐶𝐴𝐿 Solubility product for CAL [M2]
3
𝐾𝑠𝑝𝐻𝐴𝑃_𝑏𝑢𝑙𝑘 Bulk solubility product for HAP [10-57 M9]57
𝐾𝑠𝑝𝐻𝐴𝑃_𝐻𝑂 Solubility product for HAP_HO [M9] 58
𝐾𝑠𝑝𝑀𝑂𝑁 Solubility product for MON [M2]
59
𝐿𝐻𝐴𝑃 L/D ratio for columnar HAP crystals [-]
60
𝑚𝑣𝑒𝑥𝑝 Slag mass to water volume ratio in a batch test [g/mL] 61
𝑀𝑊𝐻𝐴𝑃 HAP Molecular weight [502 g/mol]
62
𝑛 Total porosity in the slag filter [-]
63
𝑛𝑒 Effective porosity in the slag filter [-]
64
𝑛𝑖𝑚 Immobile porosity in the slag filter [-]
65
𝑃1, 𝑃2, 𝑃3 and 𝑃4 Regression coefficients in 𝑝𝐻𝑠𝑎𝑡 exhaustion function 66
𝑅 Ideal gas constant [8.31 J mol-1 K-1]
67
𝑆 Slag specific surface [m2/m3]
68
𝑠𝑒𝐻𝐴𝑃_0 initial HAP seeds concentration [seeds/L] 69
𝑆𝐼𝑐 Critical saturation index between HAP_HE and HAP_HO [-] 70
𝑇 Temperature [K]
71
𝛾 HAP mean free surface energy [87 mJ/m3]
72
𝜌𝑏𝑎𝑟𝑟 Crystal concentration in the crystal barrier [g crystal/m3] 73
𝜌𝐻𝐴𝑃 HAP crystal density [3 600 000 g/m3]
74
𝜌𝑠𝑙𝑎𝑔 Slag grain density [3.8 g/mL]
75
Rates, functions and variables
76
𝑎𝐻𝐴𝑃 Mean HAP crystal size [m]
77
𝑏𝑖𝑚 Moles of an element in immobile porosity (transport model) [mol] 78
𝐶 Total dissolved concentration for an element (transport model) [mol/kgw] 79
𝐶𝑒 C in effective porosity (transport model) [mol/kgw] 80
𝐶𝑖𝑚 C in immobile porosity (transport model) [mol/kgw] 81
CaOlBATH Leached CaO in a acid bath [mol/g]
82
CaOKTEST Leached CaO in a batch test [mol/g]
83
𝐶𝑎𝑂𝑙𝑇𝑂𝑇 Cumulative leached CaO in a batch test [mol/g] 84
𝐷𝑏𝑎𝑟𝑟 Diffusion coefficient in the crystal barrier [m2/s] 85
𝑑𝑏𝑎𝑟𝑟 Thickness of the crystal barrier [m]
86
𝑘𝑑𝑖𝑠𝑠 Slag dissolution constant [mol CaO/m2 slag] 87
4
𝐾𝑠𝑝𝐻𝐴𝑃_𝐻𝐸 Solubility product for HAP_HE [M9]88
𝑝𝐻𝑠𝑎𝑡 Saturation pH in the slag filter [-]
89
𝑞 Concentration in the solid phase for an element (transport model) [mol/kgw] 90
𝑟𝐶𝐴𝐿 CAL precipitation rate [M CAL/s]
91
𝑟𝑑𝑖𝑓𝑓 CaO diffusion rate through crystal barrier [M CaO/s] 92
𝑟𝑑𝑖𝑠𝑠 Slag dissolution rate [M CaO/s]
93
𝑟𝐻𝐴𝑃_𝐻𝐸 Primary heterogeneous HAP precipitation rate [M HAP/s] 94
𝑟𝐻𝐴𝑃_𝐻𝑂 Primary homogenous HAP precipitation rate [M HAP/s] 95
𝑟𝑀𝑂𝑁 MON precipitation rate [M MON/s]
96
𝑟𝑀𝑂𝑁𝑡𝑜𝐻𝐴𝑃 Secondary HAP precipitation rate [M HAP2/s] 97
𝑆𝐻𝐴𝑃 HAP molar specific surface [m2/mol]
98
𝑠𝑒𝐻𝐴𝑃 HAP seeds concentration [units/L]
99
𝑆𝐹𝑑𝑖𝑓𝑓 Step function in diffusion rate [-]
100
𝑆𝐹𝑑𝑖𝑠𝑠 Step function in dissolution rate [-]
101
𝑆𝐹𝐻𝐴𝑃_𝐻𝐸 Step function in HAP_HE rate [-]
102
𝑆𝐹𝐻𝐴𝑃_𝐻𝑂 Step function in HAP_HO rate [-]
103
𝑆𝐼𝐻𝐴𝑃_𝐻𝐸 Saturation index for HAP_HE [-]
104
𝑆𝐼𝐻𝐴𝑃_𝐻𝑂 Saturation index for HAP_HO [-]
105
𝑡 Time (transport model) [s]
106
𝑣 Pore water flow velocity (transport model) [m/s] 107
𝑥 1D distance (transport model) [m]
108
𝑋𝐶𝑎𝑂 Total leached CaO in the slag filter [M]
109 110
1 Introduction 111
Steel slag filters are an effective and passive technology for phosphorus removal from wastewater, 112
allowing typical municipal effluent o-PO4 concentration below 0.5 mg P/L (Koiv et al., 2016). Design tools
113
for slag filters are not yet developed and full scale slag filters cannot be implemented without expensive 114
pilot tests. The main issue related to steel slag filter operation relies on filter exhaustion and a relatively 115
rapid drop of removal efficiency (Chazarenc et al., 2008). A tool providing the effect of influent 116
5
composition and operational conditions (type and size of slag, influent flowrate, filter geometry) on slag 117filter effluent o-PO4 concentration and longevity would facilitate the design of these systems. This paper
118
presents the P-Hydroslag model, a new model adapted for steel slag filter simulations considering 119
influent composition and void hydraulic retention time (HRTV) while being compatible with accepted
120
physicochemical modeling frameworks (Lizarralde et al., 2015; Mbamba, Batstone et al., 2015; Mbamba, 121
Tait et al., 2015). 122
Sorption isotherms were largely proposed as a design tool for steel slag filters (Vohla et al., 2011), but 123
this method does not consider void precipitation and long-term changes in the material properties, 124
explaining why isotherms could not yet predict correctly full-scale behavior. The k-C* model traditionally 125
used for constructed wetlands (Kadlec and Wallace, 2009) successfully predicted steel slag filter 126
performance (Barca et al., 2013). This method may be suitable for design, but it cannot estimate the 127
lifetime of the filter. A general correlation between material CaO content and P retention capacity based 128
on several studies was proposed by Vohla et al. (2011), highlighting the importance of CaO dissolution in 129
retention mechanisms. Such a design tool, however, does not consider important aspects as CaO 130
availability, HRTV or influent composition, leading to a prediction uncertainty that is not acceptable for
131
design purpose. Finally, a predictive model based on several material properties, HRTV and inlet P
132
concentration was proposed (Penn et al., 2016). This model’s strengths were to consider both Fe-Al and 133
Ca based materials, propose an empiric relationship between material buffering capacity and P 134
retention capacity, and predict P retention for both lab-scale and pilot-scale systems. This model, 135
however, did not include direct measurement of kinetic rates, and would not be compatible with 136
general physicochemical modeling frameworks in wastewater treatment. 137
Two previous modeling studies were published in the recent years. The first study (Claveau-Mallet et al., 138
2012) qualitatively described concepts forming the basis of the model, including slag dissolution, 139
hydroxyapatite precipitation, crystal formation and accumulation in voids, and effect of velocity on 140
6
crystal accumulation. In the second study (Claveau-Mallet et al., 2014), concepts were translated into a 141prototype model including mathematical equations for precipitation and slag exhaustion, and a 142
proposition of laboratory protocol for slag characterization was presented. Numerical simulations of a 143
slag filter were performed on the base of this prototype model without experimental program for 144
calibration. Results were realistic but overestimated the filter longevity. Predictions from the 2014 145
prototype model were compared to full-scale real data in a recent study (Koiv et al., 2016) in which 146
longevity was overestimated. 147
In this paper, the first full version of the P-Hydroslag (standing for Phosphorus-hydroxyapatite-slag) 148
model is presented. The P-Hydroslag model is similar to the 2014 prototype model, with additional 149
features for diffusion barrier and crystal growth, a refined characterization of exhaustion equations, and 150
a complete model equation matrix. The objectives were to calibrate the P-Hydroslag model with 151
experimental data and evaluate the validity and realism of the model. 152
2 Material and Methods 153
2.1 Slag media 154
5-10 mm electric arc furnace steel slag produced by Arcelor Mittal and provided by Minéraux Harsco 155
(Contrecoeur, Canada) was used (33% Fe2O3, 30% CaO, 16% SiO2, 12% MgO. 6% Al2O3 and 3% other
156
metallic oxides). Its density (3.8) and specific surface (0.308 m2/g) were determined according to the
157
ASTM C127-04 standard (ASTM, 2004) and the Brunauer, Emmet and Teller method (Lowell et al., 2004). 158
Slag from the same source was previously studied by the authors’ research team for wastewater 159
treatment applications (Claveau-Mallet et al., 2015; Claveau-Mallet et al., 2013; Koiv et al., 2016) or 160
modeling studies (Claveau-Mallet et al., 2014; Claveau-Mallet et al., 2012). 161
2.2 Column test 162
7
A vertical filter column filled with slag was fed from its base with a synthetic wastewater in a saturated 163mode for a total duration of 623 days at approximatively 25°C. The column size was 159 cm in length 164
and 10 cm in internal diameter. The synthetic wastewater solution consisted of K2HPO4, KH2PO4, NaHCO3
165
and CaCl2 in tap water. The influent mean composition was pH of 7.80 ± 0.2, ortho-phosphates (o-PO4)
166
of 8.9 ± 2.0 mg P/L, total inorganic carbon (TIC) of 22 ± 2 mg C/L, Ca of 54 ± 14 mg/L and alkalinity of 102 167
± 3 mg CaCO3/L. The influent flowrate was 6.9 ± 1.0 mL/min for the first 517 days and 3.4 ± 0.5 mL/min
168
for the remaining 106 days of operation. 169
The column was divided into 11 virtual cells for the filling step, identified #0 to #10, with #0 at bottom 170
(inlet) and #10 at top (outlet). Cells #1 to #9 were 15 cm long and had a sampling hole in the middle. 171
Cells #0 and #10 were 7.5 cm long and had no sampling hole to provide a slag transition zone between 172
the inlet/outlet tubing and sampling zones. While filling the column, two 300 g slag samples were taken 173
from each cell using a standard sampling procedure for aggregate materials (ASTM C702, 2011). Slag 174
samples were used in batch kinetic tests (presented in section 2.3). The total slag mass in the column 175
was 24.24 kg, resulting in a 49.2% porosity. 176
The feeding barrel, column effluent and cells were sampled and analyzed periodically for pH, o-PO4,
177
filtered Ca, settled TIC, total P and alkalinity, using standard procedures (APHA, AWWA and WEF, 2005). 178
A maximum of 3 cells were sampled in the same day to minimize perturbation, resulting in a monthly 179
sampling frequency for each cell (twice a month in the second feeding phase). The feeding barrel and 180
effluent column sampling frequency was weekly for pH and once or twice a month for the other 181
parameters. Tracer tests were conducted after 12, 69, 82, 107, 187, 271, 376 and 558 days. Rhodamine 182
at a concentration of 20 mg/L was used as a tracer and measured in the effluent using 183
spectrofluorometry. 184
At the end of operation, feeding was stopped and the column was kept saturated for 6 days before 185
dismantling. Upon dismantling, pore water was first sampled and analyzed, then the column was cut 186
8
into 4 sections to ensure efficient solids sampling. For each cell, three samples were taken: first, several 187slag particles sampled before doing any major disturbance of the slag media (for scanning electron 188
microscope (SEM) analysis); then slag was washed with water in a large pan and precipitates were 189
sampled by sedimentation (for X-ray diffraction (XRD) and transmission electron microscope (TEM) 190
analyses); finally, a 300 g of washed slag sample was taken for kinetic tests (described in section 2.3). 191
Precipitates were air-dried for 3 days, sieved at mesh 60 and cleaned from slag dust with a strong 192
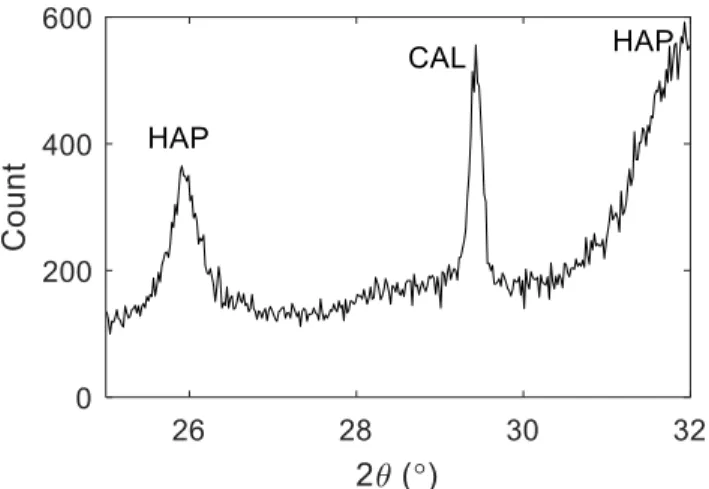
magnet. Precipitates were analyzed with XRD using a Philipps X’Pert diffractometer operated at 50 kV 193
and 40 mA, using the Bragg-Brentano geometry and a Cukα radiation. The Scherrer equation (Cullity,
194
2001) was used to estimate mean crystal sizes from diffractograms, using the ~26.1° peak for 195
hydroxyapatite (HAP) and ~29.4° peak for calcite (CAL). Precipitates of cells 1, 2, 3 and 8 were analyzed 196
using TEM with the bright field imaging technique (Jeol JEM-2100f field emission gun microscope, 200 197
kV). Before TEM analysis, samples were prepared with a 30-s ultrasound bath in methanol, and placed 198
on a copper grid covered with Formwar lightly coated with amorphous carbon. Undisturbed slag 199
particles of cells 1, 2, 3, 5 and 8 were analyzed with SEM using a Jeol JSM-7600F microscope (2.0 kV, LEI 200
or SEI detector). 201
2.3 Batch kinetic tests 202
The batch kinetic test method is described in another reference (Claveau-Mallet et al., 2014) and is 203
intended to produce exhaustion equations. The batch test included 5 identical phases. In a phase, the 204
slag sample was placed in a 1L Erlenmeyer flask containing 350 or 700 mL of a wastewater solution. The 205
Erlenmeyer flask was placed in a gyratory shaker at 160 rpm. The flask was closed with a rubber cap that 206
contained three airtight holes; one for a pH probe, one for a sampling tubing and one for a tubing 207
connected to a N2 gas balloon. The synthetic solution was composed of KH2PO4, K2HPO4, NaHCO3 and
208
CaCl2 dissolved in tap or distilled water. Four solutions with different concentrations were used to test
209
the method in a realistic range of wastewater types (pH of 6.5 to 7.9, o-PO4 of 8 to 24 m P/L, Ca of 17 to
9
50 mg/L, TIC of 0.5 to 24 mg C/L and alkalinity of 3 to 107 mg CaCO3/L). At time zero, slag was inserted.211
pH was monitored for 3 to 4 days. Three intermediary 20-mL samples were taken and analyzed for o-212
PO4, filtered Ca and filtered TIC. When necessary, a linear correction against time was applied to pH
213
measurements to account for probe drift. After this test, the slag sample was rinsed and immediately 214
transferred to a 160 rpm shaken HNO3 acid bath of known volume and concentration for 3 to 5 days.
215
After the acid bath, pH was measured and the corresponding leached CaO from the slag was computed 216
using numerical simulations (explained in section 2.5.2). After the acid bath, the slag sample was 217
carefully rinsed and used again for a subsequent phase. 218
Each 300-g slag sample from cells 1 to 8 was used for a 5-phase kinetic test, resulting in 16 kinetic tests 219
(2 replicates per cell). One-phase batch tests on dismantled column slag samples were performed for 220 cells 1 to 9. 221 2.4 Model description 222 2.4.1 Precipitation 223
The model’s Gujer matrix is presented in appendix. Three mineral phases are included: HAP typically 224
found in slag filters (Baker et al., 1998), monetite (MON) as intermediary phase and CAL. The 225
transformation of MON into HAP (MONtoHAP) was modelled as precipitation of HAP2, an artificial phase 226
composed of ions missing from MON before being HAP. Precipitation rates for HAP, MON and CAL were 227
formulated with a basic expression rate = k x SI, with k being a constant normalized with slag surface and 228
SI the saturation index. The bulk solubility constant for HAP (𝐾𝑠𝑝𝐻𝐴𝑃_𝑏𝑢𝑙𝑘) was set at 10-57 (Stumm and 229
Morgan, 1996a), within the 10-55 to 10-63 range reported in the literature (Lundager Madsen, 2008;
230
Oelkers et al., 2009; Parkhurst and Appelo, 1999; Stumm and Morgan, 1996a). 𝐾𝑠𝑝𝐶𝐴𝐿 was set at 10-7.5, 231
assuming an intermediary state between crystalline calcite (10-8.48, PHREEQC database (Parkhurst and
10
Appelo, 1999)) and hydrated calcium carbonate (10-7.144, MINTEQ database (Allison et al., 1991)).233
𝐾𝑠𝑝𝑀𝑂𝑁 was set at 10-7 from Valsami-Jones (Valsami-Jones, 2001). 234
Two types of HAP were included to account for two types of precipitation. HAP_HO was HAP formed by 235
homogeneous precipitation (new seeds precipitated in voids, or spontaneous precipitation) while 236
HAP_HE was HAP formed by heterogeneous precipitation (on existing surfaces - crystal growth). HAP_HE 237
occurred below a critical saturation index (𝑆𝐼𝑐) while HAP_HO occurred over 𝑆𝐼𝑐. In homogeneous 238
precipitation, crystal size was assumed to be constant. Using equation 1 for solubility of fine particles 239
(Stumm and Morgan, 1996b), 𝐾𝑠𝑝𝐻𝐴𝑃_𝐻𝑂 was set at 10-46. Temperature was set at 298 K and specific 240
surface (𝑆𝐻𝐴𝑃) was calculated assuming crystal size 𝑎𝐻𝐴𝑃_0= 31.3 nm, columnar shape for HAP and a 241
L/D ratio (𝐿𝐻𝐴𝑃) of 50. The value assumed for 𝑎𝐻𝐴𝑃_0 is close to crystal size measured in this study 242
(presented in a following section) and measurements made in previous studies (Claveau-Mallet et al., 243
2012, 2013). A value of 10-46 for 𝐾
𝑠𝑝𝐻𝐴𝑃_𝐻𝑂 is consistent with equilibrium state generally observed in 244
slag filters, assumed when effluent pH is over 10 with high HRTV (Table 1 and Figure 1). In Table 1, 𝐶𝑎2+,
245
𝑂𝐻− and 𝑃𝑂43− activities were determined with PHREEQC and used for apparent solubility calculation. 246
Studies conducted with hydrated oil shale ash were included in Table 1 as they behave in a similar way 247
then slag. Resulting mean and median were 10-45,7 and 10-46,0 from 389 data points.
248 𝑙𝑜𝑔(𝐾𝑠𝑝𝐻𝐴𝑃𝐻𝑂) = 𝑙𝑜𝑔(𝐾𝑠𝑝𝐻𝐴𝑃𝑏𝑢𝑙𝑘) + 2 3𝛾𝑆𝐻𝐴𝑃 2.3𝑅𝑇 [1] 249
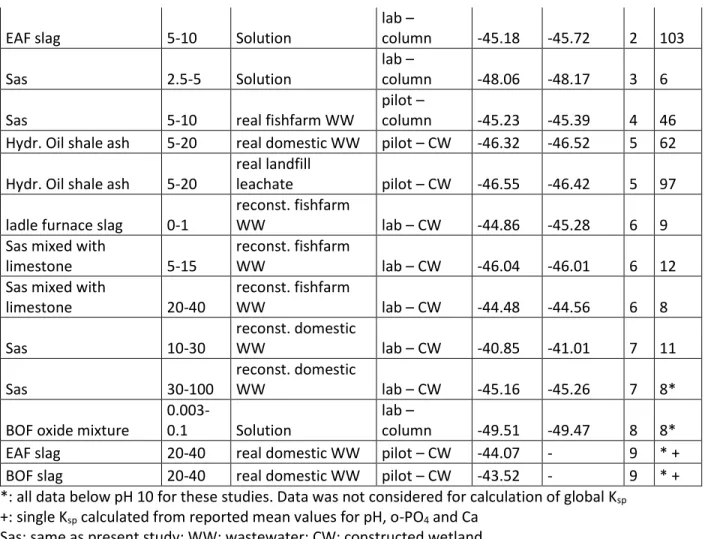
Table 1. Apparent HAP solubility from reported alkaline filter effluent with pH≥10, based on reported
250
pH, Ca and o-PO4 concentration.
251 Material Size (mm) Influent Type of study Apparent log Ksp of HAP Re f Nb of data point s mean median Sas 5-10 Solution lab – column -45.55 -45.94 1 35
11
EAF slag 5-10 Solutionlab –
column -45.18 -45.72 2 103
Sas 2.5-5 Solution
lab –
column -48.06 -48.17 3 6
Sas 5-10 real fishfarm WW
pilot –
column -45.23 -45.39 4 46 Hydr. Oil shale ash 5-20 real domestic WW pilot – CW -46.32 -46.52 5 62 Hydr. Oil shale ash 5-20
real landfill
leachate pilot – CW -46.55 -46.42 5 97 ladle furnace slag 0-1
reconst. fishfarm
WW lab – CW -44.86 -45.28 6 9
Sas mixed with
limestone 5-15
reconst. fishfarm
WW lab – CW -46.04 -46.01 6 12
Sas mixed with
limestone 20-40 reconst. fishfarm WW lab – CW -44.48 -44.56 6 8 Sas 10-30 reconst. domestic WW lab – CW -40.85 -41.01 7 11 Sas 30-100 reconst. domestic WW lab – CW -45.16 -45.26 7 8*
BOF oxide mixture
0.003-0.1 Solution
lab –
column -49.51 -49.47 8 8* EAF slag 20-40 real domestic WW pilot – CW -44.07 - 9 * + BOF slag 20-40 real domestic WW pilot – CW -43.52 - 9 * + *: all data below pH 10 for these studies. Data was not considered for calculation of global Ksp
252
+: single Ksp calculated from reported mean values for pH, o-PO4 and Ca
253
Sas: same as present study; WW: wastewater; CW: constructed wetland 254
Ref #1: Claveau-Mallet et al., 2012. Ref #2: Claveau-Mallet et al., 2013. Ref #3: Forget, 2001. Ref #4 : 255
Koiv et al., 2016. Ref #5 : Koiv et al., 2010. Ref #6 : Abderraja Anjab, 2009. Ref #7 : Stangart, 2012. Ref 256
#8: Baker et al., 1998. Ref #9: Barca et al., 2013. 257
-51 -49 -47 -45 -43 -41 -39 log apparent Ksp HAP
0 5 10 15 20 25 30 35 Nb o f o bs 258
Figure 1. Apparent HAP solubility distribution for all reported studies (pH ≥ 10; 389 observations).
12
In heterogeneous precipitation, crystal size is a variable following crystal growth on existing seeds, 260assuming that all crystals have the same size. The number of seeds (𝑠𝑒𝐻𝐴𝑃) increases as homogeneous 261
precipitation takes place, assuming an initial number of seeds (𝑠𝑒𝐻𝐴𝑃_0) and columnar shape. Equations 262
for HAP_HE specific surface and solubility product are provided in equations 2 and 3. 263 𝑙𝑜𝑔(𝐾𝑠𝑝𝐻𝐴𝑃_𝐻𝐸) = 𝑙𝑜𝑔(𝐾𝑠𝑝𝐻𝐴𝑃_𝑏𝑢𝑙𝑘) + 2 3𝛾𝑆𝐻𝐴𝑃 2.3𝑅𝑇 [2] 264 𝑆𝐻𝐴𝑃=(4𝐿𝐻𝐴𝑃 +2)𝑀𝑊𝐻𝐴𝑃 𝑎𝐻𝐴𝑃𝜌𝐻𝐴𝑃 [3] 265 2.4.2 Slag dissolution 266
Slag composition was simplified to the chemical formula CaO-0.3CaCl2. Exhaustion equations were
267
determined experimentally (described later), resulting in decreasing functions for saturation pH (𝑝𝐻𝑠𝑎𝑡) 268
and dissolution kinetic constant (𝑘𝑑𝑖𝑠𝑠). 𝑘𝑑𝑖𝑠𝑠 was normalized with slag surface as for precipitation 269
constants. The proposed approach gives flexibility to the model and every specific slag has its own 270
exhaustion parameters determined from batch tests by regression. 271
In this model, slag dissolution is assumed to be limited by Fick’s law of diffusion (Domenico and 272
Schwartz, 1998) through a crystal barrier that forms uniformly on the slag surface in a thin layer. The 273
thickness of the crystal barrier (𝑑𝑏𝑎𝑟𝑟) increased according to CAL, HAP and MON precipitation, 274
assuming a constant specific surface (𝑆) for slag (equation 4). It was assumed that the type of 275
precipitation has an influence on the diffusion coefficient (𝐷𝑏𝑎𝑟𝑟) and that diffusion is easier in a large 276
and organized crystals framework, compared to numerous small crystals. Mathematically, 𝐷𝑏𝑎𝑟𝑟 was 277
defined with a step function set initially at a high value, and to a lower value when the seed 278
concentration was doubled. As either dissolution or diffusion rate is the limiting process (the smallest), 279
the step function was added to consider the passage from dissolution-limiting to diffusion-limiting. 280
𝑑𝑏𝑎𝑟𝑟 =
(𝑚𝐶𝐴𝐿+𝑚𝐻𝐴𝑃+𝑚𝑀𝑂𝑁)×𝑛
𝜌𝑏𝑎𝑟𝑟𝑆×0.001(1−𝑛) [4]
13
2.4.3 Hydraulic model282
In continuous flow column simulations, the Advection-Reaction-Dispersion (ARD) equation for 1D flow 283
was used (equation 5). A first-order exchange approximation was added to account for diffusion 284
between effective and immobile porosity (equation 6). The hydraulic model is available in the PHREEQC 285
software (Parkhurst and Appelo, 1999). 286 𝜕𝐶 𝜕𝑡 = −𝑣 𝜕𝐶 𝜕𝑥+ 𝐷 ∗𝑣𝜕2𝐶 𝜕𝑥2− 𝜕𝑞 𝜕𝑡 [5] 287 𝑑𝑏𝑖𝑚 𝑑𝑡 = 𝑛𝑖𝑚(1 + 𝑑𝑞 𝑑𝐶) 𝑑𝐶𝑖𝑚 𝑑𝑡 = 𝐷𝑛(𝐶𝑒− 𝐶𝑖𝑚) [6] 288 2.5 Numerical simulations 289
Numerical simulations were performed using the PHREEQC software with its IPHREEQC modules for 290
interfacing with MATLAB (Charlton and Parkhurst, 2011). 291
2.5.1 Batch tests 292
The initial solution was simulated with KH2PO4, K2HPO4, CaCl2 and NaHCO3 added to pure water. A small
293
amount of HCl or NaOH was included to reproduce the precise pH of the experimental solution. 294
Solutions were equilibrated with HAP and CAL (but no MON) in the EQUILIBRIUM_PHASES block prior to 295
the simulated batch test. Simulated and experimental alkalinity were used for calibration of initial 296
solutions. Slag exhaustion was considered to be constant, therefore, 𝑝𝐻𝑠𝑎𝑡 and 𝑘𝑑𝑖𝑠𝑠 were constant 297
instead of being adjusted according to exhaustion equations. 𝑝𝐻𝑠𝑎𝑡 was set as the maximum pH value 298
reached in the experimental batch test. Calcite precipitation was removed from the batch test model, as 299
surprisingly no calcite precipitation occurred in experimental batch tests (no TIC reduction). 300
The model constants were identified by minimizing the misfit between the simulated output and the 301
experimental pH and 𝑜𝑃𝑂4 measurements. The objective function optimization was performed on the 302
log transformed constants 𝑘𝑑𝑖𝑠𝑠, 𝑘𝐻𝐴𝑃, 𝑘𝑀𝑂𝑁, 𝑘𝑀𝑂𝑁𝑡𝑜𝐻𝐴𝑃 and 𝐶𝑎𝑂𝑖𝑛 with the conjugate gradient 303
14
method and the golden-section search method (Press, 2007). As shown in Table 2, a two-step strategy 304was used to achieve satisfactory results and speed-up the calibration process. In the first step, the mean 305
absolute error between the experimental and simulated pH (F1) was minimized with large tolerances for
306
PHREEQC (1E-11) and the optimization algorithm (1E-7 for line search and 0.01 as F stop criteria). Then, 307
the objective function F2 was minimized with more demanding tolerances (1E-12 for PHREEQC and line
308
search, and 0.001 as F stop criteria). Note that 𝐶𝑎𝑂𝑖𝑛 was a little amount of CaO instantaneously 309
released at the water/slag contact, added for improving the calibration. 310
Table 2. Batch test inversion parameters for conjugate gradient method
311
Step Initial values (log) Objective function 1 -7 for 𝑘𝑑𝑖𝑠𝑠 and 𝐶𝑎𝑂𝑖𝑛 -6.5 for 𝑘𝑀𝑂𝑁 -9 for 𝑘𝐻𝐴𝑃 and 𝑘𝑀𝑂𝑁𝑡𝑜𝐻𝐴𝑃 𝐹1= 1 𝑛∑|𝑝𝐻𝑖,𝑒𝑥𝑝− 𝑝𝐻𝑖,𝑠𝑖𝑚| 𝑛 𝑖=1
2 Solution from inversion 1
𝐹2= 𝐹1+ 0.2 𝑚 ∑ |𝑜𝑃𝑂4𝑚,𝑒𝑥𝑝− 𝑜𝑃𝑂4𝑚,𝑠𝑖𝑚| 𝑚 1 312 2.5.2 Exhaustion functions 313
Exhaustion functions were produced by plotting 𝑝𝐻𝑠𝑎𝑡 and 𝑘𝑑𝑖𝑠𝑠 against total leached CaO (𝐶𝑎𝑂𝑙𝑇𝑂𝑇). 314
For a given phase i, 𝐶𝑎𝑂𝑙𝑇𝑂𝑇𝑖 was calculated by cumulating leached CaO in preceding kinetic tests and 315
acid bath (equation 7). 𝐶𝑎𝑂𝑙𝐵𝐴𝑇𝐻 was determined by simulating acid bath with PHREEQC, following the 316
final pH of the acid bath as a target value. 317
𝐶𝑎𝑂𝑙𝑖𝑇𝑂𝑇 = 0.5×𝐶𝑎𝑂𝐾𝑇𝐸𝑆𝑇𝑖 + ∑𝑖−1𝑛=1(𝐶𝑎𝑂𝐾𝑇𝐸𝑆𝑇𝑛 + 𝐶𝑎𝑂𝐵𝐴𝑇𝐻𝑛 ) [7] 318
Exhaustion functions coefficients were determined by linear regression of 𝑝𝐻𝑠𝑎𝑡 vs 𝐶𝑎𝑂𝑙𝑇𝑂𝑇 (equation 319
8) and logistic function regression of 𝑘𝑑𝑖𝑠𝑠 vs 𝐶𝑎𝑂𝑙𝑇𝑂𝑇 (equation 9). Mean regression coefficients were 320
kept for 𝑘𝑑𝑖𝑠𝑠, but coefficients following the top of the graphical data cloud were kept for 𝑝𝐻𝑠𝑎𝑡, as 321
15
𝑝𝐻𝑠𝑎𝑡 is a saturation state, and we can assume that saturation is controlled by the most reactive322 particles. 323 𝑝𝐻𝑠𝑎𝑡= 𝑃2− 𝑃2−𝑃1 (1+𝑒−𝑃3(𝐶𝑎𝑂𝑙𝑇𝑂𝑇−𝑃4)) [8] 324 𝑘𝑑𝑖𝑠𝑠 = 𝐵1+ 𝐵2𝐶𝑎𝑂𝑙𝑇𝑂𝑇 [9] 325
In the Gujer matrix, exhaustion functions included additional terms involving porosity and slag density to 326
account for the conversion of 𝐶𝑎𝑂𝑙𝑇𝑂𝑇 (units of mol/g slag) into 𝑋𝐶𝑎𝑂 (units of mol/L water) for filter 327
numerical simulations. 328
2.5.3 Column test 329
The simulated influent was prepared according to the procedure described in the batch tests section. 330
The column test was simulated within KINETIC and TRANSPORT blocks, with 50 numerical cells and a 331
tolerance of 1E-6. Kinetic rates were applied to both mobile and immobile cells. Hydraulic parameters 332
𝑛𝑒, 𝐷∗ and 𝐷𝑛 were calibrated with each tracer test. 333
3 Results and discussion 334
3.1 Determination of exhaustion equations and precipitation constants 335
In general, batch test calibration was excellent for pH and good for o-PO4, except for the period 0 to 100
336
min where the model overestimated slightly the o-PO4 concentration. An example of a well-calibrated
337
batch test (rank 7 out of 84 for global error function) is shown in Figure 2. No TIC reduction was 338
observed. Absence of CAL precipitation in batch tests was not expected, as calcite was precipitated in 339
column tests and is frequently observed in slag filters (Claveau-Mallet et al., 2013; Liira et al., 2009). 340
Mean precipitation constants were 𝑘𝐻𝐴𝑃= 10−11.03𝑚𝑜𝑙 𝐻𝐴𝑃 𝑠 𝑚⁄ 2𝑠𝑙𝑎𝑔, 𝑘𝑀𝑂𝑁= 341
10−8.67𝑚𝑜𝑙 𝑀𝑂𝑁 𝑠 𝑚⁄ 2𝑠𝑙𝑎𝑔 and 𝑘
𝑀𝑂𝑁𝑡𝑜𝐻𝐴𝑃 = 10−8.01𝑚𝑜𝑙 𝐻𝐴𝑃2 𝑠 𝑚𝑜𝑙 𝑀𝑂𝑁⁄ . 342
16
343Figure 2. Example of a batch test calibration. Simulated data is shown with lines. Batch test error
344
functions: 0.09 for pH and 0.15 for o-PO4.
345
pHsat and kdiss obtained from all batch tests were plotted against CaOltot for the production of exhaustion
346
functions (Figure 3). For kdiss, linear regression coefficients were used in column simulations (B1 = -7.91
347
and B2 = -1933 g/mol). pHsat exhaustion function had to be slightly increased above the data cloud
348
(discussed later) to improve the calibration (Figure 3B), resulting in coefficients P1 = 9.1, P2 = 12.1, P3 =
349 6000 and P4 = 1.2E-4. 350 351
0
2
4
6
8
10
12
14
16
18
20
7
8
9
10
11
12
1
10
100
1000
10000
o-PO
4(m
g
P/
L)
pH
(-)
Time (min)
exp. pH
exp. o-PO
4initial pH
7.39
initial o-PO
4= 18.8
17
Figure 3. Exhaustion functions for kdiss (A) and pHsat (B). Regression coefficients are provided in text.
352
3.2 Column test calibration 353
An example of tracer test calibration is shown in appendix. Hydraulic parameters 𝐷∗ (dispersivity) and 354
𝐷𝑛 (exchange factor between mobile and immobile porosity) were roughly constant for 8 tracer tests, 355
while effective porosity (𝑛𝑒) decreased slightly following the column operation. The 𝑛𝑒 decrease was 356
neglected, and hydraulic parameters from tracer test at time 187 were used (𝑛𝑒= 0.359, 𝐷∗ = 5 cm and 357
𝐷𝑛=5x10⁻⁶ s-1). 358
Results of numerical simulations are compared to experimental data in Figure 4. pH was correctly 359
predicted for cells 1 to 6 but slightly underestimated for cells 7 to effluent. o-PO4 was in general
360
successfully predicted, except for cells 1 and 2 in the first 100-200 days, where the o-PO4 rise was
361
predicted too late. This could be explained by the close position of cells 1 and 2 relative to the influent 362
point resulting in a non plug flow condition for these cells and in some short-circuiting. Calibration of o-363
PO4 from cells 5 to 7 was less accurate for the last 100 days, as the model predicted a stable
364
concentration while the experiment showed an increase of almost an order of magnitude. Calcium and 365
TIC calibration were less accurate then those for pH and o-PO4, but were considered satisfactory. The
366
effect of the influent rate change was correctly predicted by the model. 367
Calibrated constants were 𝑘𝐶𝐴𝐿 = 10−9 𝑀𝑠 𝑚2, 𝑆𝐼𝑐= 0.2 and 𝜌𝑏𝑎𝑟𝑟 = 2000 𝑘𝑔
𝑚3. Precipitation constants 368
for HAP, MON and MONtoHAP were already determined in batch tests and were not changed for 369
column simulations. 𝑆𝐼𝑐 was lower than reported values for calcite, which occurs in heterogeneous 370
precipitation over 𝑆𝐼𝑐= 0.3 and homogeneous precipitation over 𝑆𝐼𝑐=1.5 (Mayes et al., 2006). 𝜌𝑏𝑎𝑟𝑟 371
value was similar to dry density for a natural sand. 𝑘𝐶𝐴𝐿 was 2.5 orders of magnitude higher than the 372
reported initial value by Mbamba, Tait et al (2015), and monetite constant was in the same order of 373
magnitude as Mbamba’s values. In this study, precipitation rates were function of crystal concentration, 374
18
with initial crystal seeds of 1E-5 M, while the effect of crystal concentration was not considered in this 375model. 376
The column was divided in two zones for the calibration of 𝑠𝑒𝐻𝐴𝑃_0: cells 1 to 6 were set at 2e21 seeds/L 377
and cells 7 to 9 (and all immobile cells) were set at 5e20 seeds/L. This refinement was necessary to 378
achieve both o-PO4 calibration of first cells (mainly homogeneous precipitation) and last cells (mainly
379
heterogeneous precipitation). Attributing different 𝑠𝑒𝐻𝐴𝑃_0 values for two zones was considered realistic 380
because it represents a crystal behavior in which at a very low supersaturation index, fewer but bigger 381
crystals are formed. This behavior was confirmed during column dismantling. In cells 8 and 9, a very 382
small amount of precipitates was observed and sampled, with fresh- and unused-looking slag. Several 383
well-formed crystals could be seen by naked eyes only in cells 8 and 9 (3-4 mm in length). 384
The implementation of the diffusion equation is considered a major improvement compared to previous 385
prototype versions of the model. Without the diffusion equation, CaO would always be leached at its 386
maximum capacity (pHsat) and longevity would be highly overestimated. 𝐷𝑏𝑎𝑟𝑟 calibration was 1E-10
387
m2/s at first and was decreased to 5E-16 m2/s when the seed concentration was doubled. Calibrated
388
values of Dbarr for the two steps are similar to diffusion coefficients observed for clays. A large range was
389
reported for radioactive waste storage applications: from 10-17 to > 10-13 m2/s in consolidated clay
390
(Alonso et al., 2009) and 10-11 to 10-10 m2/s in altered bentonite (Manjanna et al., 2009).
19
392Figure 4. Water composition in a column test for cells 1 to 9 (A) and cells 2 to effluent (B). Experimental
393
data is shown with dots or x and simulated data with lines. 394
3.3 Validation of model hypothesis 395
The diffusion equation can be validated by the robustness of the model regarding pH. The model could 396
predict pH at the end of operation, pH after the 6-day rest and pHsat (Figure 5). pH was slightly
397
underestimated for pHsat and pH after rest, but relative trends for pH and pHsat were properly predicted,
398
as well as the pH increase induced by the 6-day rest. The crystal layer was realistic as uniform crystal 399
20
deposits were observed by SEM (Figure 6). The presence of cracks induced by air-drying was also400
suggesting that a crystal suspension layer was present onto the slag surface. Uniformity of crystal 401
composition was confirmed by TEM-EDS as CAL and HAP were frequently found in the same crystal at 402
nanometric scale. 403
404
Figure 5. pH distribution within column at the end of operation (623 days of feeding followed by 6 days
405
of rest). 406
407
Figure 6. SEM picture of slag grain surface from cell 2 at dismantling.
408
Cristal size in homogeneous precipitation was confirmed by microscope observations. In cells 1 to 3, 409
where the amount of precipitated HAP was sufficient for measurements, isolated crystals in TEM 410 6.0 6.5 7.0 7.5 8.0 8.5 9.0 9.5 10.0 10.5 11.0 1 2 3 4 5 6 7 8 9 pH (-) Cell Exp pHsat Sim pHsat Exp pH after rest Sim pH after rest Exp pH before rest Sim pH before rest
21
pictures were measured, resulting in a 35 nm mean value for 505 measurements. A similar value of 24 411nm was calculated from XRD diffractograms of cells 1 to 3. No specific increase was observed in crystal 412
size from cells 1 to 3, validating the constant crystal size hypothesis for homogeneous precipitation. HAP 413
composition was confirmed by XRD patterns (provided in supporting information). HAP composition for 414
individual crystals from TEM was confirmed by P and Ca presence with EDS. No monetite was detected 415
by XRD and no monetite precipitation occurred in the column simulations while monetite was 416
precipitated in batch test simulations, suggesting that pH rise in column was too fast for monetite 417
formation. 418
The relative small amount of formed HAP in heterogeneous precipitation made impossible XRD or TEM 419
crystal size analysis for heterogeneous HAP. It was possible, however, to analyse the progression of 420
calcite crystal size within the column using XRD. Its size was around 200 nm in cells 1 to 3, increased to 421
900 nm in cell 5, and was over the limit of Scherrer equation in cells 6 and higher. This suggests 422
homogeneous precipitation and constant size in the first cells and heterogeneous precipitation and 423
crystal growth in last cells. 424
Even if a distinction between homogeneous and heterogeneous precipitation was made for calcite, its 425
solubility was kept constant for both conditions. Assuming homogeneous precipitation at 200 nm (as 426
measured in cells 1 to 3) and spherical crystals, the computed solubility product from equation 1 is very 427
close to bulk solubility. While HAP growth decreases its solubility, CAL homogeneous crystals are large 428
enough to neglect this effect. 429
3.4 Model limits and recommendations 430
The main issue regarding the model is the number of batch kinetic tests needed to provide exhaustion 431
equations. The hypothesis of most reactive grains in batch tests conditioning column tests should also 432
be examined, because even if pHsat exhaustion equation was overestimating experimental data, pH in
22
the last cells of columns were underestimated. Work should be done using statistical analysis and theory 434of artificial granular material sampling (Gy, 1979) for reducing the number of batch tests and 435
transposing correctly batch to column conditions. 436
Calibration of heterogeneous precipitation was limited by experimental data, as last cells did not reach 437
their longevity. Additional studies involving long-term operation of slag filters and breakthrough of last 438
sections of filters, in which heterogeneous precipitation occurred for a while, would be needed for 439
accurate calibration and in-depth study of seeds concentration and type of precipitation. In this paper, 440
two layers of different seeds concentration were proposed, but other formulations would be possible 441
including step functions for seeds VS saturation index, increasing the number of layers or adding a third 442
type of HAP. 443
Further work should be conducted regarding need for refinement of the model. Additional features such 444
as interaction with atmospheric CO2 or porosity reduction (Courcelles et al., 2011) may be needed in
445
some cases as constructed wetlands. The model could be improved with additional P species (Mbamba, 446
Tait, et al., 2015) or consideration of crystal surface in rate equations. Crystal surface is obviously 447
increasing in this type of process, with long operation time without extraction, but kinetic parameters 448
may be less important than saturation parameters (pHsat and KspHAP_HE). Sensitivity analyses would be
449
needed to assess which aspect should be studied further, slag dissolution kinetics, crystal equilibrium 450
parameters or crystal kinetic parameters. 451
4 Conclusion 452
The first version of the P-Hydroslag model that can be used for prediction of steel slag filter efficiency 453
and longevity was presented in this paper. The objectives were to calibrate the model with experimental 454
data and evaluate the validity and realism of the model. The main outcomes were as follows: 455
23
- A complete model equation matrix was provided. The model included two main kinetic equation 456sets: a first set for CaO dissolution and a second set for precipitation. CaO dissolution equations 457
included slag exhaustion and CaO diffusion through a uniform crystal barrier on slag particles. 458
Precipitation equations included calcite precipitation, monetite precipitation, transformation of 459
monetite into hydroxyapatite, homogeneous hydroxyapatite precipitation (constant size) and 460
heterogeneous hydroxyapatite precipitation (increasing size). An equation for hydroxyapatite 461
solubility related to crystal size was included. Standard equilibrium reactions were included in 462
the model via the PHREEQC software. The advection-diffusion-reaction model was used as the 463
hydraulic model (1D porous media transport). 464
- The crystal barrier hypothesis was confirmed by SEM observations of used slag grains. 465
Homogeneous and heterogeneous precipitation hypothesis was confirmed by TEM crystal size 466
count and XRD measurements. 467
- The model and proposed experimental procedure for characterization of slag exhaustion 468
behavior were successful in producing realistic results. Numerical simulations reproduced 469
experimental breakthrough curves (pH, o-PO4, Ca, TIC) of an upward flow column slag filter.
470
ACKNOWLEDGMENT 471
The authors warmly thank Denis Bouchard, Manon Leduc, Simon Allaire, Simon Amiot and Patricia Bove 472
from Polytechnique Montreal for chemical analyses and technical assistance. They also thank Margit 473
Kõiv-Vainik, from University of Tartu, for providing constructive comments on the manuscript. A special 474
thank is given to Jean-Philippe Massé and Philippe Plamondon, from Polytechnique Montreal CM2 lab,
475
for their assistance with TEM, XRD and SEM analysis. Slag material was provided by Philippe Bouchard, 476
from Minéraux Harsco. This project was funded by the Natural Sciences and Engineering Research 477
Council of Canada. 478
REFERENCES 479
24
Abderraja Anjab, Z. 2009. Development of a steel slag bed for phosphorus removal from
480
fishfarm wastewater (In French). M. Sc. A. thesis, Polytechnique Montreal, Montreal,
481Canada.
482Allison, J. D., Brown, D. S., Novo-Gradac, K. J. 1991. MINTEQA2/PRODEFA2, a geochemical
483assessment model for environmental systems: version 3.0 user's manual. Environmental
484research laboratory, USEPA, Athens, Georgia.
485Alonso, U., Missana, T., Garica-Gutiérrez, M., Patelli, A., Siitari-Kauppi, M., Rigato, V. 2009.
486Diffusion coefficient measurements in consolidated clay by RBS micro-scale profiling.
487Applied Clay Science 43, 477-484.
488American Public Health Association, American Water Works Association, Water Environment
489Federation. 2005. Standard methods for the examination of water and wastewater 21
st 490ed. Washington, D. C.
491ASTM. 2004. ASTM C127-04 Standard Test Method for Density, Relative Density (Specific
492Gravity), and Absorption of Coarse Aggregate. ASTM International: West Conshohocken,
493PA.
494ASTM. 2011. ASTM C 702 / C 702 M−11 Standard Practice for Reducing Samples of Aggregate to
495Testing Size. ASTM International: West Conshohocken, PA.
496Baker, M. J., Blowes, D. W., Ptacek, C. J. 1998. Laboratory development of permeable reactive
497mixtures for the removal of phosphorus from onsite wastewater disposal systems.
498Environmental Science and Technology 32(15), 2308-2316.
499Barca, C., Troesch, S., Meyer, D., Drissen, P., Andrès, Y., Chazarenc, F. 2013. Steel slag filters to
500upgrade phosphorus removal in constructed wetlands: two years of field experiments.
501Environmental Science and Technology 47(1), 549-556. doi:10.1021/es303778t
502Charlton, S. R., Parkhurst, D. L. 2011. Modules based on the geochemical model PHREEQC for
503use in scripting and programming languages. Computers & Geosciences 37(10),
1653-5041663.
505Chazarenc, F., Kacem, M., Gerente, C., Andres, Y. 2008. 'Active' filters: a mini-review on the use
506of industrial by-products for upgrading phosphorus removal from treatment wetlands.
507In: Proceedings of the 11th Int. Conf. on Wetland Systems for Water Pollution Control.
508International Water Association, Indore, India, November 1-7.
509Claveau-Mallet, D., Courcelles, B., Comeau, Y. 2014. Phosphorus removal by steel slag filters:
510Modeling dissolution and precipitation kinetics to predict longevity. Environmental
511Science and Technology 48(13), 7486-7493.
512Claveau-Mallet, D., Lida, F., Comeau, Y. 2015. Improving phosphorus removal of conventional
513septic tanks by a recirculating steel slag filter. Water Quality Research Journal of Canada
51450(3), 211-218.
515Claveau-Mallet, D., Wallace, S., Comeau, Y. 2012. Model of phosphorus precipitation and crystal
516formation in electric arc furnace steel slag filters. Environmental Science and Technology
51746(3), 1465-1470. doi:10.1021/es2024884
518Claveau-Mallet, D., Wallace, S., Comeau, Y. 2013. Removal of phosphorus, fluoride and metals
519from a gypsum mining leachate using steel slag filters. Water Research 47(4),
1512-5201520.
521Courcelles, B., Modaressi-Farahmand-Razavi, A., Gouvenot, D., Esnault-Filet, A. 2011. Influence
522of precipitates on hydraulic performance of permeable reactive barrier filters.
523International Journal of Geomechanics 11(2), 142-151.
52425
Cullity, B. D. 2001. Diffraction III: Real Samples. In: Elements of x-ray diffaction 3
rded. Upper
525Saddle River, NJ: Prentice Hall.
526Domenico, P. A., Schwartz, F. W. 1998. Physical and Chemical Hydrogeology 2
nded. New York:
527John Wiley & sons.
528Forget, C. 2001. Dissolved phosphorus removal from fish farm effluents by reactive granular
529media (in French). M. Sc. A. thesis, Polytechnique Montreal, Montreal, Canada.
530Gy, P. 1979. Developments in geomathematics. theory and practive 4, Sampling of particulate
531materials. New York: Elsevier Scientific Publications.
532Kadlec, R. H., Wallace, S. 2009. Treatment Wetlands 2
nded. Boca Raton, FL: CRC Press.
533Koiv, M., Liira, M., Mander, U., Motlep, R., Vohla, C., Kirsimae, K. 2010. Phosphorus removal
534using Ca-rich hydrated oil shale ash as filter material - The effect of different phosphorus
535loadings and wastewater compositions. Water Research 44(18), 5232- 5239.
536Koiv, M., Mahadeo, K., Brient, S., Claveau-Mallet, D., Comeau, Y. 2016. Treatment of fish farm
537sludge supernatant by aerated filter beds and steel slag filters - effect of organic loading
538rate. Ecological Engineering 94, 190-199.
539Liira, M., Koiv, M., Mander, U., Motlep, R., Vohla, C., Kirsimae, K. 2009. Active filtration of
540phosphorus on Ca-rich hydrated oil shale ash: Does longer retention time improve the
541process? Environmental Science and Technology 43(10), 3809-3814.
542doi:10.1021/es803642m
543Lizarralde, I., Fernández-Arévalo, T., Brouckaert, C., Vanrolleghem, P., Ikumi, D. S., Ekama, G. A.,
544Ayesa, E., Grau, P. 2015. A new methodology for incorporating physico-chemical
545transformations into multi-phase wastewater treatment process models. Water
546Research 74, 239-256.
547Lowell, S., Shields, J. E., Thomas, M. A., Thommes, M. 2004. Characterization of Porous Solids
548and Powders: Surface Area, Pore Size and Density. New York: Springer Ed.
549Lundager Madsen, H. E. 2008. Influence of foreign metal ions on crystal growth and
550morphology of brushite (CaHPO4, 2H2O) and its transformation to octacalcium
551phosphate and apatite. Journal of Crystal Growth 310(10), 2602-2612.
552Manjanna, J., Kozaki, T., Sato, S. 2009. Fe(III)-montmorillonite: basic properties and diffusion of
553tracers relevant to alteration of bentonite in deep geological disposal. Applied Clay
554Science 43, 208-217.
555Mayes, W. M., Younger, P. L., Aumônier, J. 2006. Buffering of Alkaline Steel Slag Leachate across
556a Natural Weland. Environmental Science and Technology 40, 1237-1243.
557Mbamba, C. K., Batstone, D. J., Flores-Alsina, X., Tait, S. 2015. A generalised chemical
558precipitation modelling approach in wastewater treatment applied to calcite. Water
559Research 68, 342-353.
560Mbamba, C. K., Tait, S., Flores-Alsina, X., Batstone, D. J. 2015. A systematic study of multiple
561minerals precipitation modelling in wastewater treatment. Water Research 85, 359-370.
562Oelkers, E. H., Bénézeth, P., Pokrovski, G. S. 2009. Thermodynamic Databases for Water-Rock
563Interaction. In: Thermodynamics and kinetics of water-rock interaction (Vol. 70, pp.
1-56446). Chantilly, VA: Mineralogical Society of America and Geochemical Society.
565Parkhurst, D. L., Appelo, C. A. J. 1999. User's guide to PHREEQC (Version 2) - A computer
566program for speciation, batch-reaction, one-dimensional transport, and inverse
567geochemical calculations. (Water-Resources Investigations Report 99-4259). U. S.
568Geological Survey, Denver.
56926
Penn, C., Bowen, J., McGrath, J., Nairn, R., Fox, G., Brown, G., . . . Gill, C. 2016. Evaluation of a
570universal flow-through model for predicting and designing phosphorus removal
571structures. Chemosphere 151, 345-355.
572Press, W. H. 2007. Numerical recipes: the art of scientific computing 3
rded. Cambridge:
573Cambridge University Press.
574Stangart, A. 2012. Phosphorus removal from septik tank effluents by coarse steel slag. M. Ing.
575thesis, Polytechnique Montreal, Montreal, Canada.
576Stumm, W., Morgan, J. J. 1996a. Aquatic Chemistry: Chemical Equilibria and Rates in Natural
577Waters 3
rded. New York: John Wiley & Sons.
578
Stumm, W., Morgan, J. J. 1996b. Kinetics at the Solid-Water Interface: Adsorption, Dissolution
579of Minerals, Nucleation, and Crystal Growth. In: Aquatic Chemistry: Chemical Equilibria
580and Rates in Natural Waters 3
rded. New York: John Wiley & Sons.
581
Valsami-Jones, E. 2001. Mineralogical controls on phosphorus recovery from wastewaters.
582Mineralogical Magazine 65(5), 611-620. doi:10.1180/002646101317018433
583Vohla, C., Koiv, M., Bavor, H. J., Chazarenc, F., Mander, U. 2011. Filter materials for phosphorus
584removal from wastewater in treatment wetlands-A review. Ecological Engineering 37(1),
58570-89.
586Appendix
587 588Figure A1. XRD pattern of precipitates sampled in cell #2. Main peaks of HAP and CAL diffractograms are
589
indicated in the figure 590
27
Table A1. P-Hydroslag model matrix
Phase
Stoichiometry - aqueous
Stoichiometry – mineral
phases
Rate equation
Equilibrium
constants
𝐻+ 𝑂𝐻− 𝐶𝑎2+ 𝐶𝑂
32− 𝑃𝑂43− 𝐶𝑙− HAP MON CAL HAP2
Primary homogenous hydroxyapatite (HAP_HO)
-1
-5
-3
+1
𝑟𝐻𝐴𝑃_𝐻𝑂= 0.001𝑘𝐻𝐴𝑃𝑆 (1 − 𝑛) 𝑛 ×𝑆𝐼𝐻𝐴𝑃_𝐻𝑂×𝑆𝐹𝐻𝐴𝑃_𝐻𝑂 𝑆𝐼𝐻𝐴𝑃_𝐻𝑂 = 𝑙𝑜𝑔 ( {𝐶𝑎2+}5{𝑃𝑂 43−} 3 {𝑂𝐻−} 𝐾𝑠𝑝𝐻𝐴𝑃_𝐻𝑂 ) 𝑆𝐹𝐻𝐴𝑃_𝐻𝑂= 1 1 + 𝑒−50(𝑙𝑜𝑔(𝑆𝐼𝐻𝐴𝑃_𝐻𝑂)−𝑙𝑜𝑔(𝑆𝐼𝑐)) 𝑝𝐾𝑠𝑝𝐻𝐴𝑃_𝐻𝑂 = 46 Primary heterogeneous hydroxyapatite (HAP_HE)-1
-5
-3
+1
𝑟𝐻𝐴𝑃_𝐻𝐸= 0.001𝑘𝐻𝐴𝑃𝑆 (1 − 𝑛) 𝑛 ×𝑆𝐼𝐻𝐴𝑃_𝐻𝐸×𝑆𝐹𝐻𝐴𝑃_𝐻𝐸 𝑆𝐼𝐻𝐴𝑃_𝐻𝐸= 𝑙𝑜𝑔 ( {𝐶𝑎2+}5{𝑃𝑂 43−} 3 {𝑂𝐻−} 𝐾𝑠𝑝𝐻𝐴𝑃_𝐻𝐸 ) 𝑆𝐹𝐻𝐴𝑃_𝐻𝐸 = 1 − 1 1 + 𝑒−50(𝑙𝑜𝑔(𝑆𝐼𝐻𝐴𝑃_𝐻𝑂)−𝑙𝑜𝑔(𝑆𝐼𝑐)) 𝑙𝑜𝑔(𝐾𝑠𝑝𝐻𝐴𝑃_𝐻𝐸) = 𝑙𝑜𝑔(𝐾𝑠𝑝𝐻𝐴𝑃_𝑏𝑢𝑙𝑘) + 2 3𝛾𝑆𝐻𝐴𝑃 2.3𝑅𝑇 Monetite (MON)-1
-1
-1
+1
𝑟𝑀𝑂𝑁 = 0.001𝑘𝑀𝑂𝑁𝑆 (1 − 𝑛) 𝑛 ×𝑙𝑜𝑔 ( {𝐶𝑎2+}{𝐻𝑃𝑂 42−} 𝐾𝑠𝑝𝑀𝑂𝑁 ) 𝑝𝐾𝑠𝑝𝑀𝑂𝑁= 7 Calcite (CAL)-1
-1
+1
𝑟𝐶𝐴𝐿 = 0.001𝑘𝐶𝐴𝐿𝑆 (1 − 𝑛) 𝑛 ×𝑙𝑜𝑔 ( {𝐶𝑎2+}{𝐶𝑂 32−} 𝐾𝑠𝑝𝐶𝐴𝐿 ) 𝑝𝐾𝑠𝑝𝐶𝐴𝐿= 6.8 Secondary hydroxyapatite* (HAP2)-2
-4
-2
+1
𝑟𝑀𝑂𝑁𝑡𝑜𝐻𝐴𝑃= 𝑘𝑀𝑂𝑁𝑡𝑜𝐻𝐴𝑃×𝑆𝐼𝐻𝐴𝑃_𝐻𝑂[𝑀𝑂𝑁] 𝑝𝐾𝑠𝑝𝐻𝐴𝑃_𝐻𝑂 = 4628
Table A1 (followed). Complete P-Hydroslag model matrix
Slag dissolution
+2 +1.3
+0.
3
𝑟𝑑𝑖𝑠𝑠= 𝐴×𝑆𝐹𝑑𝑖𝑠𝑠 𝐴 = 0.001𝑘𝑑𝑖𝑠𝑠𝑆 (1 − 𝑛) 𝑛 ( 𝑝𝐻𝑠𝑎𝑡− 𝑝𝐻 𝑝𝐻𝑠𝑎𝑡 ) 𝑆𝐹𝑑𝑖𝑠𝑠= 1 − 1 1 + 𝑒−50(𝐴−𝐵) N/A CaO diffusion through crystal barrier+2
+1
𝑟𝑑𝑖𝑓𝑓= 𝐵×𝑆𝐹𝑑𝑖𝑓𝑓 𝐵 =0.5×𝐷𝑏𝑎𝑟𝑟×(10 𝑝𝐻𝑠𝑎𝑡−14− {𝑂𝐻−}) 𝑑𝑏𝑎𝑟𝑟 ×𝑆×0.001(1 − 𝑛) 𝑛 𝑆𝐹𝑑𝑖𝑓𝑓= 1 1 + 𝑒−50(𝐴−𝐵) 𝑙𝑜𝑔(𝐷𝑏𝑎𝑟𝑟) = −10 − 5.3× 1 1 + 𝑒−50( 𝑠𝑒𝐻𝐴𝑃 𝑠𝑒𝐻𝐴𝑃_0−2) N/A29
Detailed equations to complement the model matrix
1
Advection-reaction-dispersion (ARD) equation for 1D transport and First-order exchange 2
approximation between effective and immobile porosity: 3 𝜕𝐶 𝜕𝑡 = −𝑣 𝜕𝐶 𝜕𝑥+ 𝐷 ∗𝑣𝜕2𝐶 𝜕𝑥2− 𝜕𝑞 𝜕𝑡 [A1] 4 𝑑𝑏𝑖𝑚 𝑑𝑡 = 𝑛𝑖𝑚(1 + 𝑑𝑞 𝑑𝐶) 𝑑𝐶𝑖𝑚 𝑑𝑡 = 𝐷𝑛(𝐶𝑒− 𝐶𝑖𝑚) [A2] 5
Detailed equations for HAP_HE: 6 𝑆𝐻𝐴𝑃= (4𝐿𝐻𝐴𝑃+2)𝑀𝑊𝐻𝐴𝑃 𝑎𝐻𝐴𝑃𝜌𝐻𝐴𝑃 [A3] 7 𝑎𝐻𝐴𝑃= [𝐻𝐴𝑃_𝐻𝐸]𝑀𝑊𝐻𝐴𝑃𝐿𝐻𝐴𝑃2 𝜌𝐻𝐴𝑃3√𝑠𝑒𝐻𝐴𝑃 + √𝑠𝑒𝐻𝐴𝑃 2 3 𝑎𝐻𝐴𝑃_03 [A4] 8 𝑠𝑒𝐻𝐴𝑃= 𝑠𝑒𝐻𝐴𝑃_0+ [𝐻𝐴𝑃_𝐻𝑂]𝑀𝑊𝐻𝐴𝑃𝐿𝐻𝐴𝑃2 𝜌𝐻𝐴𝑃𝑎𝐻𝐴𝑃_03 [A5] 9
Detailed equations for diffusion through crystal barrier: 10
𝑑𝑏𝑎𝑟𝑟 =(100[𝐶𝐴𝐿]+502[𝐻𝐴𝑃]+136[𝑀𝑂𝑁]+366[𝐻𝐴𝑃2])×𝑛𝜌
𝑏𝑎𝑟𝑟𝑆(𝑛−1) [A6]
11
Detailed equations for exhaustion functions: 12 𝑝𝐻𝑠𝑎𝑡= 𝑃2− 𝑃2−𝑃1 (1+𝑒−𝑃3𝐹(𝐶𝑎𝑂𝑙𝑇𝑂𝑇−𝐹×𝑃4)) [A7] 13 𝑙𝑜𝑔(𝑘𝑑𝑖𝑠𝑠) = 𝐵1+ 1 𝐹𝐵2𝑋𝐶𝑎𝑂+ 𝑙𝑜𝑔 (0.001𝑆 (1−𝑛) 𝑛 ) [A8] 14 𝐹 =1000𝜌𝑠𝑙𝑎𝑔(1−𝑛) 𝑛 [A9] 15 16