• Aucun résultat trouvé

Technology Transfer and Innovation for Low-Carbon Development.

N/A
N/A
Protected

Academic year: 2021

Partager "Technology Transfer and Innovation for Low-Carbon Development."

Copied!
232
0
0

Texte intégral

(1)

HAL Id: hal-03109951

https://hal-mines-paristech.archives-ouvertes.fr/hal-03109951

Submitted on 14 Jan 2021

HAL is a multi-disciplinary open access

archive for the deposit and dissemination of

sci-entific research documents, whether they are

pub-lished or not. The documents may come from

teaching and research institutions in France or

abroad, or from public or private research centers.

L’archive ouverte pluridisciplinaire HAL, est

destinée au dépôt et à la diffusion de documents

scientifiques de niveau recherche, publiés ou non,

émanant des établissements d’enseignement et de

recherche français ou étrangers, des laboratoires

publics ou privés.

Miria A. Pigato, Simon J. Black, Damien Dussaux, Zhimin Mao, Miles

Mckenna, Ryan Rafaty, Simon Touboul

To cite this version:

Miria A. Pigato, Simon J. Black, Damien Dussaux, Zhimin Mao, Miles Mckenna, et al.. Technology

Transfer and Innovation for Low-Carbon Development.. 2020. �hal-03109951�

(2)

Technology Transfer

and Innovation

for Low-Carbon

Development

Miria A. Pigato, Simon J. Black, Damien Dussaux, Zhimin Mao,

Miles McKenna, Ryan Rafaty, and Simon Touboul

INTERNA

TIONAL DE

VEL

(3)
(4)

Technology Transfer

and Innovation

for Low-Carbon

Development

MIRIA A. PIGATO, SIMON J. BLACK, DAMIEN DUSSAUX, ZHIMIN MAO, MILES MCKENNA, RYAN RAFATY, AND SIMON TOUBOUL

(5)

Some rights reserved 1 2 3 4 23 22 21 20

Books in this series are published to communicate the results of Bank research, analysis, and operational experience with the least possible delay. The extent of language editing varies from book to book. This work is a product of the staff of The World Bank with external contributions. The findings, interpretations, and conclusions expressed in this work do not necessarily reflect the views of The World Bank, its Board of Executive Directors, or the governments they represent. The World Bank does not guarantee the accuracy of the data included in this work. The boundaries, colors, denominations, and other information shown on any map in this work do not imply any judgment on the part of The World Bank concerning the legal status of any territory or the endorsement or acceptance of such boundaries. Nothing herein shall constitute or be considered to be a limitation upon or waiver of the privileges and immunities of The World Bank, all of which are specifically reserved.

Rights and Permissions

This work is available under the Creative Commons Attribution 3.0 IGO license (CC BY 3.0 IGO) http:// creativecommons.org/licenses/by/3.0/igo. Under the Creative Commons Attribution license, you are free to copy, distribute, transmit, and adapt this work, including for commercial purposes, under the following conditions:

Attribution—Please cite the work as follows: Pigato, Miria A., Simon J. Black, Damien Dussaux, Zhimin Mao, Miles McKenna, Ryan Rafaty, and Simon Touboul. 2020. Technology Transfer and Innovation for Low-Carbon Development. International Development in Focus. Washington, DC: World Bank. doi:10.1596/978-1-4648-1500-3. License: Creative Commons Attribution CC BY 3.0 IGO

Translations—If you create a translation of this work, please add the following disclaimer along with the attribution: This translation was not created by The World Bank and should not be considered an official World Bank translation. The World Bank shall not be liable for any content or error in this translation. Adaptations—If you create an adaptation of this work, please add the following disclaimer along with the

attribution: This is an adaptation of an original work by The World Bank. Views and opinions expressed in the adaptation are the sole responsibility of the author or authors of the adaptation and are not endorsed by The World Bank.

Third-party content—The World Bank does not necessarily own each component of the content contained within the work. The World Bank therefore does not warrant that the use of any third-party-owned individual component or part contained in the work will not infringe on the rights of those third parties. The risk of claims resulting from such infringement rests solely with you. If you wish to re-use a component of the work, it is your responsibility to determine whether permission is needed for that re-use and to obtain permission from the copyright owner. Examples of components can include, but are not limited to, tables, figures, or images.

All queries on rights and licenses should be addressed to World Bank Publications, The World Bank Group, 1818 H Street NW, Washington, DC 20433, USA; e-mail: pubrights@worldbank.org.

ISBN: 978-1-4648-1500-3 DOI: 10.1596/978-1-4648-1500-3

Cover image: Omelchenko/Shutterstock. Used with permission; further permission required for reuse. Cover design: Debra Naylor, Naylor Design Inc.

(6)

 iii

Foreword ix Acknowledgments xi About the Authors xiii Executive Summary xv Abbreviations xxxiii

CHAPTER 1 A Framework for Low-Carbon Technology Transfer 1

Introduction 1

Technological innovation and diffusion in historical context 1 The diffusion of LCT as part of a long history of energy transitions 4

Distinctive features of LCTs, relative to carbon-intensive technologies 7

The legal basis for LCT transfer under the UNFCCC 10 Avenues and determinants of LCT transfer 15 Conclusions 19

Notes 20 References 20

CHAPTER 2 Trade and Foreign Direct Investment as Channels of Low-Carbon Technology Transfer 27

Introduction 27

Channels for technology transfer 28 Measuring trade and FDI 29

Trade as a channel of LCT transfer 32 FDI as a channel of LCT transfer 45

Movement of people as a channel of LCT transfer 50 Absorptive capacity as a determinant of LCT transfer 53 Conclusions 54

Notes 56 References 58

CHAPTER 3 Using Patents to Measure the International Transfer of Low-Carbon Technologies and Its Determinants 61

Introduction 61

Measuring LCT with patent data 62

Data sources and accounting methodology for LCT 62 The transfer of LCTs 64

(7)

Conclusions 83 Notes 84 References 85

CHAPTER 4 The Rise of Emerging Economies as Leaders in Low-Carbon Innovation 89

Introduction 89

The evolving role of LCT transfer and innovation in emerging economies 89

The emergence of a global electric vehicle market 93 BYD and Tesla: The contrasting trajectories of innovative electric vehicle firms in China and the United States 101

Conclusions 104 Notes 105 References 106

CHAPTER 5 Policies to Support Low-Carbon Technology Transfer 109

Introduction 109

Necessity of LCT transfer 110

National capability for LCT transfer 114 National capability matters for LCT transfer 119 Policies for LCT transfer 130

Recommendations 135 Conclusion 145 Notes 145 References 147

Appendix A Key Legal Provisions Related to Low-Carbon Technology Transfer 153

Appendix B Full List of Low-Carbon Technology Products 155

Appendix C Chapter 3 Tables and Figures 163

Appendix D Low-Carbon Technology in Emerging Countries 181

Appendix E Empirical Evaluations of Innovation Policy Instruments 187

Boxes

ES.1 Two paths to leadership in the global electric vehicle market xxiv 1.1 Patents and medicines for all 20

2.1 Lists of climate change–related technologies 31 2.2 Income group classification changes, select countries 35 3.1 Model specifications and estimation strategy 74 4.1 Brazil’s success with sugarcane ethanol 92 4.2 U.S. electric vehicle policies 98

5.1 Reforming power markets for renewables 140 5.2 Why technological neutrality is not neutral 142

FIGURES

ES.1 GHG emissions abatement potential across sectors by 2030 xvi ES.2 The technology-transfer staircase xvii

ES.3 National capabilities that influence technology transfer xviii ES.4 Share of LCT innovations, by country xxii

1.1 Timeline of key international developments in LCT transfer 13 1.2 Stages of LCT development and deployment 17

(8)

2.1 Global levelized cost of energy from utility-scale renewable power generation technologies, 2010–17 30

2.2 Total value of LCT exports, 1990–2017 33

2.3 LCT export growth versus growth of all exports, excluding LCT, 1990–2016 33 2.4 APEC54, WBG43, and GDD30 total exports, by value, 1990–2017 34 2.5 Total LCT imports, by income group 35

2.6 Share of total LCT imports, by income group 36

2.7 Total imports by the South, 1992 income group classification, 1992–2016 36 2.8 Total LCT exports, by income group 38

2.9 Share of total LCT exports, by income group 38

2.10 Share of total LCT exports, by value and income group, without China 42 2.11 Share of total South–South and South–North LCT exports, by value,

without China 42

2.12 Total LCT imports, select countries, 1992–2016 43 2.13 Total LCT exports, select countries, 1992–2016 43

2.14 Outbound international education mobility, by region, 2007 versus 2017 51 2.15 Share of immigrants among inventors in OECD countries 52

3.1 Global growth of inventions in LCTs and all technologies, 1990–2015 64 3.2 Growth of LCTs, by field, 1990–2000 and 2005–15 65

3.3 Top-five innovators in LCT, 2010–15 66

3.4 Innovations in LCT across income groups, 2010–15 66

3.5 Share of LCT patents received and carbon emissions, select countries, 2010–15 68 3.6 Share of LCT patents received and carbon emissions, select developing

countries, 2010–15 68

3.7 China’s invention and importation of LCTs, 2010–15 69

3.8 The Russian Federation’s invention and importation of LCTs, 2010–15 69 4.1 Estimated world solar photovoltaic cell production, 2005–18 93

4.2 New electric car sales, by country, 2013 and 2017 94

4.3 Exports of lithium-ion batteries, by country, 2013 and 2017 94 4.4 The electric vehicle market revolution, 2015–40 95

4.5 Market shares of joint ventures and domestic firms in the conventional and electric vehicle industries 99

5.1 GHG emissions abatement potential across LCT sectors by 2030 111 5.2 A rapid increase in the global stock of low-carbon capital goods is needed by

2030 and 2050 112

5.3 Renewables investment has remained stable at about US$300 billion a year 112

5.4 At constant 2018 technology costs, renewables investment is up by 55 percent since 2010 112

5.5 The technology-transfer staircase: From import to production of new technology 115

5.6 LCT import intensity across economies 121 5.7 LCT export intensity across economies 122 5.8 Innovation performance across economies 123

5.9 More-innovative economies have deeper stocks of financial capital 124 5.10 Combined, four factors are strongly associated with innovation

performance 125

5.11 More-innovative countries tend to have more green complex exports 126 5.12 LCT exports increasing for some developing countries and shrinking for

others 127

5.13 Developing countries have different starting positions for renewable energy deployment 132

C.1 Distribution of China’s outbound LCT patents, 2010–15 163 C.2 Distribution of the Russian Federation’s outbound LCT patents,

2010–15 164

C.3 Distribution of China’s inbound LCT patents, 2010–15 164

C.4 Distribution of the Russian Federation’s inbound LCT patents, 2010–15 164 C.5 Environmental performance index and GDP per capita 166

(9)

C.7 Countries with the highest levels of tariffs 167

C.8 Countries with the highest levels of nontariff barriers 167 Tables

ES.1 Top-10 LCT exporters, 2016 xx

ES.2 Total renewable-energy FDI by destination, source, and subsector, 2003–18 xxi

1.1 Distinctive features of LCTs 8

1.2 Select LCT transfer initiatives and their key achievements 14 2.1 Decomposition of traded products by broad economic category 32 2.2 Technological classification of exports 32

2.3 Top-10 LCT importers, by value, 2016 37 2.4 Top-10 South LCT importers, by value, 2016 37 2.5 Top-10 global exporters of LCT, 2016 39 2.6 Top-10 South exporters of LCT, by value, 2016 39 2.7 Top-five exporters to each income group, 2016 40

2.8 Share of total trade and of LCT trade, by income group, 2015–16 40 2.9 Direction of trade for total exports versus LCT exports, by value, 1992, 2002,

and 2016 41

2.10 Top import origin markets and export destinations for LCTs, by value and share, select economies 44

2.11 Motives and determinants of FDI in LCT sectors 46 2.12 FDI into renewable energy, by year, 2003–18 47 2.13 Total outward RE FDI, by country, 2018 48

2.14 Total South–South RE investment, by subsector, 2003–18 49 2.15 Total RE FDI, top source economies and subsectors, select economies,

2003–18 49

2.16 Top foreign direct investors, 2003–18 50

2.17 Henley Passport Index ranking, select countries 51 3.1 Patented technologies, by field, 1990–2015 63

3.2 The top-10 inventors of LCT among developing countries, 2010–15 67 3.3 The top-10 LCT inventors among developing countries, according

to Patentscope data, 2010–15 70 3.4 The coverage of the sample 76

3.5 Determinants of LCT transfer to developing countries from high-income economies 77

3.6 Determinants of LCT transfer to developing countries from developing countries 78

3.7 Determinants of patent transfers, by technology field 81

3.8 Simulated effects of relaxing controls on FDI and lowering tariffs 82 3.9 Chinese and Russian investment agreements with major LCT innovators 82 5.1 Characteristics of technology-transfer stages 116

5.2 Inputs required to climb the technology-transfer staircase 118 5.3 Proxies for LCT transfer depth across and within countries 119 5.4 National capability proxy measures for within-country regression 127 5.5 Cross-country regressions of LCT transfer on national capability metrics,

2008–17 128

5.6 Market failures holding back LCT transfer and potential policy responses 131 5.7 Policy types for LCT transfer, by primary mechanism and capability

affected 138

A.1 Key legal provisions related to LCT transfer 153

B.1 Full list of LCT products, by HS classification and broad economic category 155

B.2 Products, by 6-digit HS, appearing on multiple select lists 159

B.3 Number of economies in each income group classification, select years 160 B.4 China’s role in LCT exports, by income group classification 160

B.5 Top-five economies, by share of LCT imports, by income group, 1992, 2002, and 2016 161

B.6 Top-five economies, by share of LCT exports and income group, 1992, 2002, and 2016 162

(10)

C.1 Developing countries’ inward patents and CO2 emissions, 2010–15 163 C.2 Variable definition and data sources 165

C.3 Summary statistics 166

C.4 Economies included or not included in the econometric analysis 168 C.5 Main results of the literature on the determinants of LCT transfer 173 C.6 Determinants of LCT transfer to developing economies from high-income

economies 174

C.7 Determinants of LCT transfer to developing economies from developing economies 175

C.8 Regression results when excluding China 176

C.9 Catalogue of LCT-related encouraged industries for foreign investment in China 177

(11)
(12)

 ix In the rising tide of bad news about climate change, it is easy to feel pessimistic.

The task of halving emissions by 2030 seems insurmountable. The stakes are high, the threat to global development is serious, and the road to success is murky, at best.

This book provides a ray of hope for the global effort to tackle climate change. It shows that decades of rapid innovation and targeted investment in low-carbon technology (LCT) are paying off. The tools we need to curb most emissions are at our fingertips—in the form of commercially proven LCT that is becoming less expensive and more widely available each year. In fact, two-thirds of the emissions reductions needed by 2030 can be achieved through the mass deployment of existing technology in just four sectors: energy, industry, transport, and buildings.

Yet this book also highlights the degree to which the world’s most vulnerable economies are excluded from the promise of these technological solutions. Huge swaths of the globe—especially the poorest countries—are almost completely absent from the LCT market as buyers, sellers, or innovators. Low-income countries accounted for just 0.01 percent of global LCT exports and 0.3 percent of global LCT imports in 2015–16. High-income countries produced 80 percent of all LCT innovations between 2010 and 2015.

Most future emissions are expected to come from developing countries. People in the poorest countries already are at the highest risk for climate-related disasters. With so much at stake, this raises an obvious question: Why aren’t more low-income countries adopting readily available LCT solutions?

The answer involves the most fundamental challenges of development. Transferring technology is a process of collaboration and learning that requires human, physical, financial, and organizational capital—inputs that are scarce in developing countries, particularly in low-income economies. To boost LCT to the necessary scale, developing countries encounter several obstacles. The up-front costs of LCT are high. Using them effectively requires complementary investment in infrastructure, such as power grids and transmission lines. And their success ultimately requires governments to create policies that displace entrenched firms and fossil-fuel based technology while providing long-term incentives for decarbonization.

(13)

Given these obstacles, there is an urgent need to facilitate the transfer of technology to developing countries. This requires getting energy prices right, building human and institutional capital, supporting LCT investment through de-risking mechanisms, and introducing policies that support the uptake of LCT. This is the central message of this book: It is technically feasible to contain global warming to 1.5 degrees Celsius by using existing LCT—but only if it is deployed on a massive scale in developing countries.

Achieving the Paris Agreement goals is perhaps the greatest challenge of our time. To solve it, national and international strategies for low-carbon develop-ment should be strategic, comprehensive, and bold. The recommendations in this volume can help governments design smart, equitable, and politically feasi-ble policies that put countries on the fastest path to a low-carbon future.

Ceyla Pazarbasioglu

Vice President, Equitable Growth, Finance and Institutions World Bank Group

(14)

 xi Technology Transfer and Innovation for Low-Carbon Development was prepared

by a team led by Miria A. Pigato and comprising Simon J. Black, Damien Dussaux, Zhimin Mao, Miles McKenna, Ryan Rafaty, and Simon Touboul. The team worked under the guidance of Marcello Estevão.

The team is grateful to Inchul Hwang and Naoko Kojo for their contributions to chapter 1 and chapter 4, respectively, and to peer reviewers Xavier Cirera, Mark Dutz, Stephane Hallegatte, and Deepak Mishra.

The team also benefitted from comments and advice from Guillermo Arenas, Carter Brandon, Dominik Englert, Phillip Hannam, Dirk Heine, Henry Lee, William Maloney, Mariana Mazzucato, Denis Medvedev, Antonio Nucifora, Joseph Rebello, Michele Ruta, Erin Scronce, Stephen Stretton, Frauke Urban, Gonzalo varela, and Rupert Way.

The team is grateful to Lucy Mukuka, Zakia Nekaien-Nowrouz, and Ivana Ticha for their assistance during the preparation of the report. The financial contribution of the Korean Global Facility on Growth for Development is grate-fully acknowledged.

(15)
(16)

 xiii

Simon J. Black is an economist in the World Bank’s Climate Change Group.

Previously, he was the climate economist of the United Kingdom’s Foreign and Commonwealth Office, a diplomatic service economist (Fast Stream), and a private sector macroeconomist, and served on the United Kingdom’s delegation to the United Nations Framework Convention on Climate Change in the run-up to the Paris Agreement. He holds a master’s degree in international political economy from the London School of Economics and Political Science and a master’s degree in international development from Harvard University, where he was a Frank Knox Fellow.

Damien Dussaux is a researcher at the Centre for Industrial Economics at

MINES ParisTech, PSL University, and a visiting fellow at the Grantham Research Institute on Climate Change and the Environment at the London School of Economics and Political Science. His research interests include the environmental impacts of international trade, the competitiveness impacts of environmental policies, international technology diffusion, and the circular economy. Damien completed his PhD thesis “The effects of environmental reg-ulations on waste trade, clean innovation, and competitiveness in a globalized world” at MINES ParisTech, PSL Research University. Damien graduated as an environmental science engineer from AgroParisTech and has a master’s degree in environmental and energy economics from AgroParisTech, Paris.

Zhimin Mao is a young professional at the World Bank. Previously, she was a

postdoctoral fellow in the Environment and Natural Resources Program at Harvard Kennedy School’s Belfer Center for Science and International Affairs, where she focused on China’s low-carbon development. Before joining the Belfer Center, Zhimin was a PhD fellow at the Pardee RAND Graduate School and an assistant policy analyst at the RAND Corporation. Her RAND experi-ence focused on energy, environmental policy, and international development. She has also worked at the International Institute of Applied Systems Analysis; the Heinz Center for Science, Economics and Environment; the University Corporation for Atmospheric Research; and the Asian Development Bank.

(17)

Miles McKenna is an associate economist at the International finance

corporation. his work focuses on improving private sector diagnostics and strategic engagement to deepen development impact in Ifc client countries. he previously worked as an analyst in the world bank’s macroeconomics, Trade, and Investment global practice, where he assessed opportunities for sustainable economic growth and regional integration through global value chains, trade facilitation, and private sector–led initiatives to improve stan-dards and sustainability. before joining the world bank group, he lectured at Xiamen University. miles holds an msc in global energy and climate policy from soas University of london.

Miria A. Pigato is a lead economist and climate lead in the world bank’s

macroeconomics, Trade, and Investment global practice. before assuming this  position in 2016, she served as practice and sector manager of the macroeconomics and fiscal management global practice. she led senior policy dialogue on growth, climate, macro, fiscal, and trade policy and supervised more than 60 development policy operations for africa, the caribbean, central asia, eastern europe, the middle east, and south asia. currently, she co-leads the secretariat of the coalition of finance ministers for climate action, a group of more than 50 finance ministers committed to taking collective and domestic action on climate change. she holds a master’s degree in economics from the london school of economics and political science and a phd in eco-nomics from University college london.

Ryan Rafaty is a postdoctoral research fellow at climate econometrics, nuffield

college, University of oxford. he is also a senior research officer at the Institute for new economic Thinking at the oxford martin school, where he works with the post-carbon Transition project. his research focuses on the design, evaluation, and political economy of climate change mitigation policies from a comparative, historical perspective. he has published articles in Science, Nature

Climate Change, and other journals. previously, ryan was a consultant in the world bank’s macroeconomics, Trade and Investment global practice; deputy research director at the climate leadership council; and an editor at the

Cambridge Review of International Affairs, among other roles. he completed his phd in politics at King’s college, University of cambridge, in  2017. his dissertation provided a macrocomparative assessment of the politics and environmental performance of low-carbon energy transition policies in oecd countries over three decades, with a focus on the scandinavian countries and germany.

Simon Touboul is a phd student in economics at the centre for Industrial

economics at mInes parisTech, psl University. his thesis focuses on techno-logical innovation and adaptation to climate change. simon’s research interests are the impact of climate finance on climate change adaptation technologies, the effect of extreme weather events on climate change adaptation technolo-gies, and the international diffusion of climate change adaptation technologies. he has worked with the world bank, the grantham research Institute on climate change and the environment at the london school of economics and political science, and the University of cambridge. simon holds a master’s degree in environmental and energy economics from agroparisTech, paris-saclay University.

(18)

 xv

INTRODUCTION

This report is a call to action. It argues that most of the emissions reductions required to achieve the Paris Agreement goals can be reached through the global deployment of existing and commercially proven low-carbon technologies (LCTs). Deploying them at the necessary scale will not be easy, but the evidence clearly indicates that it can be done, and this report describes how.

Technological revolutions have increased the world’s wealth to a level that was once unimaginable but at the cost of accelerating climate change and ecological devastation.1 To limit global warming to between 1.5 and 2.0 degrees Celsius, in line with the Paris Agreement, the world’s greenhouse gas (GHG) emissions must decline to net zero by 2050 and become negative in the second half of this century. Achieving this target will require a rapid and systemic transformation of the energy sector, starting with energy conservation and efficiency and the pro-gressive replacement of fossil fuels with renewable energy. It will also require the widespread deployment and mass-scale transfer of low-carbon technologies2 from high-income countries to the developing world, which this report refers to as the North and South, respectively.3 Although countries in the North have pro-duced the bulk of global GHG emissions, most of future emissions are expected to occur in the South, underscoring the urgency of accelerating North-South LCT transfer.

Without new mitigation policies, emissions are likely to increase to about 65 gigatons of carbon dioxide equivalent (GtCO2e) by 2030. This amount is roughly 41 GtCO2e higher than the maximum level—24 GtCO2e—necessary to contain global warming to 1.5 degrees (UNEP 2017). However, most of the necessary emissions reductions can be achieved by deploying existing, com-mercially proven LCTs globally, while stopping deforestation. Expanding the use of existing LCT in four major sectors—energy, industry, transportation, and construction—could narrow the emission gap by almost two-thirds (figure ES.1).

(19)

Like other forms of technology, the process of developing, adapting, and deploying LCT requires large up-front capital investment, but the returns to that investment are influenced by the presence of complementary infrastructure and the conduciveness of the policy framework. moreover, the capital sunk into the incumbent fossil-fuel value chains and established high-carbon industries cre-ates both economic incentives and political pressure to maintain the carbon-in-tensive status quo. The uncertainty regarding prospective policy changes, such as the introduction of carbon pricing or the elimination of fossil-fuel subsidies creates disincentives to invest in LCTs. Without access to adequate policy sup-port and long-term financing, investments will continue to be biased toward conventional, high-carbon technologies.

Historically, energy transitions have been gradual processes that take at least 50 years. However, several examples of faster transitions create hope for the swift deployment of LCT. These include the rapid adoption of nuclear power in france and the spread of combined heat and power plants in denmark in the late 1970s and early 1980s. Well-designed policies and investments have helped reduce the cost of renewable-energy technologies: between 2010 and 2018, the costs per gigawatt of installed capacity fell by almost 80 percent for utility solar photovoltaic, 54 percent for energy storage, and 22 percent for onshore wind (IEA 2019). Estimates of the unsubsidized cost of renewable energy technologies relative to existing coal generation suggest that renewable-energy technologies are among the least expensive in the United States—and the cost of wind and solar may be even lower when explicit or implicit subsidies are included (Gillingham and Stock 2018). meanwhile, the average time taken to install one gigawatt of renewable energy dropped from 2.6 years in 2013 to 1.9 in 2018. While further reductions in capital and time costs will be necessary to speed the deploy-ment of LCT across the South, these trends are encouraging.

FIGURE ES.1

GHG emissions abatement potential across sectors by 2030

Source: Based on data from UNEP 2017.

Note: Global warming can be contained to 1.5 degrees Celsius by 2030 (lower horizontal line) or to 2 degrees Celsius

(higher horizontal line). GHG = greenhouse gas; GtCO2e = gigatons of carbon dioxide equivalent; LCT = low-carbon technology.

The “big four” industrial technology sectors

Baseline Energy Industr y Forestr y Transpor t Agriculture Buildings Other Potential 65.0 Emissions abatement ( GtC O2 e) –12.2 –0.3 –5.4 –5.3 –4.7 –3.0 –3.7 –1.9 –0.4 –1.0 27.1 2 degrees Celsius (42 GtCO2e) 1.5 degrees Celsius (24 GtCO2e)

(20)

Beyond combatting climate change, the global transfer of LCT represents a major development opportunity for low- and middle-income countries

Over the past two centuries, cross-national differences in the adoption rate of new technologies have accounted for as much as 75 percent of the divergence in per capita incomes between developed and developing economies (Comin and mestieri 2018). Policies to accelerate the deployment and adoption of LCT can expand energy supply and improve energy security, enhancing economic pros-pects by accelerating productivity growth while improving the public welfare through gains in utility access and environmental quality. fast-growing LCT sec-tors also provide opportunities for firms in developing countries to integrate into global value chains, creating new drivers of economic growth and job creation. Countries with the absorptive capacity and competencies to adopt LCT and innovate are more likely to attract foreign direct investment (fdI), accelerate technological advancement, boost productivity through spillovers, and capital-ize on increased export competitiveness.

Transferring LCT is a process of collaboration, learning, and adaptation

Effective technology transfer encompasses not only physical hardware (e.g., solar panels and wind turbines) but also the technical know-how and capabili-ties necessary to understand, operate, and maintain new technologies, as well as institutional and policy arrangements that facilitate technological uptake and encourage local innovation (Lema and Lema 2012; Sampath and roffe 2012; Cirera and maloney 2017). Thus, LCT transfer is a process of learning and inter-active collaboration. To be sustainable, it requires the capabilities to deploy, operate, maintain, adapt, improve, and reproduce the transferred technology and, ultimately, the capacity to invent new technologies. This process can be visualized as the “technology-transfer staircase” (figure ES.2), which shows the different stages of technology transfer, from the importation of foreign technol-ogies by firms and households (adoption and diffusion) to the adaptation of those technologies to the local context (imitation and collaborative innovation) to the domestic creation of new technologies (indigenous invention). The first two steps of the ladder rely on imports, but the next three offer the possibility of developing and producing technologies for export.

FIGURE ES.2

The technology-transfer staircase

Adoption Diffusion Imitation Collaborative innovation Production with export potential Import of technology Indigenous invention

Note: The figure shows different stages of technology transfer, from importing a foreign technology to

domestic production with the potential for further innovation. The technology-transfer staircase is an homage to, but separate from, the capabilities escalator of firm and state capabilities needed to achieve higher levels of innovation sophistication (Cirera and Maloney 2017).

(21)

firms and households benefit from imported technology, but local firms initially lack the ability to significantly modify or reproduce it. As domestic capabilities develop, countries become able to diffuse imported technology more widely across economic sectors. Eventually, domestic firms acquire the capacity to imitate foreign products and production methods, but they still rely on intellectual property developed and owned abroad. Collaborative innova-tion between domestic and foreign firms (for example, through joint ventures) begins to create the domestic capacity to develop original technologies, confer-ring some degree of local control and ownership over the technological upgrad-ing process. Ultimately, the country’s domestic research and development capacity evolves to the point that it can produce, commercialize, and potentially export technologies based largely or entirely on locally owned intellectual property. However, progression up the technology staircase is not automatic, and countries can languish for years or even decades at the lower steps.

Climbing the technology staircase requires an increasingly complex system of capabilities

Progressing to higher levels of technological sophistication requires comple-mentary inputs, including human, physical, financial, institutional, and organi-zational capital, which are often scarce in developing countries. This scarcity largely explains why so many countries in the South underinvest in importing and diffusing foreign technologies. As a country progresses up the staircase, firms and workers require ever-increasing skill levels, culminating in the capac-ity to develop new and original products. meanwhile, governments must provide the institutional and administrative framework necessary to support the econo-my’s growing technological complexity, including public investment in educa-tion and physical capital (figure ES.3).

FIGURE ES.3

National capabilities that influence technology transfer

Human

Organizational

Institutional Physical

(22)

reaching the last step of the staircase presents significant challenges for both public and private sectors. This report finds that, across countries, human capital is the strongest predictor of high performance in LCT trade and innova-tion, followed by institutional and physical capital.4 Economies with greater endowments of human, institutional and physical capital tend to import and export more LCTs and to innovate more. Human capital also appears to be among the most important factors for accelerating LCT transfer within coun-tries. moreover, countries that have growing economies, large markets, and a deep base of productive capital are better positioned to make the large upfront capital investments required to diffuse, produce, and export LCT. Organizational and institutional capital appear to matter more for importing than for exporting LCT. finally, financial-sector development marginally encourages LCT imports, but the observed effect is surprisingly small. This finding indicates that strate-gies to improve educational outcomes, increase the infrastructure stock, or build institutional capacity may be more effective in accelerating LCT transfer than efforts to deepen the financial sector.

recognizing the pivotal role of North-South LCT transfer in reducing GHG emissions, this report is designed to assist client governments in defin-ing national strategies to facilitate LCT adoption, absorption, and innovation. The next section of this executive summary describes evolving trends in international LCT transfer, as proxied by trade, fdI, and patent data. The analysis is complemented by a case study on the rise of the electric vehicle (Ev) industry in China, which has successfully leveraged domestic policies to produce, and export LCT. This example and other cases from the international literature offer lessons for how policymakers can help adopt, deploy, and produce LCT in the context of their capacity constraints and development objectives. The final section concludes the executive summary with a concise review of policy options for accelerating North-South LCT transfer.

KEY FINDINGS

LCT represents a growing share of global trade, but the world’s poorest countries are the least able to benefit from trade in LCT

This report finds that LCT represented roughly 4 percent of global trade in 2016, but its growth rate has outpaced the growth rate of global trade over the past several decades. LCT exports grew at a compound annual growth rate of 11.1 percent from 1990–2016, exceeding the growth rates of total exports (9.7 percent), merchandise exports (6.0 percent), and all high-technology exports (3.4 percent). The North accounted for more than 70 percent of total LCT exports and 62 percent of imports by value in 2016.

Within the South, low-income countries accounted for just 0.01 percent and 0.3 percent of total LCT exports and imports respectively in 2015–16. South– South trade in LCT has increased, but it has yet to have a transformational effect on low-income economies. moreover, although the South has become more integrated into LCT trade networks, the world’s poorest countries remain on the periphery. South–North LCT trade flows have also grown, albeit from a negligible base, but only a few countries participate in this trade pattern.

(23)

China is the world’s largest importer and exporter of LCT. In 2016, China accounted for 15.9 percent of total LCT imports, ranking ahead of the United States (13.2 percent) and Germany (6.9 percent). China also accounted for 16.8 percent of LCT exports in 2016, (table ES.1) and 56 percent of the total value of South–North LCT exports. by contrast, brazil, India, and South Africa accounted for a combined 4.3 percent of South–North LCT exports.

With the notable exception of India, LCT exports from countries in the South tend to be concentrated in a small number of goods and markets. for example, South Africa’s top LCT exports consistently account for over half its total LCT exports, most of which are destined for Germany. Similarly, China and mexico’s top-five LCT exports accounted for over half of their total LCT exports in 2017. In terms of imports, India is the only country to import more LCT from the South—primarily China and other upper-middle-income countries—than from the North. This pattern appears to indicate the India is not importing the most advanced technologies from high-income countries, but is instead importing more suitable or affordable technologies from its peers in developing countries.

FDI is a critical channel for technology transfer to developing countries, and countries with larger markets and more sophisticated capabilities attract greater FDI in renewable energy

After growing steadily before the 2008–09 financial crisis, fdI in renewable energy has become highly volatile.5 fdI in renewable energy totaled US$82.5 billion in 2018, with one-third of investments originating from countries in the South.6 China has quietly emerged as the global leader in renewable energy investment, and in 2018 it overtook Germany as the top foreign direct investor in renewable energy. China accounts for 45 percent of total global investment in renewable energy, and its total investments in the sector (including both fdI and domestic projects) exceeded the combined total investment of all other

TABLE ES.1 Top-10 LCT exporters, 2016

ECONOMY TOTAL LCT EXPORTS (US$, BILLIONS) SHARE OF LCT EXPORTS (%)

All economies 698.5 100.0 China 117.6 16.8 Germany 87.5 12.5 United States 77.1 11.0 Japan 51.3 7.3 Korea, Rep. 45.0 6.4 Italy 23.8 3.4

Hong Kong SAR, China 20.8 3.0

Taiwan, China 20.1 2.9

United Kingdom 19.7 2.8

Singapore 19.3 2.8

Source: World Bank World Integrated Trade Solution (database); https://wits.worldbank.org/. Note: SAR = Special Administrative Region.

(24)

countries in 2017 (rEN21 2018). South–South investment accounted for 14.1 percent of all renewable energy investment between 2003 and 2018. most of this investment has gone toward large hydropower projects, and many devel-oping countries—notably China—have cultivated expertise in hydroelectric technologies.

Countries with large domestic markets and more sophisticated capabili-ties tend to attract more fdI in renewable energy while the poorest countries have attracted much less investment and had fewer opportunities to bene-fit from technological spillovers. between 2003 and 2018, India was the largest recipient of fdI in renewable energy, followed by brazil and mexico (table ES.2).

Only 13.2 percent of renewable energy investment in the top three countries went to manufacturing, and most was focused on electricity production. These three countries are not major exporters of LCT, suggesting that inbound fdI has not yet transformed their production and export dynamics. Notably, China received relatively little fdI in renewable energy over the period.

Innovation in LCT is growing faster than innovation in other technologies, but almost no new LCT is being transferred to low-income countries

between 1990 and 2015, the annual growth rate of LCT patents averaged about 8 percent per year, twice the average growth rate for all technologies.7 High-income countries produced at least 80 percent of LCT innovations in all technological fields over the period. Japan produced the largest share, followed by the United States, Germany, the republic of Korea, and China (figure ES.4). This order was broadly similar across technological fields. However, lower-middle-income and low-income countries produced almost no LCT innovations during the period.

China has become a global leader in LCT innovation, but China’s share of LCT inventions remains small relative to its share of global carbon emissions. moreover, only a small percentage of China’s LCT patents is transferred abroad,8 raising questions about the quality of these inventions.

between 2010 and 2015, roughly 71 percent of all patent transfers occurred between countries in the North. Only 23 percent of LCT patent transfers went from high-income to middle-income countries, and only 4 percent went from middle-income to high-income countries. Almost no patents were transferred

TABLE ES.2 Total renewable-energy FDI by destination, source, and subsector, 2003–18

DESTINATIONS RE INVESTMENT (US$, BILLIONS) TOP-THREE SOURCE ECONOMIES TOP-THREE SUBSECTORS India 29.9 China, United States, United Kingdom Solar, wind, other Brazil 27.5 United States, Spain, France Biomass, wind, solar Mexico 26.2 Spain, United States, Italy Solar, wind, hydro South Africa 14.3 Italy, Ireland, Saudi Arabia Solar, wind, biomass

China 14.2 United States; Canada;

Hong Kong SAR, China

Wind, solar, biomass Korea, Rep. 4.2 Germany, United States, Japan Biomass, solar, other Source: Calculations based on fDi Markets (database) https://www.fdiintelligence.com/fdi-markets.

(25)

to or from low-income countries. Within countries in the South, China received the largest number of inbound LCT patents. between 2010 and 2015, firms from the North filed more than 90 percent of the inbound LCT patents in China.

Restrictive FDI policies and tariffs inhibit LCT transfer—but nontariff barriers may encourage it

Econometric analysis of patent data from 75 countries observed during 2006–159 suggests that restrictive trade and fdI policies unequivocally discourage tech-nology transfer. However, nontariff barriers tend to increase techtech-nology transfer by encouraging firms to interact with foreign markets through fdI rather than trade. Nontariff barriers—such as import quotas—set a limit on the goods that can be imported. When the import quota is met, fdI becomes the only way to further exploit the technology that produces those goods. Subsidies that encour-age foreign firms to enter the domestic market have a similar effect. by contrast, controls on the movement of capital and people have a substantial negative impact on LCT patents transferred by both high-income and developing countries.

because fdI tends to be more knowledge-intensive than trade in capital goods, the positive effect of nontariff barriers on fdI more than compen-sates for the negative effect of nontariff barriers on trade. Nontariff barriers tend to be most effective in promoting technology transfer through an increase in fdI in countries that have large domestic markets, which make fdI in domestic production more profitable. In addition, countries with growing populations tend to receive more patent transfers from the South, whereas wealthier countries receive more transfers from both the North and the South.

The influence of other policy variables is more ambiguous. In principle, strong protections for intellectual property rights (IPr) can encourage market entry by foreign firms, whose intellectual assets are shielded from imitation by

FIGURE ES.4

Share of LCT innovations, by country

Source: Calculations based on PATSTAT (database), https://www.epo.org/index.html.

Japan, 24% Korea, Rep., 10% Others, 27% China, 8% United States, 16% Germany, 15%

(26)

domestic competitors. IPr protections, however, can also enhance the market power of patent holders, creating monopolistic price distortions that disadvan-tage local competitors. The analysis presented in this report finds that strong IPr protections have no significant effect on LCT transfer from either high-income or developing countries.

Local technological capacity has similarly complex implications for patent transfer. Although some local capacity is necessary to exploit transferred technology, a very high degree of local capacity can increase the risk of imitation, potentially deterring foreign patent holders from transferring their technologies. Strong IPr protections can mitigate this risk, but only partially. Likewise, stringent environmental protections can encourage innovation and boost LCT transfer, but they can also increase public investment in research and development, which may crowd out private investment and discourage technology transfer.

China’s success in the electric vehicles market illustrates both the challenges and the rewards of reaching the final step on the technology-transfer staircase

China’s initial push into the electric vehicle (Ev) market was driven by a combi-nation of domestic objectives targeting pollution control, energy security, and economic growth. building on a decade-long process of investing in research and development, the government launched an ambitious pilot program in 2009 designed to promote the development of Evs in several cities and regions. This program, known as “Ten Cities, Thousand vehicles,” was centralized, but the pilot cities had significant leeway to establish rollout models that reflected their circumstances, with variation in models yielding important lessons to guide national rollout.

multiple structural, technical, and market constraints prevented the program from achieving its anticipated outcomes. for example, firms realized that the creation of a national Ev industry would require developing uniform industrial standards for battery types and designs for public buses, all of which were missing. It also became clear that the transition from conventional vehicles to Evs would require better incentives, as well as close coordination among auto manufacturers, battery developers, infrastructure providers, and consumers. reacting quickly to the program’s initial failure, the government significantly increased subsidies to Ev manufacturers and developed a network of charging facilities and services based on unified standards. Working closely with the government and local authorities, the Ev firms focused on producing cheaper, better-designed models tailored to the preferences of Chinese consumers. This time the program succeeded and, by 2015, China had become the world’s largest Ev market. In 2007, only 100 Evs were sold worldwide; by 2018, this figure had reached 2 million, with China accounting for half of the total.

Several lessons can be gleaned from this experience. first, the Chinese government’s vision and support—including the construction of infrastruc-ture networks—were essential to enable Ev producers to overcome the entrenched dominance of conventional vehicles. Second, industrial policies were vital to support Ev development and deployment. for example, China’s strategy of encouraging municipal governments to invest in charging facili-ties and applying favorable tax and regulatory treatment to Evs played a

(27)

major role in accelerating Ev uptake. Third, contrary to China’s traditional automotive market, which is dominated by joint ventures between foreign and domestic companies, the Ev market was dominated by wholly domestic firms. China’s Ev industry was not a product of the “Trade Technology for market” policy. Under this policy, foreign companies in strategic sectors are required to share their technology as a condition to gain access to the Chinese consumer market, which Chinese critics have long argued encourages Chinese firms to rely on outdated imported technologies instead of investing in domestic research. by contrast, the growth of the Ev industry was driven by the capacity of domestic firms to innovate and to tailor their products to the specific circumstances of the Chinese market.

China’s success in the Ev market ultimately hinged on the government’s abil-ity to learn from failure and persevere until it found an approach that worked, but the costs of sustaining the creation of the Ev industry were astronomical. In 2016, subsidies for battery-powered vehicle models were about US$2,000 per vehicle in California, US$4,500 in Sweden, and US$8,000 in China (yang et al. 2016). China was able to afford this level of subsidization, but most countries cannot. moreover, even China eventually changed course again: After realizing that its Ev subsidies were excessive and untargeted, it decided to phase them out almost entirely by 2020 and to replace them with several targeted regulatory initiatives.

China’s Ev experience provides some insights into the challenges of delivering Evs to a mass market through centralized leadership and industrial policies. Other countries—such as the United States, Germany, India, and Sweden—have adopted different models, with various degrees of success. markets are driven by the interaction of individual firms within the context of national regulatory frameworks, and box ES.1 analyzes the experience of two comparably successful Ev companies, one in China and one in the United States. These two companies employed two very different strategies, highlighting the ongoing process of experimentation that characterizes the Ev market.

Two paths to leadership in the global electric vehicle market

Electric vehicle (Ev) manufacturers build your

dreams (byd), a Chinese company, and Tesla, a U.S. company, provide a case study of how two different business strategies enabled these firms to become leaders in the global Ev market.

founded in Shenzhen in the mid-1990s, byd embraced the Chinese government’s vision of transi-tioning to low-carbon energy, which entailed

promoting a massive increase in Ev production and sales. byd currently owns 30 percent of China’s Ev market and is the largest producer of plug-in vehi-cles globally. Tesla’s mission is “to accelerate the world’s transition to a sustainable energy future.” Tesla currently dominates the U.S. Ev market, and its model 3 was the best-selling electric car in the world in 2018.

BOX ES.1

(28)

POLICY IMPLICATIONS

The five chapters of this report yield multiple recommendations for facilitating the transfer, adoption, production and creation of LCT. Each country has its own development objectives and faces its own unique constraints. Countries with limited capabilities may prefer to focus on leveraging LCT to expand energy access, improve energy efficiency, or help domestic firms become more cost-competitive. Countries with higher levels of capability may be more willing to assimilate imported technology and eventually develop their own LCT industries. The global transfer of LCT is not only a necessity to achieve climate objectives but also an opportunity to achieve development goals. The policies needed to deploy LCT could also raise output, employment and competitiveness while yielding ancillary welfare benefits, such as reduced air and water pollution. moreover, adopting LCT offers an opportunity for economies seeking export-led growth to become LCT producers and exporters.

Establish effective policies to get energy prices right while building human, physical, and institutional capital

Across countries, the policy environment for LCT must be aligned with their overall development objectives. for example, by reducing or eliminating fossil fuel subsidies and implementing carbon pricing, governments can systemati-cally shift the incentives faced by firms and households toward low-carbon energy. but carbon pricing often faces significant political opposition, and other measures may be needed to accelerate the deployment and production of LCT. Investing in human capital and in low-carbon infrastructure—including public transportation and energy infrastructure—is vital to boost the capabilities of firms and households to embrace LCT.

Although the leaders of byd and Tesla are both innovators capable of influencing entire industries, the differences between their business strategies during the past decade are striking. byd closely guarded its technology, whereas Tesla made its pat-ents publicly available. byd initially positioned itself in the low-end market; Tesla began at the high end. byd imitated foreign technologies and exploited a niche market that foreign automakers were exiting; Tesla partnered with established conventional vehi-cle manufacturers to alleviate the constraints imposed by its limited automotive experience. Whereas Tesla has been criticized for overpromising and underdelivering and has suffered serious

financial problems, byd has overdelivered on its objectives and expanded rapidly in both the domes-tic and international markets. byd’s profitability, however, has hinged on its access to Chinese govern-ment subsidies, which have been far more generous than those available to Tesla.

Although both companies were successful, Tesla may contribute more than byd to the development of a global Ev market with its “open innovation” approach to intellectual property rights. Open innovation—coupled with a strategic focus on alliances and partnerships—appears to offer Ev firms a means to thrive in a world of global competition and rapid technological change.

(29)

Support private investment in LCT deployment through de-risking mechanisms

Although returns to investment in technology in developing countries should be higher than in developed countries, country-specific risks—both actual and perceived—reduce expected returns across all types of LCT investment. High financing costs may render investment in LCT infeasible. Given the insuffi-cient supply of long-term private capital to support decarbonization, public support is crucial. de-risking instruments, including loan guarantees, public equity co-investments, and political risk insurance, can help address the underlying causes of policy risk and accelerate private investment in LCT.

Introduce demand-pull policies to create a market for LCT

Policies that support the demand for technologies—demand-pull policies—can be especially effective in encouraging the uptake of LCT. direct subsidies and feed-in tariffs have proven effective in making renewable energies cost-competitive with fossil fuel technologies, though they often entail consider-able costs. Public outreach campaigns designed to raise awareness of the costs and risks associated with climate change can foster positive social norms around consumption. regulatory standards and labeling requirements can help overcome informational constraints. Governments can also increase LCT demand directly through their public procurement and investment policies, and they can provide financing to help firms and household transition to LCT. Partnerships between the government, public utilities, the private sector, and academic institutions can build the human capital necessary to support LCT deployment and supply LCT directly to low-income households as part of broader efforts to achieve energy-access and distributional-equity objectives.

demand-pull policies tend to be most effective in large markets. market size influences both the production and deployment of LCT, and countries with large consumer markets are well-positioned to leverage demand to advance their LCT goals. However, demand-pull policies can also be effective in smaller countries, especially if they pool their market size through policy harmonization and regional integration.

Focus on technology-push policies to drive innovation and support LCT production and exports

Supply-side policies that encourage technology innovation—technology-push policies—are especially appropriate for countries seeking to spur LCT innovation, production, and exports. determining which policies will work in which context, however, remains a key challenge for innovation policy in general and for LCT production and exports in particular. developing countries seeking to innovate, produce, and export LCT require sophisticated national capabilities, long-term strategic planning, and an especially aggressive mix of demand-pull and technology-push policies. Countries that reach this stage are likely to experience accelerated productivity growth, as LCTs tend to be more complex than other technologies, with dense backward and forward linkages across multiple value chains. Consequently, the value of capturing part of a complex and growing sector may outweigh the risk-adjusted costs of investing in LCT. Within this

(30)

context, governments should adopt a policy approach designed to create—rather than pick—winners, which can reduce the risk of generating distortive rents. for example, governments can support intermediaries such as accelerators and technology centers that help firms and workers develop the capabilities to innovate, including the necessary managerial and absorptive capacity, rather than directly supporting specific firms.

Poorer countries tend to face more and deeper market failures involving technology, and they often have less domestic capacity to address those failures effectively. As these countries develop, policymakers should alter their LCT policies to reflect their expanding national capabilities, as well as other dynamic country- and technology-specific variables. However, the combination of technology-related market failures and limited national capabilities can leave low-income countries stuck in a “technology trap.”10 Increasing external assistance for LCT transfer may be necessary to free low-income countries from the technology trap.

Use environmental provisions in multilateral trade and investment initiatives to accelerate LCT transfer

bilateral and regional trade agreements can enable trade liberalization and envi-ronmental protection to support and reinforce each other. The number of such agreements has soared over the past three decades, as has the number of envi-ronmental provisions they contain (monteiro and Trachman, forthcoming). Committing to a clear path of sequenced reforms to support environmental objectives can boost economic and welfare gains and the inclusion of environ-mental provisions in trade agreements correlates with increased trade flows (berger et al. 2020). Trade agreements have also helped to drive bilateral and multilateral cooperation on issues such as product standards and environmental subsidies.

multilateral trade liberalization is vital to accelerate LCT transfer. In 2014, 46 members of the World Trade Organization (WTO) initiated negotiations for an Environmental Goods Agreement (EGA) designed to remove barriers to trade in goods with positive environmental or climate change impacts. However, these negotiations stalled in 2016. Completing the EGA could accelerate LCT transfer worldwide. Although reaching consensus on a list of environmental goods is likely to be a challenge, unilateral tariff reductions offer an immediate incentive to increase trade in LCT-intensive goods and services. Econometric analysis suggests that low-income countries would experience the greatest increase in LCT imports and the largest welfare gains from the elimination of tariffs on LCT (de melo and Solleder 2018)—including expanded access to clean, lower-cost energy—which would disproportionately benefit low-income households (mahlstein and mcdaniel 2017).

International investment agreements could accelerate LCT transfer to devel-oping countries by reducing fdI restrictions and stimulating both foreign and domestic investment. International investment agreements should, however, include a degree of flexibility to accommodate the “increased ambition” man-dated by the Paris Agreement.11 for example, they should allow for the periodic tightening of mitigation and adaptation policies in the Nationally determined Contributions (NdCs), and they should include correction mechanisms that enable countries to adjust their policies in response to new information about

(31)

environmental risks. finally, international investment agreements could encour-age countries to provide greater policy certainty by clearly communicating their term climate objectives and transparently integrating them into their long-term macroeconomic and sectoral development strategies.

Adopt new IPR agreements for accelerating the transfer of LCT

The international experience underscores the importance of IPr protections to promote the development of new technologies but the urgency for the rapid deployment of LCT to avert the catastrophic impact of climate change provides a compelling rational for sharing the intellectual property that underpins LCT. firms are interested in both profiting from the diffusion of their innovation and avoiding expropriation by imitating firms. To balance these interests, industries with historically high rates of patenting and records of operating in environments with complementary technologies— such as aircraft manufacturing, semiconductors, mobile telecommunica-tions, and electricity metering—have managed to accelerate innovation and diffusion simultaneously by adopting technology-standards agreements and cooperative IPr arrangements, including cross-licensing (Iliev and Neuhoff 2009).

Patent pools, which are agreements between two or more patent owners to collectively manage IPrs, have the potential to accelerate LCT transfer, follow-ing the example of the biomedical and pharmaceutical industries. However, this approach would need to be incorporated into the international IPr architecture and linked to appropriate sources of financing. In the near term, a “club” of coun-tries could take the lead by creating collaborative patent pools to facilitate the cost-efficient transfer of the most promising LCT (maskus 2010).

Mobilize the UNFCCC to facilitate the transfer of LCT to the poorest countries

International institutions and donor countries could play a much larger role in facilitating transfer of LCT to the poorest countries, including via the UNfCCC process. Increasing the amount of resources allocated to publicizing successful examples of technology transfer could provide critical knowledge for policy-makers striving to promote LCT transfer and innovation. In addition, a much stronger commitment by upper-middle-income and high-income countries to explicitly include technology-transfer objectives in their NdCs would signal their commitment to facilitating the spread of LCT.

The UNfCCC has yet to formulate a comprehensive international framework to address the challenges of South-South LCT transfer. While this pattern of LCT transfer is likely to accelerate in the medium term even in the absence of a comprehensive international policy framework, a consis-tent focus on the unique dynamics of South–South LCT transfer within the existing framework could have a highly positive impact. The poorest coun-tries have the most to gain from South–South LCT transfer, and the UNfCCC has a key role to play in overcoming their pervasive market failures and domestic financial and institutional capacity constraints. Low- and lower-middle-income countries should lobby the UNfCCC and the WTO to develop cooperative and differentiated IPr arrangements designed to

(32)

promote LCT transfer, following the example set by the health sector for HIv-AIdS medicines. Cooperative IPr arrangements such as cross- licensing, patent pooling, technology-standards agreements, and other forms of technology sharing could have the greatest positive impact in the poorest countries with the least access to finance.

finally, resources from the Green Climate fund could be used to meet the full cost of acquiring the IPrs to LCT, which should be provided to developing countries at no cost. This recommendation was initially put forward by the working group on the durban Platform for Enhanced Action in 2015.12 However, due to a lack of consensus among participant nations, the final version of the Paris Agreement did not include this provision. Instead, the agreement relies on technology networks and alliances to promote the diffu-sion and dissemination of green technologies. Given the critical importance of accelerating LCT transfer to developing countries, the Green Climate fund could leverage its unique network, institutional capacities, and financial resources to acquire ownership and dissemination rights to patent-protected LCTs and make them available to the poorest countries. Technology dona-tions, aided by voluntary patent-pool agreements, could minimize the cost of this approach.

CONCLUSIONS

Achieving the Paris Agreement goals presents an immense challenge, reflecting both the global dependence on fossil fuels and the tremendous barriers to the deployment of LCT in developing countries. The five chapters of this report document the limited but encouraging progress achieved in LCT transfer, highlight key obstacles to LCT deployment and innovation, and present practical recommendations. The overarching conclusions of the analysis can be summarized as follows:

• National strategies for low-carbon development should be strategic, comprehensive, and bold. Key elements of a successful national strategy would include: (i) phasing out subsidies for fossil fuels and implementing an economy-wide price on carbon; (ii) building the technological capabilities necessary to adopt, imitate, and ultimately create LCT; (iii) strengthening regulatory frameworks to boost investor confidence in the political commitment to low-carbon growth; (iv) adopting demand-pull policies such as feed-in tariffs, fiscal incentives, public outreach campaigns, and policies to strengthen LCT-intensive public procurement, investment, and financing; and (iv) implementing technology-push measures to support LCT innovation, production, and exports, particularly in countries with adequate capabilities.

• The international climate architecture should be strengthened to favor the least-developed countries. Effectively strengthening the climate architecture would require: (i) balancing appropriate IPr protections with the necessity to facilitate cost-efficient LCT transfer; (ii) supporting the creation of patent pools, as well as other cooperative IPr agreements; and (iii) advocating for the introduction of environmental provisions into multilateral trade and investment initiatives designed to accelerate LCT transfer.

Figure

FIGURE ES.1
TABLE ES.2  Total renewable-energy FDI by destination, source, and subsector, 2003–18
TABLE 2.4  Top-10 South LCT importers, by value, 2016
TABLE 2.6  Top-10 South exporters of LCT, by value, 2016
+7

Références

Documents relatifs

As we have shown, commercialization was part of NASA’s human spaceflight activities and its in- orbit operations since the early 1980s during the early stages of the Shuttle

L’archive ouverte pluridisciplinaire HAL, est destinée au dépôt et à la diffusion de documents scientifiques de niveau recherche, publiés ou non, émanant des

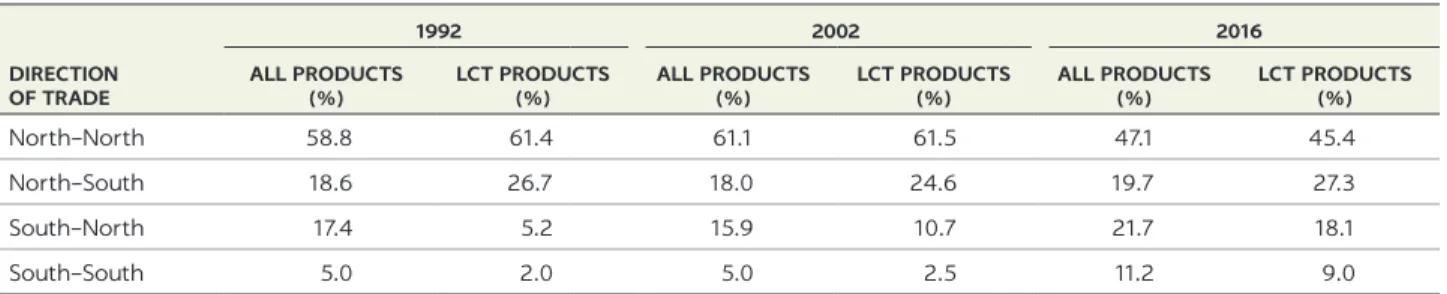
This increase is of course not exclusively linked to purely technological determinants and also represents an increase in the average economic value of

We construct a poverty profile of the SHGs (treatment group) and the non-SHG member (control group) in 2003 using standard measures such as the headcount

This report has been compiled using country-level data reported to WHO on the procurement of ART via the Global Procurement Reporting Mechanism (GPRM) (4) , the WHO database on

Summary. — The evolution from 2000 to 2050 of the needs in concrete, steel, aluminium and copper to build the infrastructure of electricity generation is mod- elled for the scenarios

Mitigation Combustion Efficiency Wind Solar Thermal Smart Grids PV energy Nuclear Hydrogen Hydro Geothermal Energy Fuel From Waste Energy Storage Sea Energy CCS Biofuels Knowledge

This paper explores the skills shortages that the transition to a clean-energy society is likely to face. Section II reviews insight from existing literature concerning the causes of