Potential of Determining Moisture
Content in Mineral Insulating Oil by
FTIR Spectroscopy
Key Words: mineral transformer oil, FTIR spectroscopy, acetonitrile, water content, moisture, Karl
Fisher test
Introduction
Transformer oils are vulnerable to moisture, which can have adverse effects including a dramatic reduction in die-lectric strength, accelerating the aging of cellulose (depol-ymerisation) and the formation of decompositional gasses at high temperatures. A moisture content exceeding 50% of oil saturation greatly reduces the breakdown voltage, re-sulting in catastrophic failures as well as the potential for transformer fires.
For these reasons, it is imperative that transformer oils be analyzed on a regular basis to verify that their moisture contents are within safe limits. The standard method used for this purpose is Karl Fischer (KF) titration, which is con-sidered the gold standard for moisture determination in terms of both accuracy and sensitivity. The principle of this method is based on the generation of iodine which quanti-tatively reacts with the water molecules (H2O) present in
the material analyzed. Water and iodine are consumed in a 1:1 molar ratio and by determining the amount of iodine consumed, the amount of water present in the sample can be determined. However, the KF method can also overesti-mate water content because iodine can react with peroxides, acids and other impurities that may be present as a result of oil degradation [1], [2].
Fourier transform infrared (FTIR) spectroscopy has be-come a common analytical tool available in most laborato-ries, providing a ready means by which the molecular makeup and functional groups present in oils can be exam-ined. Mid-FTIR analysis of oil provides direct information about the molecular species present in the oil and has been used to determine antioxidants, moisture and oil oxidation products.
Infrared spectroscopy has long been a simple means to measure moisture in oils, given its strong OH absorptions, however, the presence of other hydroxyl containing constit-uents (e.g., phenolic antioxidants, oxidation products) and particularly the confounding effects of hydrogen
Y. Hadjadj and I. Fofana
Canada Research Chair, Tier 2, on Insulating Liquids and Mixed Dielectrics for Electrotechnology (ISOLIME), Univer-sité du Québec à Chicoutimi, Chicoutimi, QC, Canada.
F. R. van de Voort
Department of Food Science and Agricultural Chemistry, Macdonald Campus, McGill University, Québec, Canada.
Denis Bussières
Research Laboratory on Atmosphere Quality (LARQA) Université du Québec à Chicoutimi, Québec, Canada.
bonding make it difficult to quantify except in simple and standardized oil matrices. Even with these issues, moisture screening by FTIR spectroscopy has become a common component analyzed for in automated condition monitoring of in-service lubricants as part of the ASTM Practice E2412 [3], [4].
In E2412, moisture is not quantified per se, its absorbance changes are trended with the spectral regions used being defined by the oil type (e.g., mineral vs. ester) analyzed. As such, this methodology is mainly used for sample screening; oils flagged as containing excessive moisture undergoing further confirmatory analysis. Although calibration and direct measurement of moisture is possible in some lubricants using acetonitrile extraction, FTIR is relatively insensitive and the methodology is generally suitable only for moisture contents of > 250 ppm [5].
According to the IEEE C57.106-2002 [6] standard, for a transformer with a maximum voltage 69 kV, the limit of
This article investigates a Fourier transform
in-frared-based method founded on the extraction
of oil-moisture into dry acetonitrile for
deter-mining the moisture content in transformer oils.
acceptable water content in mineral oil is 55 ppm at 70°C, with this value decreasing to 15 ppm for a transformer >230 kV. Conventional FTIR is not adequately sensitive to make direct measurements in this low moisture range and is further confounded by other OH constituents often being present along with the hydrogen bonding effects they induce [5]. These limitations led to an alternate approach by van de Voort et al [5], [7], [8] based on the extraction of moisture from edible oils and lubricants using dry acetonitrile. Moisture is then quantified spectrally in the acetonitrile-moisture extract based on a calibration using gravimetrically prepared acetonitrile-water standards. This article describes the adaptation of this spectroscopic approach to the analysis of moisture in new and used mineral-based transformer oils in relation to the KF method.
Overview
FTIR spectroscopy has become a very powerful tool for
monitoring the condition of in-service lubricants and engine oils, since it identifies and trends key additives, contaminants and breakdown products [9]. Because each functional group has a distinct absorption it can be readily identified and typically moisture, glycol, organic acids, soot and specific additives can be identified and trended providing a means by which machinery and engine health can be monitored on an ongoing basis. One of the key benefits is that FTIR analysis can be automated when coupled to an autosampler and allows high throughput of samples. Similarly, the use of FTIR spectroscopy as a tool to assess the condition of transformer insulating oils for amine antioxidants is now common. The examination of transformer oils for oil/paper condition has also been investigated [10] and Percherancier and Vuarchex [11] have used FTIR spectroscopy to detect additives and contaminants in the insulating oil. Recently, a portable FTIR system for online analysis of insulating oil/paper condition has been developed. This system is able to estimate the degree of polymerization of the insulating paper within the transformer windings, using chemometric methods [12], [13].
Experimental
Products and Materials
HPLC-grade Acetonitrile was used to extract moisture from oil. To ensure solvent dryness it was kept over a 3-4 Å molecular sieve. The solvent was dispensed using a re-pipette designed to preventing moisture ingression by being equipped with a molecular sieve protected inlet for the pump. Transformer mineral oil conforming to ASTM D3487 was used throughout this study. Aged samples of this oil were also prepared by subjecting new oil to accelerated aging in a convection oven at 100°C for 2500 h attaining an interfacial tension of 14 dyne/cm, indicating advanced state of degradation (oxidation). Spectroscopy was performed on Perkin-Elmer FTIR using a 1000 µm ZnSe transmission flow
cell [7]. All spectra were collected using eight scans at resolution of 8 cm-1 (~30 s of scanning).
Analytical Protocol
Sample preparation and the analytical protocol, including spectroscopy are outlined in Figure 1. By trial and error, a ratio of 3:1 (v/v) oil: acetonitrile was established as ideal, with 9 ml of oil and 3 ml of acetonitrile being added to a 15 ml centrifuge tube. The oil-acetonitrile tube was capped, vortexed for 2 minutes and then centrifuged for 2 minutes at 2000 X g to separate the acetonitrile from the oil. A second companion tube of the same dry acetonitrile used to prepare and extract the moisture from the oil sample is also prepared.
The upper acetonitrile layer of the sample extract is loaded into the transmission flow cell using a micro-liter pipette and its absorbance spectrum recorded (S). The reference spectrum of the companion dry acetonitrile used to extract the moisture from the oil is also recorded (R). A differential spectrum (∆S = S-R) is calculated which only reflects the spectral contributions associated with what has been extracted; the original acetonitrile and any inherent moisture it contained having been ratioed out in the resulting differential spectrum.
Figure 1. Schematic diagram of the sample preparation procedure for moisture analysis of transformer mineral oils and the FTIR spectral analytical protocol.
Calibration and Validation
New and thermally “aged” oils were split into two parts with ½ dried using a vacuum pump and silicagel and ½ placed over excess moisture to produce “wet” and “dry” new and aged oils, respectively and their moisture content (ppm w/w) was determined periodically by KF. At the end of this procedure, calibration standards with humidity varying between 2 and 43 ppm were prepared. The wet and dry versions of each oil type were in turn blended gravimetrically in various proportions to vary the moisture content of the oils, using the KF data of the original oils to calculate the moisture content of the wet-dry
blends. Similarly, dry acetonitrile was gravimetrically spiked with moisture to prepare calibration standards. To develop the acetonitrile moisture calibration, the dry acetonitrile was subtracted from each water-spiked acetonitrile standard producing an absolute moisture calibration as the base acetonitrile and any moisture it might contain is spectrally ratioed out, leaving only the added moisture to be measured. The oil standards were extracted with dry acetonitrile and the spectrum of the acetonitrile used to prepare the sample was subtracted, leaving only the spectrum of what was extracted. Two approaches to quantification were examined, the initial approach being to measure a peak height at a compromise
location (3616 cm-1) and subsequently, using a more
sophisticated chemometric approach based on partial least squares (PLS). Accuracy, repeatability and reproducibility of the FTIR method were assessed by analysing a variety of oil samples, including new, thermally aged and oils taken from in-service transformers relative to their moisture content determined by KF.
Results and Discussion
Spectral Analysis and Peak Height Calibration
Acetonitrile is considered a suitable extraction solvent for several reasons; (1) it is sufficiently polar to be substantially immiscible with mineral oil and able to extract water efficiently, (2) acetonitrile has no strong absorptions in spectral region where water absorbs and (3) extraction concentrates the moisture in a smaller volume and thus lower levels can be measured [14].
The representative spectra of extracts of new- and aged-oil acetonitrile extracts along with those of the acetonitrile-water standards are all shown in Figure 2. The differential spectra of water-added acetonitrile exhibit distinct symmetric and
asymmetric OH stretching bands at 3540 cm-1 and 3634 cm-1
as well as a weaker, broad HOH bending vibration at 1630 cm
-1 (not shown). In the new oil extracts, the same water bands are
much broadened and lower-frequency shifted progressively which if further aggravated in aged oils. This is due to the extraction of some other components in addition to water, like additives and oxidation products, upon which is further superimposed hydrogen bonding with the extracted water.
Figure 2. Representative differential spectra of acetonitrile-water and acetonitrile extracts from new and aged oils.
Within each one of these groupings the moisture bands respond linearly to moisture on its own, but quantification
between groups would clearly be affected by this spectral variability. Of the two water bands, the lower frequency band is more likely to be subject to interference from any co-extracted components, with the higher wave number band 3634 cm-1 less so, and thus a compromise band location
between the two extremes (3616 cm-1) was assessed as a means
of predicting the moisture content of the samples. Using the 3616 cm-1 measurement, a calibration was devised on the
combined new and aged oil standards ranging from 2-43 ppm (Figure 3). As can be seen, a workable linear relationship is obtained as having a coefficient of determination of 0.976 and an SD of ± 4 ppm.
Figure 3. Regression obtained between KF moisture content
determined in oils and peak height absorbance at 3616 cm-1 of
their acetonitrile extracts.
Using this calibration approach, validation analyses were performed a using 11 oil new, aged and in-use transformer oils analyzed by both KF and FTIR. The predictions obtained include some significant outliers attributed to acetonitrile absorbing moisture during sample handling; however, even with the major outliers removed, the performance of this simple peak height approach was deemed inadequate in terms of performance in terms of accuracy (± 5.3 ppm) to be used for proper quantification of moisture in transformer oils.
Chemometric Approach
An alternative approach to the simple, peak-height compromise band is to use PLS, a more sophisticated chemometric approach. Here the relationship between spectral changes and KF is assumed to depend on a number of factors in addition to simple concentration changes. This approach recognizes that in order to model moisture changes adequately, confounding factors such as other constituents being extracted and hydrogen bonding effects must be accounted for. PLS is based on the linear transition of a number of original descriptors to a new variable space based on smaller number of factors (latent variables), these being mutually independent linear combinations of the original descriptors. Latent variables are chosen in such a way as to provide maximum
0.10 0.11 0.12 0.13 0.14 0.15 0 10 20 30 40 50 K F H2 O ( p p m ) Absorbance @ 3616 cm-1 SD = 4.05 ppm R = 0.976
correlation with dependent variables, with the PLS model con-taining the smallest necessary number of factors. As one in-creases the number of factors, a PLS model accounts for non-related spectral changes and converges to isolate the measure of interest. However, using too many factors can lead to over-fitting and erroneous results, requiring that one carefully select an optimal number of factors that leads to low residuals. This is achieved by examining the quality of the fit to the data (per-centage of variance explained) and gauging the predictive re-sidual error sum of squares (PRESS) by cross-validation. PLS
regression models were developed using OmnicTM
Tur-boQuant, a sophisticated chemometrics package from Thermo Fisher Scientific Inc. For these analyses an additional spectral transform is included, in this case a 5-5 gap-segment 2nd
deriv-ative and relating the spectral changes covering the
wave-number range from 3300 cm-1 to 3750 cm-1. For this
assess-ment the 2nd derivative spectra of acetonitrile extracts of new,
aged and in-use transformer oils were analyzed by PLS using their KF determined moisture contents as the dependent varia-ble.
One can determine the appropriate number of factors by plotting the % variance explained by the response variable as a function of the number of factors to locate its minimum. Fig-ure 4 indicates that the PLS regression model can readily model the 11 standards using 3 factors, after which negligible improvement is attained.
Figure 4. Root mean square error coefficient of variation of the variance explained by the number of PLS factors used.
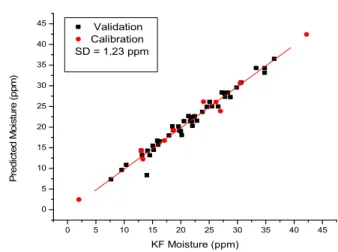
Figure 5 presents the calibration standards () based on KF
data as well as “validation” predictions () obtained when fur-ther spectral mixtures of the calibration spectra were incorpo-rated as validation samples and predicted using the calibration. These validations were generated by adding each calibration spectrum to each of the others and dividing the KF result by 2 to generate mixed spectral samples of intermediate moisture content. The calibration developed based on KF data required 3 factors, producing a calibration SD of ~1.23 ppm, with a cross validation SD of 2.05 ppm. The cross-validation value is indicative of the performance that one might expect from the analysis of additional samples.
Figure 5. KF-PLS calibration () data points and the KF”
val-idation” () data points predicted for spectral mixtures of oil samples.
The validation samples indicate that the model is capable of accounting for the variation one would expect to see in real mixtures made of the same standards, albeit the variability would likely be somewhat greater. Based on this data, a method precision of < 2.5 ppm is likely attainable.
Table 1. Repeatability and reproducibility data for quantifica-tion of water.
Sample Type of oil Repeatability Reproducibility Mean (ppm) SD (ppm) Mean (ppm) SD (ppm) 1 New oil 16.0 2.0 26.4 15.6 2 New oil 27.8 1.0 20.6 8.8 3 Aged oil 21.1 1.0 35.5 21.7 4 Aged oil 17.0 1.5 29.7 20.3 5 transformer oil 24.9 1.0 33.1 12.9
To obtain a better sense of what is possible in terms repeata-bility and reproducirepeata-bility, 5 oil samples were analyzed in trip-licate within the same run and on separate days with the results summarized in Table 1. The average SD for the repeatability was ± 1.3 ppm, in line with the calibration, indicating good measurement stability upon immediate analysis; however, the between-day SD reproducibility was ~ ± 16 ppm, clearly indi-cating the susceptibility of acetonitrile to moisture absorption over time.
Conclusion
The results obtained in this preliminary study indicate that FTIR analysis of acetonitrile extracts of transformer oils as a means of determining moisture may be viable. Because of the extraction of other constituents and the effects of hydrogen bonding, simple peak height measurements are not adequately accurate due to the need to use a compromise wavelength. The
0 2 4 6 8 10 0 2 4 6 8 10 12 R M S E C V PLS Factors Used 0 5 10 15 20 25 30 35 40 45 0 5 10 15 20 25 30 35 40 45 P re d ic te d M o is tu re ( p pm ) KF Moisture (ppm) Validation Calibration SD = 1.23 ppm
use of PLS on the other hand does allow the confounding var-iables affecting moisture measurement to be modeled and fa-cilitates accurate quantification. This preliminary work will re-quire more extensive validation; in particular better sample handling techniques to control moisture absorption by acetoni-trile (e.g., use of septum capped vials, automated loading the cell, control of RH). With such protocols in place, side-by-side FTIR and KF analyses in collaboration with a transformer oil analysis laboratory would provide a more comprehensive as-sessment of how well this approach will ultimately work. The key benefit from this approach would be that an FTIR equipped with an auto-sampler could provide a means of automating moisture analysis in a manner analogous to what has been done in the lubricant sector [14].
REFERENCES
[1] V. G. Arakelian and I. Fofana, "Water in Oil-Filled, High-Voltage Equipment, Part I: States, Solubility, and Equilibrium in Insulating Materials," IEEE Electr. Insul. Mag., vol. 23, no. 4, pp. 15-27, 2007. [2] V. G. Arakelian and I. Fofana, "Water in Oil-Filled High-Voltage
Equipment Part II: Water Content as Physicochemical Tools for Insulation Condition Diagnostic," IEEE Electr. Insul. Mag., vol. 23, no. 5, pp. 15-24, 2007.
[3] F. R. Van De Voort, et al., "FTIR Condition Monitoring of In-Service Lubricants: Ongoing Developments and Future Perspectives," Tribology Transactions, vol. 49, no. 3, pp. 410-418, 2006/09/01. [4] "Standard Practice for Condition Monitoring of Used Lubricants by
Trend Analysis Using Fourier Transform Infrared (FT-IR) Spectrometry," ASTM designation E2412, Book of Standards Volume: 05.04, 2010.
[5] Frederik R. van de Voort, et al., "An automated FTIR method for the routine quantitative determination of moisture in lubricants: An alternative to Karl Fischer titration," Talanta, vol. 72, no. 1, pp. 289-295, 2007.
[6] "IEEE Guide for Acceptance and Maintenance of Insulating Oil in Equipment," IEEE Std C57.106-2002, Institute of Electrical and Electronics Engineers, Inc., 2002.
[7] A. Al-Alawi, F. R. Van De Voort, and J. Sedman, "A new Fourier transform infrared method for the determination of moisture in edible oils," Applied Spectroscopy, vol. 59, no. 10, pp. 1295-1299, 2005. [8] F. R. van de Voort, et al., "Quantitative Determination of Moisture in
Lubricants by Fourier Transform Infrared Spectroscopy," Applied Spectroscopy, vol. 58, no. 2, pp. 193-198, 2004/02/01.
[9] D. Wooton and S. Barry, "Using Infrared Spectroscopy in Used Engine Oils - Estimating Base Number," in Practicing Oil Analysis, ed, November 2005.
[10] I. Fofana, A. Bouaïcha, and M. Farzaneh, "Characterization of aging transformer oil–pressboard insulation using some modern diagnostic techniques," European Transactions on Electrical Power, vol. 21, no. 1, pp. 1110-1127, 2011.
[11] J. P. Percherancier and P. J. Vuarchex, "Fourier transform infrared (FT-IR) spectrometry to detect additives and contaminants in insulating oils," IEEE Electr. Insul. Mag., vol. 14, no. 3, pp. 23-29, 1998. [12] P. J. Baird, H. Herman, and G. C. Stevens, "On-site analysis of
transformer paper insulation using portable spectroscopy for chemometric prediction of aged condition," Trans. Dielectr. Electr. Insul., vol. 15, no. 4, pp. 1089-1099, 2008.
[13] P. J. Baird, et al., "Non-destructive measurement of the degradation of transformer insulating paper," Trans. Dielectr. Electr. Insul., vol. 13, no. 2, pp. 309-318, 2006.
[14] F. R. van de Voort., et al. Measuring Moisture in Lubricants with FTIR: An Alternative to Karl Fischer Titration [Online]. Available: http://www.thermal-lube.com/wpcontent/uploads/2014/02/Measuring-Moisture-in-Lubricants-with-FTIR-An-Alternative-to.pdf. Date Accessed:2014-12-10
Yazid Hadjadj was born in Laghouat, Algeria, in 1983. He received the Diplôme d’Ingénieur en Électronique from the Univer-sity of Laghouat (Algeria) in 2006. He joined the Can-ada Research Chair ISOLIME at the Université du Québec à Chicoutimi (UQAC), where he completed his Master degree in 2010. He is currently researching for his PhD degree. His main research interests include high voltage phenomena, electrical insulation, and control engineering. He has authored/co-authored more than 5 technical papers.
Issouf Fofana (M´05-SM’09) received an electro-me-chanical engineering degree in 1991 from the Univer-sity of Abidjan (Côte d’Ivoire), and both a master’s and PhD degree from the École Centrale de Lyon, France in 1993 and 1996, respectively. He was a post-doctoral researcher in Lyon in 1997 and at the Scher-ing Institute of High Voltage EngineerScher-ing Techniques, University of Hanover, Germany from 1998 to 2000. He was a Fellow of the Alexander von Humboldt Stiftung from November 1997 to August 1999. He joined the Université du Québec à Chicoutimi (UQAC), Quebec, Canada as an Associate Researcher in 2000, and he is now Professor there. Dr. Fofana has held the Canada Research Chair, tier 2, of insulating liquids and mixed dielectrics for electrotechnology (ISOLIME), since 2005. He is registered as a professional engineer in the prov-ince of Quebec, and is currently a member of the Executive and Technical Committees of the IEEE CEIDP and member of the International Advisory Committee of the IEEE ICDL. He is a member of the ASTM D27 Task Group to develop a test method for partial discharge inception voltage. He has au-thored/co-authored over 200 scientific publications and holds 3 patents.
Frederik R. van de Voort focuses on the devel-opment of analytical techniques based on the use of FTIR spectroscopy; in particular the rapid anal-ysis of edible oils and lubricants. He is Emeritus professor and member of the McGill IR Group having published more than 180 papers. He is cur-rently a visiting professor at the university of Al-berta and specializes in the development of rapid mid-FTIR analytical methods for industrial appli-cations, integrating advanced chemometrics, hardware and software to package analytical solu-tions for lubricant and transformer condition monitoring applicasolu-tions. Edible oil methods developed include iodine value (IV), cis/trans analysis, peroxide value (PV) and free fatty acids (FFA) for edible oils, while for lubricants, au-tomated methods for acid number (AN), base number (BN) and moisture have been developed, these all capable of throughputs of more than 100 sam-ples/hour.
Denis Bussières, received his PhD in Chemistry from the University Western Ontario (UWO 1985), and his DESS from École Nationale d’Ad-ministration Publique (ÉNAP 2003).
After a strong formation in Chemistry in the field of paper properties and spectroscopy, he worked for two and a half years at the Arvida Re-search and Development Center for ALCAN on a variety of analytical projects. Since 1988, he took a position as a Chemistry professor at Université du Québec à Chicoutimi (UQAC) where he is ac-tive on different environmental projects with aquatic, terrestrial and atmos-pheric aspects; meanwhile, he is involved into projects in regard of the peda-gogical aspects of teaching science. He is now working to reconcile laboratory infrared measurements of different gases with measurements made in the field with an open-path infrared spectrometer.