Development and validation of a Liquid Chromatography Isotope Dilution Mass Spectrometry method for the reliable quantification of alkyphenols in
environmental water samples by Isotope Pattern Deconvolution
Neus Fabregat-Cabelloa, Juan V. Sanchoa, Andreu Vidalb, Florenci V. Gonzálezb,
Antoni Francesc Roig-Navarro*,a.
aResearch Institute for Pesticides and Water, Universitat Jaume I, E-12071,
Castellón, Spain.
bDepartament de Química Inorgànica i Orgànica, Universitat Jaume I, E-12071,
Castellón, Spain
*Corresponding Author: Tel: + 34 964 387 359 ; fax: + 34 964 387 368. E-mail address: roig@uji.es (A.F. Roig-Navarro)
2 Abstract
We present here a new measurement method for the rapid extraction and accurate quantification of technical nonylphenol (NP) and 4-t-octylphenol (OP) in complex matrix water samples by UHPLC-ESI-MS/MS. The extraction of both compounds is achieved in 30 min by means of hollow fiber liquid phase microextraction (HF-LPME) using 1-octanol as acceptor phase, which provides an enrichment (preconcentration) factor of 800. On the other hand we have developed a quantification method based on Isotope Dilution Mass Spectrometry (IDMS) and singly 13C1-labeled compounds.
To this end the minimal labeled 13C1-4-(3,6-dimethyl-3-heptyl)-phenol and 13C1
-t-octylphenol isomers were synthesized, which coelute with the natural compounds and allows the compensation of the matrix effect. The quantification was carried out by using isotope pattern deconvolution (IPD), which permits to obtain the
concentration of both compounds without the need to build any calibration graph, reducing the total analysis time. The combination of both extraction and
determination techniques have allowed to validate for the first time a HF-LPME methodology at the required levels by legislation achieving limits of quantification of 0.1 ng mL-1 and recoveries within 97-109%. Due to the low cost of HF-LPME and
total time consumption, this methodology is ready for implementation in routine analytical laboratories.
Keywords: Alkylphenol, Hollow fiber liquid phase microextraction, Isotope dilution mass spectrometry, Isotope pattern deconvolution, LC-MS/MS, Wastewater analysis
3 1. Introduction
Alkylphenols (AP) are chemical compounds that are mainly used to produce alkylphenol ethoxylates (APEs), a class of synthetic surfactants widely used in detergents and cleaning products. Among the AP ethoxylates, the nonylphenol ethoxylates represent a 80 % while the remaining 20% are almost entirely
octylphenol isomers [1]. After degradation, APEs are released as AP, mainly in the water environment. The main problem associated to AP is their ability to mimic the structure of natural hormones, specifically 17-β-estradiol, which confers on them endocrine disrupting capabilities. The widespread use of AP polyethoxylates coupled with the harmful effects of alkylphenols had led to include them in the list of the priority substances of the Water Framework Directive (WFD) [2] which contain t-octylphenol (OP) and branched nonylphenol (NP), a complex mixture of nonylphenol isomers which is known as “technical grade nonylphenol”. Due to the method
sensitivity required in international regulations(i.e. 0.1 µg L-1 for OP and 0.3 µg L-1 for
NP according to EU Environmental Quality Standards, EQS), together with its ubiquitous presence as contaminant, the identification and quantification of AP still presents considerable challenges.
Contrary to the determination of OP, the determination of NP involves a particular analytical challenge because NP comprises a complex mixture of isomers. Since the legislation establishes the EQS for the sum of all forms of branched 4-nonylphenol (CAS 84852-15-3), most laboratories employed commercial technical nonylphenol mixtures as analytical reference standard to quantify NP. In GC-MS their
identification is based on the peak pattern (fingerprint) and NP is quantified from the sum of all peaks belonging to the chromatographic pattern [3]. This can be a tedious and non-reproducible work since the analyst should use caution to include only those
4 peaks from the analyte. On the other hand, in LC-MS/MS the overall NP isomers elute as a single chromatographic peak associated to transition 219 > 133. This transition suggests that the α-carbon of the nonylphenols is mainly a tertiary carbon [4]. Nevertheless, we always have to take into account that a complete separation is the only real way to asses both different disrupting capabilities and sensitivity in the MS detector for the different nonylphenol isomers. However, NP isomers can only be completely separated by GCXGC [4] which is not a feasible option in most routine laboratories. Moreover, neither all the chromatographic peaks are identified nor commercial standards exist for all possible isomers. Taking these reasons into account, a recent work of Rabouan et al. [5] proposes the isomer 353-NP ((3,5-dimethylheptan-3-yl)phenol) as a reference material representative of both, instrumental sensitivity and toxicity of NP.
In order to achieve the low quantification levels established by the EQS a
preconcentration step before the determination of alkylphenols in water samples is mandatory. The most employed methodologies in AP determination include liquid-liquid extraction (LLE) or solid phase extraction (SPE) [6].These methodologies are usually time-consuming and require the use of large solvent volumes. Nowadays there is an increasing demand of faster, cheaper and environmentally friendly isolation techniques [7]. These requirements can be fully accomplished by hollow fiber liquid phase microextraction (HF-LPME), a relatively new and unexploited extraction technique [8]. As a consequence, there are just a few HF-LPME methods ready to be implemented in routine laboratories. Briefly, a liquid membrane of organic solvent is supported in the pores of a hollow fiber which is in contact with an aqueous donor phase (the sample) and an acceptor phase. If the acceptor phase is the same organic solvent as the immobilized in the fiber, it is known as a two-phase system.
5 On the other hand, if the acceptor phase is an aqueous solvent, the extraction is performed in a three-phase system. Liu et al. [9] have developed an extraction procedure for sampling OP and NP using 1-octanol supported on a microporous hollow fiber. Nevertheless, this procedure was not able to quantify both compounds at the required legislation levels since only a thin film of octanol, attached to the outer fiber surface, is employed to extract the compounds. Besides analytes need to be desorbed from the thin layer for analysis by HPLC, which increased the total analysis time. A recent work [10] proposed a three phase HF-LPME procedure for the
extraction of the linear isomers n-OP and n-NP and later HPLC determination, which assures the compatibility between sample extract and chromatographic mobile phase and column, but provided lower enrichment factors than two phase configurations. However, incompatibility with LC solvents can be avoided by simple dilution with methanol [11].
The analysis of OP and NP by LC techniques is preferred over GC because there is no need to perform any derivatization step, which increases the total analysis time and may show low yields in complex matrices [12]. On the contrary, extracts obtained after a two phase configuration in HF-LPME are directly compatible with GC
analyzers. This advantage has been applied in the analysis of NP and n-OP by GC-MS [13,14].
A relevant problem with the use of Electrospray ionization source (ESI) is the matrix effect [15–18]. Signal suppression or enhancement can affect drastically to
sensitivity, precision and accuracy of the analytical results. Regarding alkylphenols, for example, Chen et al. [19] found around 50% signal reduction in river water for Nonylphenol and other endocrine disruptor compounds, and Vega-Morales et al. [20] observed signal suppression for alkylphenols ranging from 9 to 24% in different
6 wastewater treatment plant samples. Different approaches have been assayed to minimize matrix effect, being the use of Stable Isotope Labeled Internal Standard (SIL-IS) the most robust approach [16–18]. Thus, matrix-effects associated to complex matrices can be properly overcome using a quantification methodology based on Isotope Dilution Mass Spectrometry (IDMS). Classical IDMS, based on the use of methodological calibration curves requires the use of multiple labeled
compounds to avoid overlapping in mass spectra. However, these multiple labeled compounds can induce isotopic effects, notably when deuterium isotopes are used. According to González-Antuña et al. [21,22] isotopic effects are not observed by the use of singly labeled analogues with 13C. To avoid the overlapping problem in the
mass spectra, Isotope Pattern Deconvolution (IPD) quantification tool can be used. IPD do not requires the construction of any calibration graph and has been tested satisfactorily for rapid quantifications in complex matrices [23–25]. Briefly, IPD
permits to isolate distinct isotope signatures from mixtures of natural abundance and enriched tracer and the corresponding molar fraction for each compound. From the ratio of the molar fractions between natural and labeled compounds the
concentration of the analyte in the sample can be directly obtained [21].
The aim of this study is the development and validation of a HF-LPME-UHPLC-MS/MS method for the determination of alkylphenols in complex water samples in a single run. OP and NP, the two most ubiquitous EU-regulated alkylphenols, are selected. Sample treatment has been minimized to avoid contamination and a HF-LPME in a two phase configuration has been developed using octanol as extraction phase. Quantification of OP and NP is based on the combination of minimal labeling and IPD. To this end, a minimal labeled 13C1-4-(3,6-dimethyl-3-heptyl)-phenol and 13C1-t-octylphenol isomers were synthesized.
7 2. Materials and Methods
2.1. Reagents and materials
4-tert-octylphenol (purity grade 99.0%) was obtained from Supelco (Bellefonte, PA, USA). In-house synthesized [25] 13C1 -4-(3,6-dimethyl-3-heptyl)phenol (13C1 –NP)
(purity 99% and 13C1-enrichement 98%) was also employed. In order to obtain the
apparent concentration relative to technical nonylphenol of in-house synthesized 13C1
-NP by reverse IDMS, we acquired two technical nonylphenol mixtures: technical nonylphenol (Pestanal, purity grade 95.4%) from Riedel de Haen (Seelze,Germany) and technical nonylphenol (purity grade 100.0%) by Dr. Ehrenstorfer (Augsburg, Germany). Methanol (analysis grade), ammonium acetate (reagent grade) and hydrochloric acid (37%, reagent grade) were provided by Scharlau (Barcelona, Spain). For the extraction, 1-octanol (reagent grade, 99%) was obtained from Sigma-Aldrich Co. (Madrid, Spain). The pH of the mobile phase was adjusted approximately to 7 by adding ammonium hydroxide from Fluka (Buchs, Switzerland). HPLC-grade water was obtained by purifying demineralized water in a Milli-Q gradient A10 (Millipore, Bedford, MA, USA). Drinking bottled water stored in polyethylene terephthalate (PET) bottles was also employed to test the effect of mobile phase composition in analyte sensitivity. Individual stock solutions of alkylphenols were prepared by dissolving 50 mg, accurately weighted, in 50 mL of methanol. An intermediate mixed solution of OP, NP,
13C1-NP and 13C1-4-tert-octylphenol(13C1-OP) at a concentration of 0.5 mg L-1 was
prepared after mixing individual stock solution and dilution with methanol. An equivalent mixed solution with only the singly 13C1-labeled compounds was also
prepared. Working solutions were subsequently prepared from the mixed solution by dilution the appropriate volume with methanol. All standard solutions (stock,
8 intermediate and working solutions) were stored in amber glass bottles at -20ºC in a freezer.
Accurel® Q3/2 polypropylene hollow fibers (600 μm i.d., 200 μm wall thickness and 0.2 μm pore size) were purchased from Membrana (Wuppertal, Germany).
For the synthesis of 4-tert-octylphenol, boron trifluoride (BF3) diethyl etherate,
hexane, 2,4,4-trimethylpent-1-ene (also known as diisobutene) and phenol were purchased from Alfa Aesar (Karlsruhe, Germany). The 13C1-4-tert-octylphenol, (13C1 –
OP) was synthesized using 13C1 -phenol from Cambridge Isotope Laboratories
(Andover, MA, USA).
2.2. Synthesis of 13C1-4-tert-octylphenol
The synthesis of 13C1-OP was based on an alkylation of 13C1-labelled phenol with
diisobutene employing BF3-ether complex as catalyst [26].The procedure is illustrated
in Figure 1. As can be observed, the selected labeling position corresponds to the carbon linked to the hydroxyl group, which remains in the main fragment ions measured by tandem mass spectrometry.
Experimental procedure for the preparation of 13C1-OP:to a stirred solution of 13C1
-labelled phenol (116.7 mg, 1.20 mmol) and diisobutene (154.0 mg, 1.36 mmol)in hexane (50 mL) was added boron trifluoride etherate (175 L, 1.39 mmol). The resulting mixture was stirred overnight, then ice-water (50 mL) was added and extracted with hexane (2 x 25 mL). The organic layer was washed (brine), dried (sodium sulfate), filtered and concentrated under vacuum to afford a white solid which was purified through liquid chromatography (silica-gel, hexanes: ethyl acetate (7:3)) to afford 182.5 mg (yield = 73%) and characterized by 1H NMR and 13C NMR.
9 Spectroscopic data of 13C1-OP, 1H NMR (CDCl3, 300 MHz) δ 7.27(1H, d, J = 8.9 Hz),
7.24 (1H, d, J = 8.9 Hz),6.82 (1H, d, J = 8.9 Hz), 6.81 (1H, d, J = 8.9 Hz), 6.10 (1H, br s),1.74 (2H, s), 1.38 (6H, s), 0.77 (9H, s); 13C NMR (CDCl3, 75 MHz) δ 153.0,
142.3 (d, J = 8.3 Hz), 127.3,114.7 (d, J = 66.2 Hz), 57.1,38.0, 32.3,31.8, 31.7 ppm.
Purity of the sought compound was evaluated by GC-EI-MS (see Figure 2). Since only one peak was obtained, the content of 13C1-OP was established as higher than
99 %. The mass spectra of the 13C1-OP and the natural analogue are also included in
Figure 2. As can be observed, the main fragment ions corresponding to the labelled compound are shifted by one mass unit.
2.3. Instrumentation
Identification and quantification of analytes were carried out using an Acquity UPLC system (Waters Corp., Milford, MA, USA), equipped with a binary solvent manager and sample manager. An Acquity UPLC HSS T3 column 1.8 µm, 2.1 mm x 100 mm (i.d.) (Waters) was used. The column oven was set at 40 ºC, the flow rate was 300 µL min-1 and the injection volume was 20 µL. The separation was performed under
isocratic conditions with a mobile phase consisted of 95% methanol/water with 0.01% ammonia and 0.1 mM ammonium acetate.
A TQD tandem mass spectrometer with an orthogonal Z-spray-electrospray interface (Waters) was used.The mass spectrometer was operated in negative mode
electrospray ionization in selected reaction monitoring (SRM) mode. Drying as well as nebulising gas was nitrogen, obtained from a nitrogen generator N2 LC-MS
adapted for LC-MS analyzers (Claind, Teknokroma, Barcelona, Spain). The
operating parameters of the spectrometer were capillary voltage 3.30 kV, and source and desolvation temperatures 120 and 350 ºC, respectively. The cone gas and
10 desolvation flow were set at 40 and 400 L/h.For operation in MS/MS mode, collision gas was Argon 99.995% (Praxair, Madrid, Spain) with a pressure of approximately 4·10-3 mbar in the collision cell. Dwell times of 0.1 s/scan were chosen. A sampling
cone voltage of 35 V and a collision cell energy of 35 eV were set for the
experiments. Masslynx v4.1 (Waters) software was used to process the quantitative data obtained.
Gas chromatography analyses were performed using an Agilent 6890 Series GC equipped with a split–splitless injection port, and mass spectrometric detector
(Agilent 5973 N MSD) with an electron ionization (EI) source and MPS2 autosampler from Gerstel (Linthicum, MD, USA). The GC was fitted with a 30 m x 0.25-mm (i.d.), 0.25-µm DB-5MS column (Hewlett–Packard). The column temperature was initially held at 60 ºC for 1 min, and then a temperature ramp of 10 ºC min-1 was applied until
300 ºC and this temperature was maintained for 1 min. Helium was used as carrier gas at a flow rate of 1mL min-1. Temperature of the injector was set to 280 ºC and a
sample volume of 2 µL was injected in splitless mode.
2.4. Preparation of water samples
All effluent (EWW) and influent (IWW) wastewater samples with observable suspended particulate matter were decanted by pouring the water after
sedimentation slowly from the sample bottles into clean 1 L glass (Schott-Duran) bottles[27]. IWW samples were diluted five times in Milli-Q water due to their high complexity and organic matter content. Then, 1mL of 13C1-NP and 13C1-OP mixture
solution was added to a 100-mL volumetric flask, where the water sample (20 mL of sample and Milli-Q water in the case of IWW) was used to fill it and to adjust the final volume, giving a final concentration of 0.1 µg L-1 for each isotope-labeled internal
11 standard. Accurate and precise results will be obtained when the ratio of
concentrations between the natural and labeled compound is in the range of 0.1 to 10, according to the random error propagation theory [28].
2.5. Proposed Hollow fiber extraction procedure
A cleaned 13 cm long fiber was soaked with 1-octanol for 5 seconds in order to impregnate the pores of the hollow fibers. Then the excess of 1-octanol on the outside was eliminated by washing the fiber 25 seconds in stirred Milli-Q water. The lumen of the hollow fiber was filled with 30μL of the acceptor phase, 1-octanol, using a 100-μL HPLC microsyringe model 701N (outer diameter 0.72 mm) from Hamilton (Bonaduz, Switzerland). Both open ends of the fiber were closed by means of heat sealing. These ends of the prepared hollow fiber were hold by a stainless steel alligator clip holder attached to a wire and introduced into a 100 mL water sample contained in a volumetric flask. The sample was stirred for 30 min by means of a magnetic stirrer at 800 rpm. After extraction, octanol extracts were diluted with methanol and injected directly into the LC/MS system, avoiding pre-concentration or desorption steps. To do so, the fiber was taken out, both ends were cut and 270 μL of methanol were flushed through the lumen using a 1-mL HPLC gastight syringe model 1001 (outer diameter 0.72 mm) from Hamilton (Reno, Nevada, USA) and directly introduced into a LC vial. Before injection in the HPLC system, samples were homogenized by agitation in a vortex during 5 seconds.
2.6. Cleaning procedure
As Salgueiro-González et al. highlight in their work [29], it is still complicated to have under control the blank levels in alkylphenols determinations. Nevertheless, it was
12 established that rinsing with acetone and methanol was the fastest and simplest protocol to give low blanks. For this reason glassware was washed with tap water and then rinsed with acetone and methanol.
On the other hand magnetic stirrers were rinsed with acetone and sonicated 15 min in methanol before use. HPLC syringes were rinsed twice with acetone and twice with methanol between samples. Hollow fibers were cut into 13 cm pieces and sonicated in methanol 15 min to remove any contaminants and dried. Due to their low cost, fibers were discarded after being used to decrease memory effect and cross-contamination.
Finally it is essential to test if our LC vials septa contaminate samples with NP because we have observed that most PTFE/Silicone septa in LC vials filled with methanol release NP after a few hours. This fact was observed even when samples were stored in the fridge..
After applying all the cleaning procedure, reagent blanks obtained were within the range of 0.01-0.03 ng mL-1. These results agreed with our previous works [25].
2.7. Determination of OP and NP by Isotope Pattern Deconvolution
The quantification of NP and OP was carried out by Isotope pattern deconvolution (IPD). Briefly, this is a mathematical tool employed in IDMS to obtain directly the concentration of each compound by multiple linear regression. This approach
assumes that the final isotopic composition observed in the mixture is a combination of the analyte and the isotopically enriched spike [21,30,31]. It should be noted that isotope distributions are relative magnitudes whose measurement are independent of matrix effect.
13 The simultaneously determination of NP and OP was carried out by the construction of two system of equations, (1) and (2) respectively, which were solved by multiple linear regression in order to obtain the molar fractions (Xnat and Xlab) of each natural
abundance and labeled alkylphenol. The quantification of NP was carried out employing three transitions: 219> 133, 220 > 134 and 221> 135. In the case of OP, transitions selected were: 205> 133, 206 > 134 and 207> 135. Only three transitions of each compound were selected, according to the random error propagation theory, to make possible the application of this alternative technique in routine multi-residue analysis. 135 221 134 220 133 219 135 221 134 220 133 219 135 221 134 220 133 219 135 221 134 220 133 219 e e e X X A A A A A A A A A lab nat lab lab lab nat nat nat mix mix mix (1) 135 207 134 206 133 205 135 207 134 206 133 205 135 207 134 206 133 205 135 207 134 206 133 205 e e e X X A A A A A A A A A lab nat lab lab lab nat nat nat mix mix mix (2)
In this system of equations i j mix
A values corresponds to the measured relative
abundance of the compound in the mixture for the SRM transition of nominal masses i > j, i j
nat
A and i j lab
A values the theoretically calculated or experimentally measured
abundances for the natural and labeled alkylphenol and ei>j is the error vector of the
multiple linear regression. As Castillo et al. depict in their work [24], in tandem mass spectrometry (QqQ) in Selected Reaction Monitoring (SRM) it is also necessary to compute the contribution of the different isotopes (mainly 13C, 17O, 2H) to the
calculation of the product ions mass isotopomer distribution of natural abundance and isotope-labeled compound. The resulting mass isotopomer distribution coming from each isotope pattern can be obtained using the software Isopatrn implemented by L. Ramaley et al. [32]. The amount (mols) of each natural abundance alkyphenol
14 in the sample, Nnat, is then calculated using equation (3) where the amount (mols) of
labeled compound added, Nlab, must be known.
lab nat lab nat N XX N (3) Accordingly, quantification of alkylphenols becomes a fast process: one injection provides one result, free of matrix effect, without the need to prepare a calibration curve.
The confirmation of the presence of NP was carried out by calculating the peak area ratios between the quantification transition (Q) 219 > 133 and the confirmation transition (q) 219 > 147, and comparing them with ion-ratios from a reference standard. The same criteria could not be applied to the confirmation of OP since no other sensitive transition was observed.
3. Results and discussion
3.1. Study of the Injection solvent effects on separation and ionization Theoretically octanol is a very convenient acceptor solution for OP and NP in a 2-phase HF-LPME system due to their high partition coefficient values (log Kow for the
phenols were 4.12 and 4.48 for OP and NP, respectively) [9,33]. Nevertheless, if the acceptor is an organic solvent the extracts are directly compatible with GC but not always with LC or CE. As a consequence the main constrain step in two-phase HF-LPME prior to LC analysis is to make organic sample extracts compatible with mobile phase. The fastest way to make octanol extracts compatible with our selected
chromatographic conditions was its dilution in methanol [11].
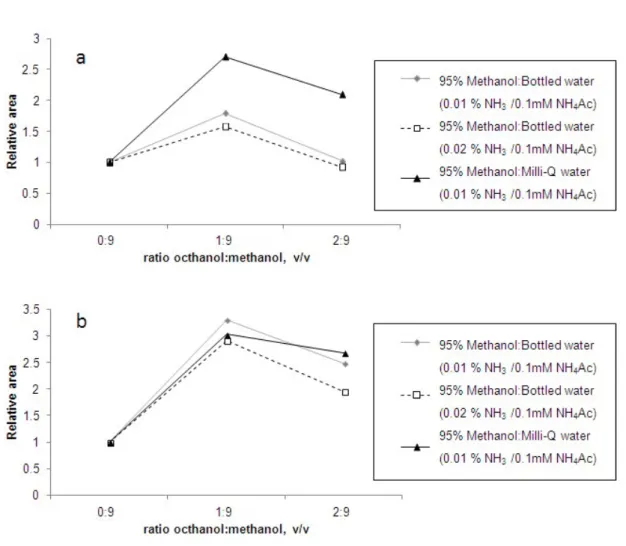
To test the effect of the presence of octanol in sample extracts in terms of
compatibility, peak shape and sensitivity we injected different solutions containing 0.1µg mL-1 of both alkylphenols that were prepared using different ratios
15 octanol:methanol, namely 0:9, 1:9 and 2:9 (v/v). Both Milli-Q and bottled water
modified with different percentages of ammonia were studied maintaining a constant concentration of 0.1mM of NH4Ac in the mobile phase. Under the isocratic conditions
of 95% methanol assayed no problems of peak shape with mobile phase were found for the octanol:methanol ratios used. Regarding sensitivity, as can be observed in Figure 3, octanol extracts diluted with methanol 1:9 (v/v) assures the maximum sensitivity. In these conditions, the signal (normalized areas) increased three times compared to extracts in pure methanol.
To the best of our knowledge, the signal enhancement of NP and OP in methanol extracts when modified with octanol and detected by ESI has never been described before. This effect, not well understood, is probably due to modification of surface tension of aerosol generated which can enhance the ion concentration in the gas phase. Taking into account the low signal sensitivity of alkylphenols, especially for OP determinations, the presence of octanol in the final extract can permit to achieve the low levels required in legislation. Thus, 1:9 dilution with methanol are the
conditions used to avoid compatibility problems of 1-octanol.
3.2. Characterization of 13C1-OP and 13C1-NP by LC-MS/MS
3.2.1. Calculation of the cluster purity and the extent of the 13C1 enrichment
As stated above, equations 1 and 2 require the accurate knowledge of the relative abundances of the natural and the labeled compounds. Theoretical calculation of those abundances after a fragmentation process in the QqQ mass spectrometer must take into account the spectral purity. Moreover, for the labeled compound, the enrichment of 13C1 atom should be known.
16 Both the procedure to characterize the spectral purity and the extent of 13C1 labeling
in synthesized alkylphenols has been described in a previous work [25]. NP showed a contribution of 96.0 ± 0.3 for [M-H-C6H14]- and 4.0 ± 0.3 % for [M-H-C6H15]- when
prepared in methanol extracts [25]. OP characterization was performed monitoring the fragment clusters [M-H-C5H12]-, [M-H-C5H13]- and [M-H-C5H11]-. Our results
showed a contribution of 98.10 ± 0.13 for [M-H-C5H12]- and 1.9 ± 0.13 % for
[M-H-C5H13]- clusters but no contribution for the [M-H-C5H11]- cluster. Both compounds
were also characterized in octanol:methanol (1:9, v/v) extracts but we did no observe differences compared to the pure methanol extracts. Consequently, the theoretical isotopomer distribution of the each natural abundance alkylphenol was recalculated to include the contribution of the cluster with an extra loss of hydrogen during the fragmentation step in the QqQ mass spectrometer.
Extent of 13C1 labeling in synthesized 13C1-OP was obtained by comparing the
observed cluster with those calculated for theoretical enrichments of the labeled compound from 97.6 to 99.9% 13C1. Since a clear minimum was obtained for around
99 atom % 13C1, the theoretical isotopomer distribution of the labeled compound was
calculated assuming a 13C1 enrichment of 99%. For the labeled NP a 98% of
enrichment in 13C1 was assumed [25]. Once obtained the whole isotope distribution
of 13C1-NP and 13C1-OP, the IPD approach can be applied.
3.2.2. Quantification of the labeled compounds by Reverse Isotope Dilution The proposed approach of IPD requires the determinations of the exact
concentration of the labeled compound. For this purpose, each isotopically enriched compound was mixed with known amount of its corresponding natural analogue, prepared in triplicate, and determined by reverse isotope dilution (RID) mass
17 spectrometry by LC-MS/MS. The concentration of 13C1-OP was obtained against a
certified OP standard from Supelco and resulted in a concentration of 950 ± 40 µg mL-1 of the stock solution. This agrees with the expected concentration taken into
account a 99% purity. For the quantification of NP the specific problem related with the unknown composition of the technical mixture should be considered. Since
legislation establishes the maximum concentration values for the technical mixture of nonylphenol, an apparent concentration of the selected singly labeled isomer 13C1
-NP was obtained using two different commercially available technical nonylphenol mixtures. Purity of each NP mixture was certified by the manufacturer. RID
calculations of 13C1-NP provides an equivalent concentration of technical nonylphenol
of around 2270 µg mL-1 using any of the technical nonylphenols mixtures tested
(Table 1). The theoretical concentration of 13C1-NP was 1385 µg mL-1 which agrees
with the results obtained by RID against the natural analogue synthesized in the laboratory (Table1). RID with commercial NP provides an apparent concentration of the 13C1-NP spike solution 1.6 times higher than the real concentration. This can be
due to higher ionization efficiency of the synthesized nonylphenol isomer compared to the overall nonylphenol mixture. As a consequence, the concentration of 13C1-NP
spike solution was established as 2270 µg mL-1 for quantification purposes.
3.3. Optimization of the HF-LPME experimental parameters
Several parameters are known to affect the HF-LPME efficiency including the selection of organic acceptor solvent, the optimization of the donor phase pH, the extraction time and the effect of salting out [34]. The effect of some of them are assessed through the Enrichment Factor (Ef) which represents the quotient between
18 the final concentration of the analyte in the extraction solvent Ce and the initial
concentration of the analyte within the aqueous sample, Cs:
Ef= Ce/Cs (4)
As described in previous sections in this paper 1-octanol shows high partition coefficient for alkylphenols and total compatibility with the LC mobile phase without further treatment once diluted in methanol. Moreover it has been tested as adequate organic acceptor in previously reported works [9]. Thus, octanol has been chosen as acceptor phase.
The final concentration Ce was determined by an external calibration curve prepared
in octanol:methanol (1:9, v/v). To this end, increasing concentrations (5-1000 ng mL -1) of NP and OP were injected in duplicate through the UHPLC- MS/MS. The
calibration graph was built using transitions 219 >133 for NP and 205>133 for OP. We spiked samples at a level of 5 ng mL-1 and extracted them depending on the
parameter to be optimized. All the determinations were averaged from three replicate measurements. In order to promote the extraction from the donor phase all samples were stirred at 800 rpm, the maximum speed that did not produce a vortex when samples were into a volumetric flask.
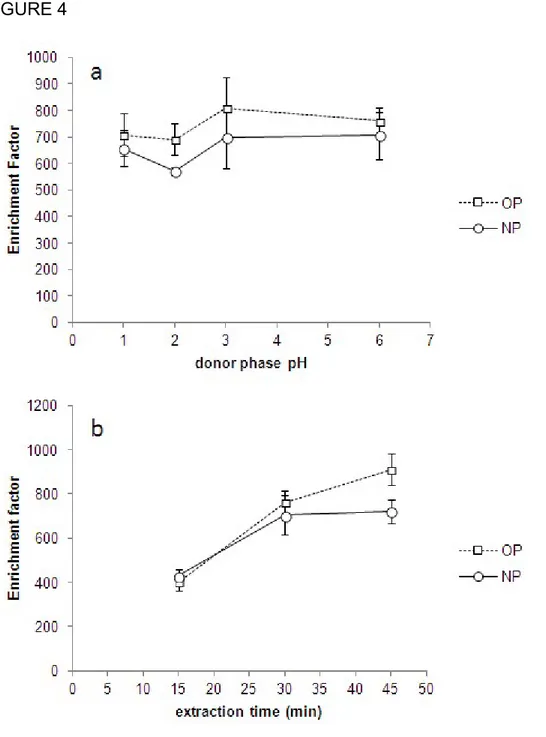
Analytes to be extracted must be in a non-ionized form in the sample to be
transferred into the organic phase. Because of the weak acid nature of the selected alkylphenols (pKa values around 10) the effect of the acidity of the donor phase was studied. For that purpose Milli-Q water samples were prepared at pH values between 1-6 adjusted with HCl and extracted at 800 rpm for 30 min. As can be observed in Figure 4a, the enrichment factor was not improved with the addition of HCl. These results agree with Liu et. al. [9] who found that pH had a significant effect in the
19 kinetics but not in the equilibrium distribution in the extraction of OP and NP. Thus, pH of the water samples was not modified and was maintained to pH 7.
The influence of extraction time was also tested. For this study, water samples were extracted under the optimized conditions. The results are shown in Figure 4b. The Ef
slightly increased up to 45 min for OP while it became constant for NP after a 30 min extraction. Although an extraction time of 45 min provided higher sensitivity for OP, a 30 min extraction time was selected as a compromise between sensitivity and time of the analysis.
3.4. Method validation
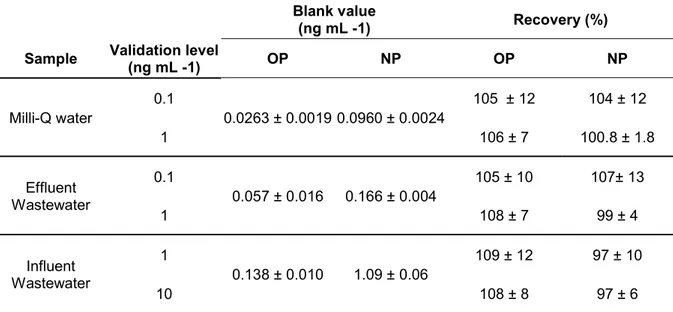
For validation purposes the developed method were evaluated in three types of water samples (Milli-Q, EWW and IWW).It was not possible to find a real blank sample for any of the studied matrices, recommendable for validation purposes, so the blank value was subtracted from fortified samples. This resulted in higher errors in the recovery calculation.
Precision and accuracy of the overall analytical procedure were evaluated by spiking the samples at two different concentration levels (0.1 and 1 ng mL-1), and analyzing
them in quintuplicate. Concentration levels were increased in IWW (1 and 10 ng mL -1) because of its higher endogenous nonylphenol concentration. In relation to the
LOQ, we decided to establish a LOQ objective at 0.1 ng mL-1 for both compounds.
This concentration level was established according to the annual average value for NP (0.3 ng mL-1 ) and OP (0.1 ng mL-1 ), which were the most restrictive values
included in the EU Directive for water [2]. For the measurements, the labeled compounds, 13C1-OP and 13C1-NP, were added at the same concentration level as
20 Figure 5 shows the chromatograms corresponding to the different spiked water
samples analyzed at the low validation level. As can be observed, the minimally 13C
labeled standards and each corresponding analyte co-elute, thus chromatographic isotopic effects were avoided. Coelution of the isotope labeled IS with analyte, which physico-chemical properties are the same, is the key parameter to be affected by the same matrix and, therefore, to compensate its effect [16–18]. Moreover, the expected problem for conventional IDMS, based in the use of a calibration graph, of mass spectrum overlapping is overcome using the IPD calculation procedure [21-23]. Therefore, taking into account that IPD calculations are based on the measurement of isotopic abundances in the sample spiked with the labeled compound, any
possible matrix effect are effectively compensated. Quantification transitions,
employed for IPD calculations, are referred to as OP(1), OP(2), OP (3), NP(1), NP(2) and NP(3) for octylphenol and nonylphenol respectively. All the three SRM transitions could be acquired at this low level for all analytes, making the reporting data highly confident.
Positive findings of NP were confirmed by calculation the peak area ratio between the most intense transition (Q, 219> 133) and the confirmation transition (q, 219> 147) (Figure 5) according to European Commission Decision 2002/657/EC [35]. This decision only applies to residues of veterinary medicinal products but provides added confirmation criteria in complicated compounds such as NP. However, confirmation using the Q/q ratio for OP was not possible according to this decision since this compound does not present other sensitive transition. Nevertheless, applying these criteria for confirmation purposes is not mandatory when IPD calculation tool is used and it has not been employed in previous works [22,23].
21 The precision of the method, expressed as relative standard deviation (in percent), were below 12%, meeting the SANCO guideline [36] which proposes RSD≤ 20%. On the other hand, the accuracy of the method was evaluated by recovery studies and values within 97-109% were obtained. These were within the range required by the SANCO guideline (between 70% and 120%) (See Table 2). These results
demonstrate that the developed procedure based on 13C1-labeled compounds and
isotope pattern deconvolution could be very useful to carry out a reliable and fast determination of OP and NP in environmental waters at the levels established by the legislation.
22 4. Conclusions
In this work, a method for the determination of OP and NP in water samples based on UHPLC-MS/MS has been developed and satisfactorily validated. In this method, the coelution in the same chromatographic peak allows the determination of all NP isomers showing the same fragmentation pathway. To this end, the 13C1-labeled NP
synthesized must be quantified using the commercially available technical mixture of NP. The certification of an apparent concentration for the labeled compound higher than the real one agrees with the variability in the ionization efficiency and
fragmentation inside the technical mixture. This fact makes the assessment of endocrine disruptive activity of NP still a challenge.
HF-LPME, with 1-octanol as acceptor phase, has shown as a reliable (repetitive and efficient) and fast method to extract and preconcentrate AP from water samples, making the whole method rapid and sensitive enough to reach the regulated concentration of AP in environmental waters. Incompatibility of 1-octanol with aqueous LC mobile phase has been effectively eliminated by simple dilution with methanol. On the other hand, the remaining 10% of 1-octanol provides three fold enhancement in the ESI signal for OP and NP.
Regarding quantification, IPD calculations have been proven to be fast, providing one result per sample injection. Quantification, based in IDMS through 13C1-labeled AP
has demonstrated to be free of matrix effect, precise and accurate.
In summary a fast and reliable method has been finally obtained, which do not rely on the use of a calibration graph, which correctly accounts for the matrix effect and is sensitive enough to reach the regulated limits of concentration for OP and NP in water samples. Due to the low cost of the fibers and the overall low time consumption the proposed methodology can be easily implemented in routine laboratories.
23 Acknowledgement
The authors acknowledge the financial support from Generalitat Valenciana (Research group of excellence Prometeo 2009/054). N.Fabregat-Cabello also acknowledges the Generalitat Valenciana for her Ph.D. research grant under the Program VALi+D.Finally the authors are very grateful to the Serveis Centrals d’Instrumentació Científica (SCIC) of University Jaume I for using Acquity and TQD instruments.
References
[1] R. Loos, J. Wollgast, J. Castro-Jimenez, G. Mariani, T. Huber, G. Locoro, G. Hanke, G. Umlauf, G. Bidoglio, P. Hohenblum, W. Moche, S. Weiss, H. Schmid, F. Leien- decker, T. Ternes, A.N. Ortega, A. Hildebrandt, D. Barcelo, P. Lepom, I. Dimitrova, O. Nitcheva, S. Polesello, S. Valsecchi, S. Boutrup, O. Sortkjaer, R. de Boer, J. Staeb, , Trend. Anal. Chem. 27 (2008) 89–95.
[2] Directive 2013/39/EU of the European Parliament and of the Council of 12 August 2013 amending Directives 2000/60/EC and 2008/105/EC as regards priority substances in the field of water policy, 2013.
[3] E. Stottmeister, O.P. Heemken, P. Hendel, G. Donnevert, S. Frey, H. Allmendinger, G. Sawal, B. Jandel, S. Geiss, R. Donau, A. Koch, I. Heinz, M. Ottaviani, E. Veschetti, W. Hartl, C. Kubwabo, C. Benthe, V. Tobinski, H. Woldmann, R. Spilker In, Anal. Chem. 81 (2009) 6765– 6773.
[4] E. Gallart-Ayala, E. Moyano, M.T. Galceran, Mass. Spectrom. Rev. (2010) 776–805.
[5] S. Rabouan, A. Dupuis, A. Cariot, M. Albouy-Llaty, B. Legube, V. Migeot, Trend. Anal. Chem. 37 (2012) 112–123.
[6] E. Olkowska, Ż. Polkowska, J. Namieśnik, Talanta. 88 (2012) 1–13.
[7] M.Á. Bello-López, M. Ramos-Payán, J.A. Ocaña-González, R. Fernández-Torres, M. Callejón-Mochón, Anal. Lett. 45 (2012) 804–830.
[8] S. Pedersen-Bjergaard, K.E. Rasmussen, J. Chromatogr. A. 1184 (2008) 132–42.
[9] J. Liu, X. Hu, J. Peng, J.A. Jönsson, P. Mayer, G. Jiang, Anal. Chem. 78 (2006) 8526–8534. [10] M. Villar-Navarro, M. Ramos-Payán, R. Fernández-Torres, M. Callejón-Mochón, M.Á.
Bello-López, Sci. Total Environ. 443 (2013) 1–6.
[11] N. Salgueiro-González, E. Concha-Graña, I. Turnes-Carou, S. Muniategui-Lorenzo, P. López-Mahía, D. Prada-Rodríguez, J. Chromatogr. A. 1223 (2012) 1–8.
24 [12] A.R. Fischer, N.T.P. Lan, C. Wiedemann, P. Heide, P. Werner, A.W. Schmidt, G. Theumer,
H.-J. Knölker, H.-J. Chromatogr. A. 1217 (2010) 2950–2955.
[13] C. Basheer, H.K. Lee, J. Chromatogr. A. 1057 (2004) 163–169.
[14] S. Müller, M. Möder, S. Schrader, P. Popp, J. Chromatogr. A. 985 (2003) 99–106. [15] P.J. Taylor, Clini. Biochem. 38 (2005) 328–334.
[16] W.M.A. Niessen, P. Manini, R. Andreoli, Mass. Spectrom. Rev. 25 (2006) 881–899. [17] A. Furey, M. Moriarty, V. Bane, B. Kinsella, M. Lehane, Talanta. 115 (2013) 104–122. [18] H. Trufelli, P. Palma, G. Famiglini, A. Cappiello, Mass Spectrom. Rev. 30 (2011) 491–509. [19] W.L. Chen, G.S. Wang, J.C. Gwo, C.Y. Chen, Talanta. 89 (2012) 237–245.
[20] T. Vega-Morales, Z. Sosa-Ferrera, J.J. Santana-Rodríguez, J. Chromatogr. A. 1230 (2012) 66– 76.
[21] A. González-Antuña, P. Rodríguez-González, G. Centineo, J.I. García Alonso, Analyst. 135 (2010) 953–964.
[22] A. González-Antuña, P. Rodríguez-González, I. Lavandera, G. Centineo, V. Gotor, J.I. García Alonso, Development of a routine method for the simultaneous confirmation and determination of clenbuterol in urine by minimal labeling isotope pattern deconvolution and GC-EI-MS, Anal. Bioanal. Chem. 402 (2012) 1879–1888.
[23] A. González-Antuña, J.C. Domínguez-Romero, J.F. García-Reyes, P. Rodríguez-González, G. Centineo, J.I. García Alonso, A. Molina-Díaz, J. Chromatogr. A. 1288 (2013) 40–47.
[24] A. Castillo, E. Gracia-Lor, A.F. Roig-Navarro, J. V. Sancho, P. Rodríguez-González, J.I. García Alonso, Isotope pattern deconvolution-tandem mass spectrometry for the determination and confirmation of diclofenac in wastewaters, Anal. Chim. Acta. 765 (2013) 77–85.
[25] N. Fabregat-Cabello, Á. Castillo, J. V. Sancho, F. V. González, A.F. Roig-Navarro, J. Chromatogr. A. 1301 (2013) 19–26.
[26] J.H.P. Tyman, Synthetic and natural phenols, Elsevier B.V., Amsterdam, 1996: pp. 358–394. [27] R. Loos, G. Locoro, S. Contini, Water Res. 44 (2010) 2325–2335.
[28] J.I. García Alonso, Anal. Chim. Acta. 312 (1995) 57–78.
[29] N. Salgueiro-González, E. Concha-Graña, I. Turnes-Carou, S. Muniategui-Lorenzo, P. López-Mahía, D. Prada-Rodríguez, Talanta. 101 (2012) 413–419.
[30] J. Meija, L. Yang, J. a. Caruso, Z. Mester, J. Anal. At. Spectrom. 21 (2006) 1294–1297. [31] P. Rodríguez-González, J.I. García Alonso, J. Anal. Atom. Spectrom. 25 (2010) 239–259. [32] L. Ramaley, L. Cubero Herrera, Rapid Commun. Mass Sp. 22 (2008) 2707–2714.
[33] M. Ahel, W. Giger, Chemosphere. 26 (1993) 1471–1478.
25 [35] European Union Decision 2002/657/EC, Off. J. Eur. Commun. L221 (August) (2002) 8.
[36] European Commission, DG-SANCO, Method validation and quality control procedures for pesticide residues analysis in food and feed, Document No. SANCO/12495/2011, Brussels, December 2011, http://ec.europa.eu/food/plant/protection/pesticides/docs/qualcont 2012
26 FIGURE 1
27 FIGURE 2
Figure 2. GC-EI-MS TIC chromatogram of 13C1-4-tert-octylphenol and mass spectra of a standard of a
28 FIGURE 3
Figure 3. Signal enhancement obtained for octylphenol (OP) (a) and technical nonylphenol (NP) (b) in ESI source with different ratios octanol:methanol in the injected extract. The relative area was
29 FIGURE 4
Figure 4. Influence of some relevant parameters in the HF-LPME of technical nonylphenol (NP) octylphenol (OP). (a) Influence of the donor phase pH and (b) influence of the stirring time (800 rpm). The error bars depicting the associated uncertainty (1s) of three replicates are represented at each extraction condition.
30 FIGURE 5
Figure 5. Chromatograms in negative electrospray ionization for nonylphenol (NP) and octylphenol (OP) in; (a) Milli-Q water at 0.1 ng mL-1, (b) effluent wastewater 0.1 ng mL-1, and (c) influent
31 Figure Captions
Figure 1. Synthesis pathway of labeled 13C1-4-tert-octylphenol(13C1-OP).
Figure 2. GC-EI-MS TIC chromatogram of 13C1-4-tert-octylphenol and mass spectra of a standard of
(a) 4-tert-octylphenol and (b) 13C1-4-tert-octylphenol (13C1- OP).
Figure 3. Signal enhancement obtained for technical nonylphenol (NP) (a) and octylphenol (OP) (b) in ESI source with different ratios octanol:methanol in the injected extract. The relative are was
normalized to the signal given by the extracts without any octanol.
Figure 4. Influence of some relevant parameters in the HF-LPME of technical nonylphenol (NP) octylphenol (OP). (a) Influence of the donor phase pH and (b) influence of the stirring time (800 rpm). The error bars depicting the associated uncertainty (1s) of three replicates are represented at each extraction condition.
Figure 5. Chromatograms in negative electrospray ionization for nonylphenol (NP) and octylphenol (OP) in; (a) MIlli-Q water at 0.1 ng mL-1, (b) effluent wastewater 0.1 ng mL-1, and (c) influent
32 Table 1. Concentration (µg mL-1) of 13C1-NP solution calculated by reverse IDMS using two different
commercially available NP mixtures. Theoretical concentration of 13C1-NP was 1385 µg mL-1.
Nonylphenol isomer 363-NP refers to 4-(3,6-dimethyl-3-heptyl)phenol. Manufacturer of the NP
mixture Riedel-de Häen Dr. Ehrenstorfer
In-house synthesized 363-NP Purity (%) 95.7 100 99.9 Calculated conncentration (µg mL-1) of 13C1-NP in the spike solution 2275 ± 57 2268 ± 88 1415 ± 68 Ratio between calculated and
theoretical concentration of
13C1-NP 1.64 ± 0.04 1.64 ± 0.06 1.02 ± 0.05
a The uncertainty of the values corresponds to 1s standard deviation of three independent replicates
injected three times each.
Table 2. Recovery and blank values for technical nonylphenol (NP) and 4-tert-octylphenol (OP) in Milli-Q water and effluent and influent waste water obtained by minimal labeling IDMS and isotope pattern deconvolution calculations.
Blank value
(ng mL -1) Recovery (%) Sample Validation level (ng mL -1) OP NP OP NP Milli-Q water 0.1 0.0263 ± 0.0019 0.0960 ± 0.0024 105 ± 12 104 ± 12 1 106 ± 7 100.8 ± 1.8 Effluent Wastewater 0.1 0.057 ± 0.016 0.166 ± 0.004 105 ± 10 107± 13 1 108 ± 7 99 ± 4 Influent Wastewater 1 0.138 ± 0.010 1.09 ± 0.06 109 ± 12 97 ± 10 10 108 ± 8 97 ± 6
a The uncertainty of the values corresponds to 1s standard deviation of three independent replicates