PROCESS INTEGRATION TECHNIQUES IN THE DEVELOPMENT OF NEW ENERGY TECHNOLOGIES : APPLICATION TO THE ISOTHERMAL GAS TURBINE
B. Kalitventzeff, MN. Dumont, F. Maréchal
Univ. Liège, Laboratoire d’Analyse et de Synthèse des Systèmes Chimiques, Sart-Tilman B6A, 4000 Liège, Belgium ; Tel. +32 4 366 35 21 ; Fax +32 4 366 35 25, E-mail : B.Kalitventzeff@ulg.ac.be
ABSTRACT Cogeneration is one of the key technologies for CO2 reduction in the process industry. A good integration of the cogeneration system and the process is necessary to obtain the maximum energy saving. This requires the possibility of adapting the design parameters of the cogeneration system to better suit the process requirements. The isothermal gas turbine is a new concept combining partial oxidation and staged combustion inside a gas turbine to reach electrical efficiencies as high as 58%. The use of steam in the catalytic burner allows to expand steam directly in the gas turbine in such a way that the mechanical power production is increased. The flue gases composition and temperature are therefore modified. New flow sheets for combined cycles will be presented as well as their adaptation to different steam to carbon ratios. When using isothermal gas turbine as a cogeneration system, the steam flowrate allows adapting the flue gases of the turbine in order to match at best the process requirements. The conceptual design of the isothermal gas turbine integration has been performed using the « Effect Modeling and Optimization » concept that is based on process integration techniques. This serves as a first step to identify the major flow rates to be considered for the technology. The final configuration of the integrated technology has been evaluated afterwards using process simulation.
Glossary : Conventional gas turbine (CGT) ; isothermal gas turbine (IGT) ; turbine inlet temperature (TIT) ; steam to carbon ratio (SCR) ; CGT in combined cycle (CGT-CC) ; IGT in combined cycle (IGT-CC)
OXIPAR TECHNOLOGY
OXIPAR is a company that develops and demonstrates the feasibility of a promising new technology called catalytic partial oxidation gas turbine. In conventional combustion, the major portion of air is added to dilute the combustion products, avoiding a too high turbine inlet temperature (TIT). Another way to avoid high temperatures is to react the fuel with air below stoichiometric proportions. Figure 1 shows how the adiabatic temperature of combustion varies with the air to gas ratio, assuming chemical equilibrium is achieved after reaction. It also shows the working area of each technology for TIT lower than 1500K. The combustion in presence of excess O2, is supposed to be complete, according to the reactions :
CH4 + 2 O2 → CO2 + 2 H2O, or [1] CH4 + ½ O2 → CO + 2 H2 [2] CO + ½ O2 →CO2 [3] H2 + ½ O2 →H2O [4]
In case of default of oxygen, as OXIPAR catalytic studies show, partial oxidation implies total consumption of oxygen by reaction {2} followed by the equilibrium reactions :
CH4 + H2O ↔ CO + 3 H2 [5] CO + H2O ↔ CO2 + H2 [6]
In case of partial oxidation, steam is necessary to avoid carbon formation by the reactions :
C O N VEN T IO N AL GA S TURB IN E O X IPAR T(K) 0,0 500,0 1000,0 1500,0 2000,0 2500,0 0 5 10 15 20 25 30 Air/gas ratio Figure 1
CH4 ↔ C + 2 H2 [7] 2 CO ↔ C + CO2 [8]
High temperature cogeneration as well as repowering of existing electrical thermal power plants are the two major investigated fields for OXIPAR technology application.
OXIPAR PROCESS IN HIGH TEMPERATURE COGENERATION
Combined heat and power cycles (cogeneration) allow to simultaneously produce work and deliver heat to a process.
This can be done by combining a thermal engine, such a gas turbine, with a heat recovery system. The exhaust of the gas turbine is hot, and can deliver heat to a process, as shown in the picture. Extra fuel may be burned in the exhaust gas of the
turbine, to increase its temperature and deliver extra heat.
An alternative process is the OXIPAR solution : the partial oxidation gas turbine combined with postcombustion. The complete process has been demonstrated in the University of Liège by OXIPAR engineers with a power turbine of 60 kW. A demonstration plant is being built on an industrial site with a power turbine of 1 MW. Compared to the previous
machine, the air flowrate entering the compressor is much lower, and all the fuel gas is processed in the partial oxidation reactor. The resulting combustible effluent is expanded to produce work, and burned with preheated air to generate heat to be delivered to satisfy process demand.
Exergy is defined as the fraction of heat available at a given temperature that can be converted into useful work by an ideal and reversible cycle (the Carnot engine) exchanging heat only with the given heat source and with the environment. A typical gas turbine transforms 30-35% of the fuel exergy into useful work. Part of the exergy can be recovered in the heat recovery system, but the overall exergy efficiency is 60%. Postcombustion increases the overall efficiency to 69%, and 12% of the total fuel exergy is transformed into work. The OXIPAR technique achieves a 71% efficiency for the overall system, in similar conditions (TIT,...) The OXIPAR process has indeed lower exergy losses. For the same fuel input as in the gas turbine with postcombustion, it requires much lower compression power, which results in lower mechanical losses. Reaction and mixing irreversibility is also lower. The other causes of exergy losses are similar in both processes. This explains why the overall exergy efficiency is typically 2% higher with the OXIPAR process.
The partial oxidation system has also the following advantages :
U1 Air Gas Stack Gas Compressor Power turbine Generator Combustion Post combustion Heat usage
A gas turbine with postcombustion
U1 Air Gas Stack Secondary air Compressor Power turbine Generator Partial oxidation Post combustion Heat usage Steam U2 Air preheater
• preheating air is possible ; it is therefore the logical choice when an existing steam generator or furnace, equipped with a preheater, has to be revamped ;
• it can generate higher flame temperatures and provide the user with thermal energy supplied at a higher average temperature ;
• the delivered work is substantially less dependent on the performances of the machines and is therefore less affected by load variations ;
• the lower yield of a gas turbine is offset by a motor cycle with high exergy efficiency ; by repowering power plants, the total yield of the partial oxidation technology is higher than that obtained by conventional gas turbines.
The thermodynamic analysis in the range of temperature and pressure shows the interest of partial oxidation in case of high temperature cogeneration.
OXIPAR PROCESS IN REPOWERING OF ELECTRICAL POWER PLANTS
Existing power plants can be upgraded using gas turbine : the cycle efficiency and the production can simultaneously be increased.
The power plant can also be upgraded with OXIPAR technology, by processing the fuel gas in a partial oxidation gas turbine. Compared to conventional repowering, this retrofit strategy offers important advantages indicated on the process flowsheet here below[1] and [2].
1
A low-cost, aeroderivative gas turbine, is used to generate the high temperature pressurized stream containing oxygen. This machine is smaller and cheaper than a conventional gas turbine for the same net power production, since the air flowrate is 60% lower. This oxidizing gas is mixed with the preheated fuel and some steam ; it reacts in the partial oxidation reactor in presence of solid catalysts. Expansion of this gas generates mechanical power. The exhaust is a high temperature gas, rich in CO and H2, that is burned in the steam generator. Compared to natural gas, the partially oxidized fuel gas has a lower calorific value, and it must be supplied in larger amount. This requires some modifications of the burners.
Air Stack gas steam 74 MW gas 98 MW 115 MW 72+64 MW air Condenser Steam turbines Gas generator Steam generator OXIPAR turbine Air preheater Water preheat Partial oxidation 3 4 2 6 5 1
2
Since part of the combustion air comes through the gas turbine, the load of the air preheater is decreased by 30%. This leaves energy to preheat the natural gas to be fed to the partial oxidation reactor. When a conventional gas turbine is used, the air preheater cannot be used any more, since the gas turbine exhaust is already hot.
3
The demand for extraction steam to preheat the boiler feed water is the same as for the original process. This is not true when a conventional gas turbine is used : the removed air preheater must be replaced by a water preheater ; as a result, the operating conditions of the steam turbines change and their performance is degraded : less steam drawoff needed for preheating recirculating water and bottleneck at the condenser.
4
Steam to be injected in the reactor can be obtained from the high pressure turbine bleed ; this small increase in the extraction rate does not perturb much the flow profile in the steam turbines. The operating conditions of the steam turbines are not modified with respect to the base case, and their power remains unchanged.
5
In the steam generator, the combustion gas flow rate increases by 10%, and the average temperature in the radiation section decreases only slightly. The steam generator capacity is reduced only by a few percents.
6
If the original burners are not removed, the power plant can operate the same way as before the retrofit, in case the OXIPAR gas turbine has to stop.
The only significant process transformations are the addition of a small gas preheater (new distribution of the preheater surface), the burner modification and the new partial oxidation gas turbine. The shut down time needed is expected to be much shorter than for other retrofit. The power delivered by the steam turbines remains nearly unchanged, and the expansion of the oxidation reactor effluent allows to produce 22% more than with conventional gas turbine. Experimental results obtained so far invites to explore the future of the partial oxidation GT technology.
ISOTHERMAL GAS TURBINE
The so called isothermal gas turbine (IGT) is an innovative promising technology (Figure 3) that uses partial oxidation reactor followed by a staged combustion between the expansion stages to reach a quasi isothermal profile during expansion (Figure 2)[12].
Turbine 1 Turbine2 Turbine3
Turbine4 Boiler 400 600 800 1000 1200 1400 1600 Temperature (°C)
The high temperature level at the stack would suggest interesting use of the turbine together with processes that require very good quality heat, i.e. chemical processes.
The resulting flue gases have a low air excess (total air on CH4 molar ratio equal to 10 instead of 20 for conventional gas turbine in same temperature and pressure conditions) and therefore will produce lower losses at the stack after a recovery boiler.
The staged combustion allows to reduce the exergy losses along the gas turbine. Steam is injected before catalytic reactor to avoid soot formation. For the performance evaluation, the turbine is assumed to work at 60 bar and 1400°C at the inlet of each turbine stage. Pressure ratio are equivalent for each part of the compressor as well as for each stage of the turbine (around 2.8).
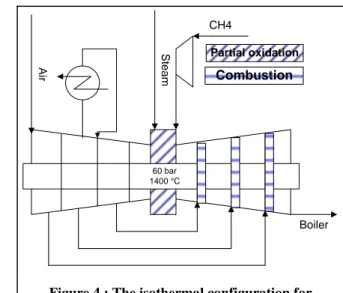
In the original configuration, compressor is cooled with direct water injection. For the evaluation, a conventional configuration with intercooler (Figure 4) has been used. This will facilitate comparisons between cases without modifying conclusions. The natural gas used is pure methane.
The IGT has been studied in two major cases :
a. Stand alone IGT here after called « single cycle », flues gases being used to satisfy process requirements at different temperature levels;
b. In combined cycles (CC) together with steam turbines producing some more electricity.
GAS TURBINE IN SINGLE CYCLE
The study of a gas turbine (GT) in a single cycle includes the study of the efficiency of the turbine itself, i.e. the net power developed by the GT per unit of fuel, and the study of the resulting flue gases. A conventional gas turbine (CGT) working in the same temperature and pressure conditions will be used as reference.
IGT has been studied with different steam to carbon ratio (SCR) at the inlet of the catalytic
CH4 Air Wa te r Boiler S team 60 bar 1400 °C Partial oxidation Combustion
Figure 3 : The isothermal gas turbine configuration
CH4 Air Boiler St eam 60 bar 1400 °C Partial oxidation Combustion
Figure 4 : The isothermal configuration for computations
Table 1 : Isothermal gas turbine study conditions
TIT (temperature inlet turbine),°C 1400
P1 (pressure at the inlet of the first turbine stage), bar 60
PR (pressure ratio over turbines) 2.8
reactor. Steam includes water contained in air (1%) and injected steam. The efficiency of IGT increases when this ratio increases. The ratio is changed with steam. A minimum steam injection is necessary in IGT to prevent soot formation. The maximum amount of steam that could be injected is defined by the temperature at the inlet of the last turbine stage. We do compare IGT with different SCR conditions with CGT.
The efficiency of a case is defined as the net power produced divided by the lower heating value (LHV) of methane (49813.81 kJ/kg) times its mass flow rate.
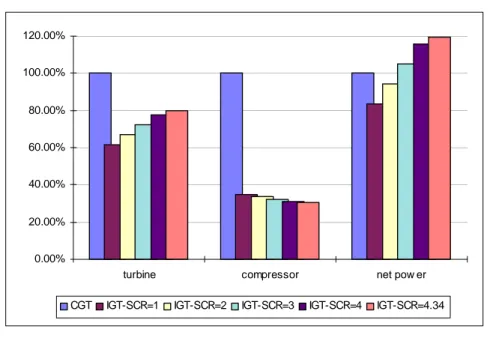
The efficiency of CGT is better than this of IGT when SCR is lower or equal to 2 (Table 2). This highest efficiency is due mainly to highest air flow rates : air/CH4=10 in IGT and air/CH4 ratio=20 in CGT. That leads to turbine scale of IGT 60-80% of the one of CGT and compressor scale 30-35% of the one of CGT (Figure 5). When SCR is bigger or equal to 3, IGT has a better efficiency than CGT with compressor and turbine scales still smaller.
Flue gases flow rates are linked mainly to air flow rates. For IGT there are 58-75% of those of CGT. Flue gases
compositions also change with the different cases. IGT flue gases contain less oxygen and nitrogen but more water. We can also compare partial molar flow rates for each component apart. CGT partial molar flow rates are taken as reference (Figure 6).
Moreover if we consider that the flue gases are perfectly exploited so that they are rejected at
Table 2 : Computed efficiency for CGT and IGT in single cycle
CGT IGT-SCR=1 IGT-SCR=2 IGT-SCR=3 IGT-SCR=4 IGT-SCR=4.34
Single cycle 48.93% 40.82% 46.11% 51.41% 56.71% 58.51% 0.00% 20.00% 40.00% 60.00% 80.00% 100.00% 120.00%
turbine compressor net pow er
CGT IGT-SCR=1 IGT-SCR=2 IGT-SCR=3 IGT-SCR=4 IGT-SCR=4.34
Figure 5 : Turbine, compressor and net power comparisons between CGT (100%) and IGT 0% 50% 100% 150% 200% 250% 300% O2 N2 CO2 H2O
CGT IGT-SCR=1 IGT-SCR=2 IGT-SCR=3 IGT-SCR=4 IGT-SCR=4.34
the stack at 100°C (to avoid condensation), the losses are defined as the heat remaining in the gases at this temperature that is given to the ambiance supposed to be at 20°C. IGT losses are, depending on water content, 65-85% of the losses of CGT. An advantage of IGT is linked to the quality of the flue gases. To analyze them we use the heat cascade techniques of energy integration.
INTRODUCTION TO ENERGY INTEGRATION
Process integration techniques have been developed to highlight energy savings opportunities in industrial processes. They are based on pinch point principles first suggested by Hohmann
[3] in the beginning of 70ies and largely developed during the 80ies [4].
The identification of the pinch point is the first step for the engineers to analyze the energetic performances of a process [7] and then optimize the use of energy in this process. The representation of a process, using its hot and cold streams, in an enthalpy/temperature diagram is a very convenient way to define the minimum energy requirements and to locate optimum heat exchangers. The definition of the smallest acceptable temperature difference (DTmin) does guaranty limitation of investments required for heat exchangers. Exergy losses can be evaluated with the area between hot and cold composite curves.
The IGT can be studied using energy integration techniques.
The ∆T corrected grand
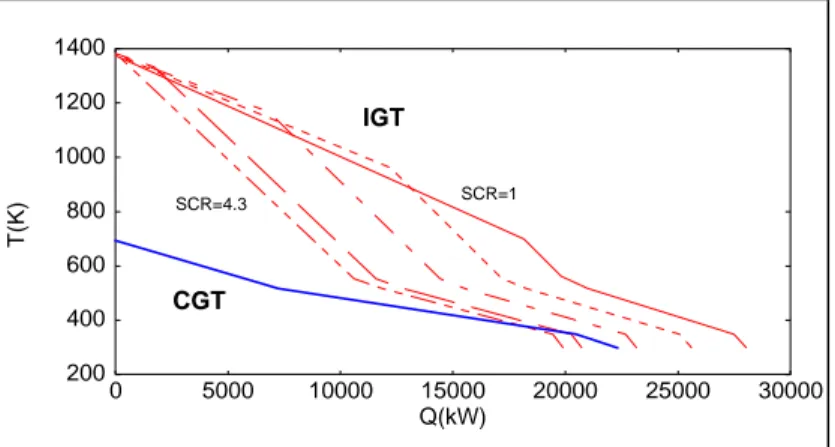
composite curves (GCC) of the Figure 7 show that more energy is available after IGT than after CGT and this energy has a better temperature level. The minimum
∆T accepted to produce steam is equal to 26°C. The break points that appear in the GCC correspond to the intercooler (low temperature) and to the regenerative heat exchanger (high temperature).
In IGT a part of the flue gases is used to produce the steam to be injected (Figure 8). This does not change the quality of the flue gases but the amount of heat to be given to the process decreases as there is no postcombustion. On Figure 8 the maximum amount of heat available above steam temperature
follows vertical line and is equal to « HEAT 1 » for IGT-SCR=1 and to « HEAT 4 » for IGT-SCR=4. Above the intersection between vertical line and flue gases composite curve, this amount decreases but some heat is still available. That highlights the advantages of the IGT when processes require high temperature
200 400 600 800 1000 1200 1400 0 5000 10000 15000 20000 25000 30000 T(K ) Q(kW) CGT IGT SCR=1 SCR=4.3
Figure 7 : GCC of flue gases in different cases
200 400 600 800 1000 1200 1400 0 5000 10000 15000 20000 25000 30000 T(K) Q(kW) CGT IGT SCR=1 SCR=4 Heat 4 Heat 1
We have computed the maximum amount of steam that can be produced in a boiler with the flue gases for different temperatures and pressures (Figure 8 & Figure 9). In IGT, the steam
production for process decreases with SCR due to steam to be produced for the injection. It is not possible to produce any 100 bar high pressure steam with conventional turbine that is why IGT with SCR=2 has been chosen as reference for steam production. The benefits of the IGT increase with the temperature of process requirements.
On Table 2 we have defined the efficiency of a case as being its electrical efficiency. We can also define a « heat efficiency » as being the heat that can be recovered at a given temperature divided by the LHV of methane used (Table 3).
It appears that if you want to burn 1 kg methane, you have still the possibility to chose the quantity and the quality of the heat you want to recover in the flue gases (Table 4).
Table 4 : Electricity and heat production for 1 kg/s of methane
CGT IGT-SCR=1 IGT-SCR=2 IGT-SCR=3 IGT-SCR=4 IGT-SCR=4.34
Electricity 24 375 20 332 22 970 25 609 28 249 29 146 Q-steam GT - 2 923 6 007 9 090 12 174 13 221 Q-process (800K) - 25 059 19 541 13 137 6 385 4 016 Q-process (500K) 15 756 25 059 19 541 14 023 8 073 5 873 Q-process (400K) 19 672 25 059 19 541 14 023 8 505 6 631
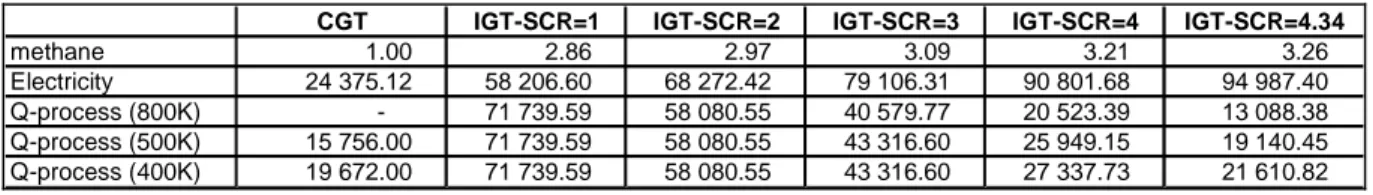
The difference is even more important if you want to work with the same compressor size (Table 5) or the same turbine size (Table 6), let us say those of the CGT used to burned 1 kg/s methane. 0.00% 20.00% 40.00% 60.00% 80.00% 100.00% 120.00% 140.00%
Steam 2 bar 400K Steam 10 bar 500K Steam 100 bar 800K CGT IGT-SCR=1 IGT-SCR=2 IGT-SCR=3 IGT-SCR=4 IGT-SCR=4.34
Figure 9 : Different steam production for CGT and IGT. Reference (100%) is steam produced by IGT SCR=2
Table 3 : Electrical and heat efficiencies
CGT IGT-SCR=1 IGT-SCR=2 IGT-SCR=3 IGT-SCR=4 IGT-SCR=4.34
Electrical efficiency 48.93% 40.82% 46.11% 51.41% 56.71% 58.51%
Heat efficiency (800K) 0.00% 50.31% 39.23% 26.37% 12.82% 8.06%
Heat efficiency (500K) 31.63% 50.31% 39.23% 28.15% 16.21% 11.79%
Table 5 : Electricity and heat production for the same compressor size
CGT IGT-SCR=1 IGT-SCR=2 IGT-SCR=3 IGT-SCR=4 IGT-SCR=4.34
methane 1.00 2.86 2.97 3.09 3.21 3.26 Electricity 24 375.12 58 206.60 68 272.42 79 106.31 90 801.68 94 987.40 Q-process (800K) - 71 739.59 58 080.55 40 579.77 20 523.39 13 088.38 Q-process (500K) 15 756.00 71 739.59 58 080.55 43 316.60 25 949.15 19 140.45 Q-process (400K) 19 672.00 71 739.59 58 080.55 43 316.60 27 337.73 21 610.82
Table 6 : Electricity and heat production for the same turbine size
CGT IGT-SCR=1 IGT-SCR=2 IGT-SCR=3 IGT-SCR=4 IGT-SCR=4.34
methane 1.00 1.62 1.49 1.38 1.28 1.25 Electricity 24 375.12 32 904.60 34 199.05 35 298.83 36 244.92 36 536.81 Q-process (800K) - 40 554.90 29 093.74 18 107.51 8 192.23 5 034.43 Q-process (500K) 15 756.00 40 554.90 29 093.74 19 328.74 10 358.01 7 362.35 Q-process (400K) 19 672.00 40 554.90 29 093.74 19 328.74 10 912.29 8 312.58
We do conclude that when using IGT as a cogeneration system, the flue gases of the turbine can be adapted with steam injection in order to match at best electrical and thermal process requirements. The ratio electricity to fuel varies from 0.8 to 5.
GAS TURBINE IN COMBINED CYCLE
In combined cycle, heat contained in the flue gases is recovered to produce steam to be expanded in a steam
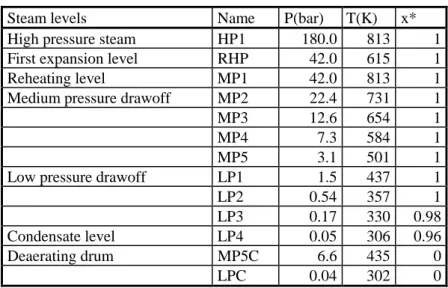
turbine instead of producing steam for process use. Possible steam levels have been defined in Table 7, the temperatures are those measured on an existing conventional power plant using coal drawn in Figure 10.
When the flue gases composite curve profile is changing the flowrates and therefore the steam cycle structure has to be
adapted. To solve this problem we have used Effect Modeling and Optimization approach. This approach finds its base in the principles of process integration techniques especially those using linear programming algorithms. These methods based on heat cascade definition [7] were pioneered by Cerda [5] and Papoulias and Grossmann [6]. The latter allow to resolve process integration problems without having to arbitrarily define a (super)structure for heat exchangers. A big advantage of this technique is that the heat exchangers network is defined afterwards but we are sure that there exists at least one process configuration with at least the specified DTmin in all the exchangers. This has been used here in the field of power plants where we do not want a priori to fix the steam network structure and where flow rates, temperature and pressure levels have to be optimized in such a way that the optimal efficiency is reached : the targeting is worked out without to care about the process configuration. In a second step (the synthesis step) an optimal process configuration will be extracted by analysis and discretisation from a reasonable process superstructure including selected alternatives. The purpose is to model an ideal and feasible effects network to optimize the utilization of the
RHP
Conventional Power Plant
FUMES HP1 MP1 MP2 MP3 MP4 MP5 LP1 LP2 LP3 LP4 LPC MPC Steam for isothermal turbine
energy in a process. The EMO concept [9] is built up with three elements : the definition of the effects, the definition of a model and the definition of an optimization model. The optimization model requires the definition of the variables, the constraints and an objective function. Identifying the different operations that happen in a process, e.g. compression, intercooling, preheat, oxidation, mix, expansion, ..., we associate a variable that represents the extend of the operation and the effects that are linked to this operation, e.g. heat requirements, mechanical power production, oxygen consumption, water consumption,... When required, a second variable (an integer y) is used to represent the use (y=1) or not (y=0) of the operation. The interconnections between the different operations and the effects are represented in a model made of equality and inequality constraints. One of the main characteristics of such model is that we do not represent the structure of the system, i.e. the links between the operations. The constraints are formulated in such a way that these will guarantee that at least one feasible structure exists. These concern : the possible heat exchanges (represented by modeling the heat cascade), the mechanical power balance, the oxygen balance in a combustion, the mass balance in the steam system, ...[14].
In the case of advance gas turbine cycles, the EMO concept has been used to identify the optimal steam network to be used in order to valorize the heat of the flue gases from the gas turbine.
On combined cycle case we work with the power plant superstructure defined in Table 7. That includes the levels of an existing conventional plant. A steam level for the steam to be injected in IGT-CC has also been added. The cooling system is assumed to be at 288K
As it can be shown on Figure 7 & Figure 8, the flue gases composite curves that represent, as a function of the temperature, the heat available from the gas turbine system for a process or for producing steam may vary from one simulation case to another. In each case, the optimal steam cycle has to be identified, i.e. the identification of the optimal pressure levels and the optimal flowrates for the steam production or for the steam drawoffs in the cycle. The only necessary data are : the hot sources profiles (enthalpy-temperature diagram), the steam conditions (T, P, vapor state) of the different levels (steam production and drawoff). From the application of the method, we obtain the optimal flowrates to be used in order to maximize the power production. Of course, the job is not finished and it remains to design the new heat exchanger network. The interest of the method is a rapid screening among process alternatives
Table 7 : Steam levels definition
Steam levels Name P(bar) T(K) x* High pressure steam HP1 180.0 813 1 First expansion level RHP 42.0 615 1
Reheating level MP1 42.0 813 1
Medium pressure drawoff MP2 22.4 731 1
MP3 12.6 654 1
MP4 7.3 584 1
MP5 3.1 501 1
Low pressure drawoff LP1 1.5 437 1
LP2 0.54 357 1
LP3 0.17 330 0.98
Condensate level LP4 0.05 306 0.96
Deaerating drum MP5C 6.6 435 0
LPC 0.04 302 0
allowing a lot of "what if ?" or "where to place ?" questions to be quantified without heavy simulations due to the necessity of modifying the process structure.
The integrated composite curves (ICC) of the water/steam cycle (Figure 11) integrated to the CGT flue gases is a very convenient way for visualizing the water cycle integration [10]. In this figure, the composite of all the hot and cold streams of the water/steam cycle is matched to the composite curve of the hot stream of the flue gases. The mechanical power produced is represented by the balance between the hot and the cold streams of the water/steam cycle. We define EFF, the efficiency of the global combined cycle and EFFGT, the efficiency of the stand alone gas turbine.
On the Figure 11, we have represented the production of steam MP3, MP4, MP5, LP1, LP2 and LP3 and the expansion of those several steam levels to the condensing level (LP4). We notice that MP3 is the highest pressure level due to the lower quality (temperature) of the flue gases.
On Figure 11, several pinch points corresponding to the different steam production have been activated. The steam production flow rates have been computed in order to reach a technological constraint defined with the minimum temperature difference (DTmin) accepted in a heat exchanger. The value is DTmin=2°C for the exchangers of the water cycles, 26°C for the exchangers between the flue gases and the water cycle, 50°C for the exchangers between air and flue gases and 26°C for exchangers between steam and air. The small value of DTmin in the water cycle is explained by the fact that heat recovery by injection (DTmin=0) is possible. When pinch points are not created, the energy potential is not well exploited. At the system level, this means that a part of the energy of the fumes is directly sent to the cooling system without producing mechanical power.
200 300 400 500 600 700 800 900 0 5000 10000 15000 20000 25000 T(K) Q(kW) MP3 MP4 MP5 LP1 LP2 LP3 LP4 EFF = 57.36% EFFGT = 48.93%
If we consider that there is 100% circulating water in the cycle, the different steam productions are :
Table 8 : Produced steam distribution in CGT-CC
HP1 MP1 MP2 MP3 MP4 MP5 LP1 LP2 LP3
0% 0% 0% 62% 8% 10% 7% 8% 3%
We have optimized the same superstructure with the flue gases of the IGT-CC (Figure 12 & Figure 13) for different SCR.
We notice that the necessary medium and low pressure steam productions as well as global efficiency increase with the water content at the inlet of the catalytic reactor of the IGT-CC (Table 9 & Table 10).
In combined cycle, the efficiency of the IGT-CC is always better than the efficiency of the CGT-CC (Table 11). Moreover in IGT-CC efficiency increases with water content but slower than in single cycle.
200 400 600 800 1000 1200 1400 0 5000 10000 15000 20000 25000 30000 T( K) Q(kW) EFF = 59.12% EFFGT = 40.82% HP1 Energy for the injected steam
Figure 12 : Integrated composite curve of water/steam cycle in IGT-CC SCR=1 Table 9 : Produced steam distribution in IGT-CC
SCR=1 HP1 MP1 MP2 MP3 MP4 MP5 LP1 LP2 LP3 96.5% 0.0% 0.5% 0.7% 0.7% 0.9% 0.7% 0.0% 0.0% 200 400 600 800 1000 1200 1400 0 5000 10000 15000 20000 T( K) Q(kW) MP3 MP4 MP5 LP1LP2 LP3 LP4 EFF = 63% EFFGT = 58.51% HP1 MP1 MP2
Energy for the injected steam
Figure 13 : Integrated composite curve of water/steam cycle in IGT-CC SCR=4.34 Table 10 : Produced steam distribution in IGT-CC
SCR=4.34
HP1 MP1 MP2 MP3 MP4 MP5 LP1 LP2 LP3 74.0% 2.4% 5.1% 4.5% 3.7% 4.5% 3.1% 2.7% 0.0%
Table 11 : Computed efficiency for CGT-CC and IGT-CC
CGT IGT-SCR=1 IGT-SCR=2 IGT-SCR=3 IGT-SCR=4 IGT-SCR=4.34
Stand alone GT 48.93% 40.82% 46.11% 51.41% 56.71% 58.51%
Whatever the computed case, the corresponding optimized steam network is complex with several steam production levels and some steam extraction for water preheating. On Figure 14, the optimized steam network computed for IGT-CC cases with SCR>=3 has been represented. In Table 12 we give the different steam network configurations for the different studied cases.
Table 12 : Optimized steam production and extraction location
Steam production Steam extraction IGT-CC SCR=1 HP1,MP2, MP3, MP4, MP5, LP1 MP1, LP2, LP3 IGT-CC SCR=2 HP1,MP2, MP3, MP4, MP5, LP1 MP1, LP2, LP3 IGT-CC SCR=3 HP1,MP1,MP2, MP3, MP4, MP5, LP1, LP2 LP3 IGT-CC SCR=4 HP1,MP1,MP2, MP3, MP4, MP5, LP1, LP2 LP3 IGT-CC SCR=4.34 HP1,MP1,MP2, MP3, MP4, MP5, LP1, LP2 LP3 CGT-CC MP3, MP4, MP5, LP1, LP2, LP3 -MP1 LPC Steam for isothermal turbine HP1 MP1 MP2 MP3 MP4 MP5 FUMES FUMES HP turbine MP turbine LP turbine 180 bar 42 bar 22.4 bar 12.6 bar 7.3 bar 3.1 bar 0.04 bar CW Feed Water HP1 MP2 MP3 MP4 MP5 LP3 LP4 LP3
In order to reduce the complexity of the steam network, we have used our optimization program under constraints : we allow only one steam production level, high pressure steam HP1 (Figure 15, Figure 16 & Figure 17). The electrical efficiency of the CGT-CC in combined cycle is the same as with CGT in single cycle because it is not possible to produce HP1. The efficiency of the IGT-CC is reduced in comparison with past case and even more if water content increases (Table 13).
We can notice, particularly in Figure 17 (to be compared with Figure 13), that the simplification of the steam network increases exergy losses (the curves-flue gases and steam production- do not match) as well as energy losses at the stack (temperature of flue gases increases at the outlet of the stack). This explains the reduction of efficiency that varies from 0.2% to 1.7% with water content but the more simple structure of the new steam network does reduce costs of investment. That has to be taken into account in a global evaluation.
The structure of the IGT-CC with only one high pressure steam generator is presented in Figure 18. The air in the intercooler is partly cooled down by water preheating. Steam coming from the high pressure turbine is mixed with air and gas. This resulting stream is preheated in the first part of the stack before going into the partial oxidation reactor. This heat exchange is necessary to reach the temperature of 1400°C at the outlet of the reactor.
200 300 400 500 600 700 800 900 0 5000 10000 15000 20000 25000 T(K) Q(kW) No HP1 steam production HP1 temperature level
Figure 15 : Integrated composite curve of water/steam cycle with CGT-CC
flue gases ; HP1 steam level production = NOTHING
200 400 600 800 1000 1200 1400 0 5000 10000 15000 20000 25000 30000 T(K ) Q(kW) HP1 EFF = 58.91% EFFGT = 40.82% Energy for the injected steam
Figure 16 : Integrated composite curve of water/steam
cycle in IGT-CC SCR=1 HP1 steam level production
200 400 600 800 1000 1200 1400 0 5000 10000 15000 20000 T( K ) Q(kW) HP1 Energy losses at the stack EFF = 61.31% EFFGT = 58.51%
Energy for the injected steam Stack outlet temperature Exergy
losses
Figure 17 : Integrated composite curve of water/steam cycle in IGT-CC SCR=4.34
air steam Intercooler Water preheat Steam turbines gas Stack High pressure steam generator Partial oxidation Condenser Inlet partial oxidation preheat
Figure 18 : Structure of combined cycle with IGT-CC
We have also computed an intermediate solution allowing the use of two steam production levels, HP1 & LP1. The efficiency of the IGT-CC is improved and even more that water content increases (Table 13). The structure of this new combined cycle with IGT-CC is more complex due mainly to two steam generators.
Table 13 : Computed efficiency for CGT-CC and IGT-CC in combined cycle
CGT IGT-SCR=1 IGT-SCR=2 IGT-SCR=3 IGT-SCR=4 IGT-SCR=4.34
GT-CC 57.36% 59.12% 60.30% 61.47% 62.61% 63.00%
GT-CC (HP1-LP1) 53.35% 59.03% 60.09% 61.08% 61.99% 62.30%
GT-CC (LP1) 48.93% 58.91% 59.75% 60.49% 61.10% 61.31%
Efficiency of the CGT-CC is the most affected by the complexity of the structure of the steam network. The more the water content is important and the more the efficiency of the IGT-CC is also changed (Figure 19). The best efficiency (63%) in combined cycle is reached with the highest amount of water in the IGT-CC. In combined cycle, CGT-CC efficiency is always lower than the
IGT-CC efficiency. Another interesting conclusion
concerns the way to reach a given efficiency in IGT-CC : with a simplified steam network, it is possible to reach 48.00% 50.00% 52.00% 54.00% 56.00% 58.00% 60.00% 62.00% 64.00% GT-CC GT-CC (HP1-LP1) GT-CC (LP1)
CGT IGT-SCR=1 IGT-SCR=2 IGT-SCR=3 IGT-SCR=4 IGT-SCR=4.34
the same efficiency as with a more complicated one by changing the water content in the GT (Figure 20).
With a complex steam network 61% efficiency is reached with SCR=2.6, with a 2 levels for steam production, same efficiency is reached with SCR=2.9 and with a single level for steam production, this efficiency is reached with SCR=3.8.
ISOTHERMAL TURBINE OR COMBINED CYCLE
In single cycle, we have computed that the efficiency of the IGT increases with the water content at the inlet of the catalytic reactor (Table 2). The maximum steam injection was defined by the temperature at the inlet of the last stage turbine, fixed at 1400°C.
In combined cycle, we have reached the same conclusion (Table 11) but the efficiency variation was slower than in the
single cycle. Moreover the part of efficiency due to steam network decreases SCR at the inlet of the catalytic reactor (Figure 21) from 31% (SCR=1) to 7% (SCR=4.34).
We can imagine a limit case where this contribution is equal to zero. That means that instead of producing steam to be expanded in a steam turbine, the heat contained in flue gases is completely used to produce steam to be injected in the IGT. This limit case can only be
58.50% 59.00% 59.50% 60.00% 60.50% 61.00% 61.50% 62.00% 62.50% 63.00% 63.50% 1.0 1.5 2.0 2.5 3.0 3.5 4.0 4.5 H2O/CH4
Combined Cycle Combined Cycle-HP1-LP1 Combined Cycle-HP1
Figure 20 : Efficiency evolution with SCR in IGT-CC & for different steam networks difficulties
60% 65% 70% 75% 80% 85% 90% 95% 100% CGT IGT SCR=1 IGT SCR=2 IGT SCR=3 IGT SCR=4 IGT SCR=4.34
Steam network contribution
Gas turbine contribution
Figure 21 : Contribution of steam network in combined cycle global efficiency
reached if the temperature of the flue gas at the inlet of the stack decreases. We have to modify one of the assumptions in the definition of the IGT to do it :
• pressure ratios are not equivalent over each turbine stage, the last one (PR4) can be greater ;
• temperature is not equal to 1400°C at the inlet of the last stage turbine (Tin4) but smaller. Both possibilities have been computed. They give the same kind of grand composite curve (GCC) for the IGT (Figure 22) to be compared with Figure 8. The steam production is maximum and a pinch has been created. There is still a possibility to recover some lower
quality heat below the pinch point.
The temperature evolution for both optimized cases has been drawn in Figure 23. There is no difference for the three first turbine stages. When pressure ratio changes, the temperature at the inlet of the last turbine is unchanged but temperature at the stack decreases. When temperature at the inlet of the last turbine changes, the temperature at the stack follows it in same proportion.
Turbine 1 Turbine2 Turbine3
Turbine4 Stack 1000 1050 1100 1150 1200 1250 1300 1350 1400 1450 1500 Temper atur e (°C )
Base case Optimized case, TIN4 Optimized case, PR4
Figure 23 : Temperature evolution in IGT with
pressure ratio change (PR4) and temperature inlet change (Tin4)
The advantages of this method are linked to the reduction of investments as steam turbines have been removed. The disadvantages are linked to the increasing losses because injected steam is lost in the stack instead of being recycled in steam network. But whatever the steam injection considered, losses are always smaller than in CGT-CC.
200 400 600 800 1000 1200 1400 0 1000 2000 3000 4000 5000 6000 7000 8000 9000 T(K ) Q(kW)
Table 14 shows that in IGT, it is always better to keep temperature at the inlet of the last stage turbine as high as possible. The computed water to be injected in the turbine is smaller when we change the pressure ratio than when we decrease this temperature with a best efficiency. The flow rate of the flue gases as well as the losses are also smaller.
INVESTMENTS
In a CGT, we can consider that the investment costs are divided in :
• 60 % gas generator (30 % compressor, 30 % turbine) ;
• 30 % free turbine ;
• 10 % combustion chamber.
Moreover, we can compare investments cost between gas turbine with :
C C P P 1 2 1 2 0 85 =( ) .
If we consider only turbine and compressor powers without considering any reactor, we obtain that the investment cost for IGT is 62 to 75 % of the investment cost for CGT. The cost of the partial oxidation reactor and of the 3 combustion chambers has to be maintain under the difference to 100% to keep this new technology economically interesting.
CONCLUSIONS
IGT is a promising innovative technology that can be used either in single cycle for cogeneration system or in combined cycle to produce only electricity.
Effect Modeling an Optimization techniques were used successfully in order to compute the integration of the IGT in a given process. The water content at the inlet of the catalytic reactor was identified as being the principal parameter to modify in order to match process requirements. For a given compressor size water content can be adapted so as to obtain more or less recovered heat in flue gases. The quality (temperature) of the flue gases due to a minimum air excess is so good that it can be used to produce very high pressure steam . The minimum losses at the stack are always lower than those obtained in a CGT working under the same conditions of pressure and temperature. Electrical efficiency increases from 40.82% to 58.51% with SCR at the inlet of the catalytic reactor varying from 1 to 4.34 while heat efficiency at 800K decreases from 50% to 8% within the same SCR. This particularity allows user to adapt steam injection to match his own process requirements, both electricity and steam.
The integration of IGT in combined cycle allows to reach electrical efficiencies from 59.12% to 63% depending on steam injection in the gas turbine. The combined cycle configurations vary with SCR. Several steam production levels are necessary to perfectly match the IGT flue gases. With only two steam production levels allowed, the electrical efficiency varies from 59% to 62.3% but steam network is much more simple reducing cost of investment.
Characteristics of the IGT as pressure ratio and temperature at the inlet of the last stage
Table 14 : Water content and efficiency evolution
H2O/CH4 Efficiency
Base 4.34 58.50%
Optimized case pressure ratio changes (PR4) 4.7 61.88% Optimized case inlet temperature changes (Tin4) 4.84 61.30%
turbine have been modified to allow suppression of steam turbines. All the steam that is produced recovering flue gases is immediately injected into the gas turbine. Electrical efficiency varies from 61.3% to 61.88% but process was strongly simplified since there remains nothing any more but one drum for vaporizing the steam to inject into the IGT.
Effect modeling and optimization has been convinced to be a very powerful tool in energy integration applications. It has still to be developed to take into account the effects of partial oxidation reactor as well as combustion chambers. This would permit the identification of the optimal gas turbine to match a given process without using other simulation tools. A Ph. D. thesis is expected to be done soon in that field. The same methodology would be applied to staged combustion in CGT, although NOx formation would there remain a problem.
More generally, CAPE tools have been used successfully either in existing technology evaluation as well as in new technology developments.
ACKNOWLEDGMENT
The authors would like to thank OXIPAR company to have make the present work possible.
REFERENCES
[1] Heyen G., Kalitventzeff B., A Comparison of Advanced Thermal Cycles Suitable for Upgrading Existing Power Plant, to be published in Applied thermal Engineering, MS768, (1998) [2] Heyen G., internal document (available on request), (1998)
[3] Hohmann E.C., Optimum Networks for heat exchange, Ph D thesis Univ of Southern California, (1971)
[4] Linnhoff B..Townsend D.W., Boland P., Hewitt G.F., Thomas B.E.A., Guy A.R., Marsland R.H., A User Guide on Process Integration for the Efficient Use of Energy., The Institution of Chemical Engineers, (1982)
[5] Cerda I., Westerberg A.W. , Mason D. , Linnhoff B., Minimum utility usage in heat exchanger network synthesis. A transportation problem., Chemical Engineering Science, Vol. 38, n3, pp. 378 - 387, (1983)
[6] Papoulias S.A., Grossmann I.E., A structural optimization approach in process synthesis - I. Utility systems, Computers and Chemical Engineering, Vol. 7, n_ 6, pp. 695-706, (1983a)
[7] Maréchal F., Méthode d’Analyse et de Synthèse Energétiques des Procédés Industriels, Ph. D. thesis, University of Liège , (1995)
[8] Maréchal F., Kalitventzeff B., Targeting the Minimum Cost of Energy Requirements : a new graphical technique for evaluating the integration of utility systems, Computers & Chemical Engineering, Special issue of Escape 6, Vol 20, pp. S225-S230, (1996)
[9] Maréchal F., Kalitventzeff B., Effect modeling and optimisation, a new methodology for combined energy and environment synthesis of industrial processes, Applied Thermal Engineering, (1997)
[10] Maréchal F., Kalitventzeff B., Identify the optimal pressure levels in steam networks using Integrated Combined Heat and Power method, Chemical Engineering Science, Vol 52, No 17. pp. 2977-2989, (1997)
[11] SPE, P&ID de la centrale de Seraing, cycle combiné TGV.
[12] Brevet OXIPAR, « Système énergétique thermique à turbine à gaz avec oxydation partielle catalytique de combustible », n° de publication 1009707A6.
[13] VALI III user guide, Belsim s.a., Centre Socran, avenue Pré-Ailly, B-403I Angleur - Belgium.
[14] Maréchal F., Kalitventzeff B., Process Integration : Selection of the Optimal Utility System, Computers chem. Engng. Vol. 22, suppl., pp. S149-S156, (1998)