HAL Id: hal-02981836
https://hal.archives-ouvertes.fr/hal-02981836
Submitted on 28 Oct 2020
HAL is a multi-disciplinary open access
archive for the deposit and dissemination of
sci-entific research documents, whether they are
pub-lished or not. The documents may come from
teaching and research institutions in France or
abroad, or from public or private research centers.
L’archive ouverte pluridisciplinaire HAL, est
destinée au dépôt et à la diffusion de documents
scientifiques de niveau recherche, publiés ou non,
émanant des établissements d’enseignement et de
recherche français ou étrangers, des laboratoires
publics ou privés.
DC/DC converter based on SiC semiconductors
combined with online EIS detection functionality for
Fuel Cell Electrical Vehicles
Hanqing Wang, Arnaud Gaillard, Daniel Hissel
To cite this version:
Hanqing Wang, Arnaud Gaillard, Daniel Hissel. DC/DC converter based on SiC semiconductors
combined with online EIS detection functionality for Fuel Cell Electrical Vehicles. Symposium de
Génie Electrique, Université de Lorraine [UL], Jul 2018, Nancy, France. �hal-02981836�
SYMPOSIUM DE GENIE ELECTRIQUE (SGE 2018), 3-5 JUILLET 2018, NANCY, FRANCE
DC/DC converter based on SiC semiconductors
combined with online EIS detection functionality for
Fuel Cell Electrical Vehicles
Hanqing WANG
1,2,3, Arnaud GAILLARD
1,2,3, Daniel HISSEL
1,31
Univ. Bourgogne Franche-Comte; 2 UTBM; 3 FCLAB, FEMTO-ST institute, CNRS
ABSTRACT--This paper deals with the integration of Electrochemical Impedance Spectroscopy (EIS) functionality in DC/DC boost converter for Polymer Electrolyte Membrane Fuel Cell (PEMFC). A six-phase Interleaved Boost Converter (IBC) is chosen to extend the FC lifespan. Aiming at Fuel Cell Electrical Vehicles (FCEV) application, inverse coupled inductor and Silicon Carbide semiconductors are used to achieve low power losses, good thermal performance and highly-compacted system. Sliding Mode Control (SMC) has been chosen as the control strategy to satisfy the requirements of this non-linear system. EIS implementation is achieved by the injection of perturbation to the reference current of inductor and do not need any additional devices.
Keywords—Online EIS, Sliding Mode Control, DC/DC Converter, PEMFC, Fuel Cell Electric Vehicle
1. INTRODUCTION
Proton Exchange Membrane Fuel Cell (PEMFC), which is treated as one of the most attractive green power source, features different characteristics such as zero pollution, low operating temperature, fast start-up, long cell and stack life [1]. As a high-current low-voltage power source, PEMFC system’s output voltage must be increased to approximately a few hundred volts to be suitable with vehicle powertrains. DC/DC boost converter based on interleaved structure has here been chosen because of its good compatibility regarding the requirements of an embedded converter in a transportation application [2]. SiC semiconductors and inverse coupled inductors have been utilized, low power losses, high switching frequency and higher inductance density have been achieved [3]. Meanwhile, Sliding Mode Control (SMC) has been utilized to satisfy the nonlinearity of the inverse coupled inductor [4].
So far, general lifespan of PEMFC cannot reach the expectation of commercial application. For example, a typical life expectancy of the PEMFC under actual transportation constraints is around 3000 h, whereas transportation applications require at least 5000 h [5]. Hence, the primary assignment to be solved for universal application of PEMFC is to increase its reliability and durability. Indeed, the manufacture of PEMFC is mainly depending on high cost noble materials (platinum catalyst, acid membrane, etc.) with limited durability especially in unstable operations and cyclic stress operation.
The operating conditions of PEMFC are essential to be monitored and controlled for the purpose of expending lifespan of power source. Electrochemical impedance spectroscopy (EIS) is established as a powerful characterization tool to detect different failure mechanisms occurring in a fuel cell. Impedance spectra can help to characterize a cell in much more complicated mode than just analyzing the polarization curve [6]. EIS detection based on fuel cell connected converter is an attractive method which is possible to realize on-line detection without any additional equipment [7] [8].
Narjiss et al. [9] and Depernet et al. [8] have proposed an approach to realize on-line EIS detection functionality based on the conventional Full-Bridge converter connected to the fuel cell stack. These measurements were based on the current perturbation injection technique. However, only DC bus voltage was controlled by PI controller in these two studies. What is worse, close loop control was impossible during the detection process, which means the stability of DC bus voltage cannot be ensured. Hong et al. [7], Hinaje et al. [10] and Bethoux et al. [11] have also separately realized this objective based on the conventional DC/DC Boost converters. The dual-loop PI controllers have been selected by Hong [7] and Bethoux [11] while the PID controller has been selected by Hinaje [10]. According to the study of Bethoux [11], close loop control was realized during the detection process of EIS; the perturbation signal should be injected to the DC bus reference or the input current reference was depending on the frequency of perturbation signal. Nonetheless, towards the application of FCEV, only conventional DC/DC converters such as Boost and Full-Bridge can be found depending on these references.
In light of these mentioned previously, a 6-Phase Interleaved Boost Converter (IBC) is selected in this paper as the power conversion interface of PEMFC for FCEV application. Silicon Carbide (SiC) semiconductors are selected for the purpose to operate at high switching frequency and good thermal performance. Inverse coupled inductors are introduced to achieve a more compact system, which is an important point for automotive applications, and meanwhile, the core losses can be decreased compared with uncoupled inductor. Furthermore, Sliding Mode Control (SMC) is utilized to satisfy the strict control requirements of the coupled inductor currents. Meanwhile, DC bus voltage can be well controlled either under nominal condition or
diagnosis condition. Small sinusoidal perturbation is superposed with the current reference signal and in this way AC perturbation can be added to fuel cell voltage and current. The detected AC components of fuel cell voltage and current are analyzed by Discrete Fourier Transform (DFT) and the impedance spectrums are obtained. Therefore, EIS has been achieved by the proposed DC/DC converter without additional hardware, cost and volume. The proposed process allows real time using of EIS results for embedded diagnosis of PEMFC.
The rest of this paper is organized as follows. In section II, the equivalent circuit model of fuel cell utilized in our study is described. The illustration of the selected converter and the volume analysis of inverse coupled inductor are separately explained in section III. In section IV, firstly, the design process of SMC is analyzed; secondly, the integration between EIS detection and control strategy is demonstrated. Some typical simulation results are illustrated in section V, and several conclusions are drawn in the last section. 2. EQUIVALENT CIRCUIT MODEL OF THE FUEL CELL STACK
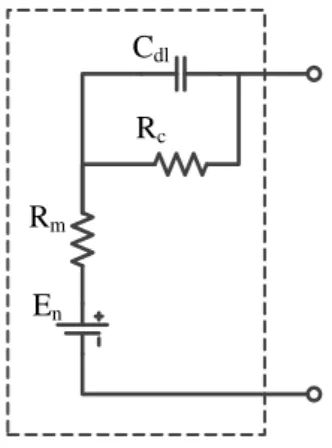
Electrical characteristic of fuel cell can be represented by the equivalent circuit model. The most common equivalent circuit is the Randles circuit proposed by Randles [12]. As presented in Fig.1, membrane resistance Rm is connected in
series with a parallel combination of the double layer capacitor Cdl and the catalyst resistance Rc.
R
mCdl
Rc
En
Fig.1 Randles cell
According to principles described in many references, the resistance Rm stands for the resistance against the proton
transfer through the membrane and water content in the membrane has much influence on proton transfer property. As for the double layer capacitor Cdl, it stands for the
capacitance property in the catalyst layer where electrochemical reactions happen. Of course, the resistance Rc stands for the resistance against the charge transfer around
the catalyst layer. In addition, the Nernst voltage of the fuel cell is defined as [13]. Eo, PH2, PH2O, and PO2 are the Nernst
voltage in standard state, hydrogen partial pressure, water vapor partial pressure and oxygen partial pressure against the standard atmosphere pressure respectively.
2 2 2 0.5
ln
2
H O n o H OP P
RT
E
E
F
P
(1)For this equivalent circuit, the total impedance can be defined as
1
c m dl cR
Z
R
jC R
(2) where ω stands for the angular frequency. According to the Eq.(2), the resistance Zω is equal to (Rm+Rc)approximately when the frequency f is close to zero. 3. THE ANALYSIS OF PROPOSED CONVERTER
In order to reduce the output current ripple of the FC, and then to extend its lifespan [14], an Interleaved Boost Converter (IBC) based on Silicon Carbide (SiC) semiconductors has been introduced in a previous work [15] by providing a high power capability, modularity and improved reliability.
Power inductors are the main magnetics components in DC/DC converter. The total volume of converters is significantly affected by the volume of power inductors. Hence, to reduce the total volume and weight of selected converter furthermore, inverse coupled inductors are introduced in this paper. Fig.2.(a) presents a typical FCEV power system structure. The DC/DC converter, which is connected with PEMFC stack, is studied in this paper and the proposed topology is shown in Fig.2.(b). The cyclic cascade configuration is selected according to [16]. Each two windings in the range of yellow block stand for one inverse coupled inductor. The specifications of electric interface are presented in Table 1. Clearly, high power, high switching frequency and medium DC bus voltage are required.
Table 1. Specifications of power converter
Symbol Parameter Value Unit
Vin Input voltage 70 V
PN Nominal power 21 kW
Vout Output voltage 350 V
fs Switching frequency 100 kHz
A 21kW PEM FCvelocity-9SSL module from Ballard® Company [17] is selected as the input power source. As the inherent characteristics of this specific PEMFC module, the output FC current is high (300A) while the FC voltage is comparatively low (70V). The Randles model is applied in order to simplify the study of proposed converter. A low ripple of the FC current (△iFC) is demanded to extend the
lifespan of the PEMFC.
BATTERY Hydrogen Tank DC/DC Converter PEMFC Stack DC/AC Converter Motor
P E M F C IFC
.
..
..
..
..
..
.
-M -M -M -M -M -M S1 S2 S3 S4 S5 S6 Vout VFC + -+ To DC bus(b). The proposed converter Fig.2. Overview of proposed topology for FCEV application
In this study, the inductors are inversely coupled and constructed by a cyclic cascade structure. In other words, each phase is just coupled with the adjacent phase and on the whole six coupled inductors are needed for our application. Taking the volume, weight, complexity of installation and other factors into consideration, EE magnetic cores are selected.
Due to the inverse coupled structure, DC magnetic fluxes caused by the two windings flow reversely and total DC magnetic flux is thus almost zero inside the core. The core losses mainly depend on the AC magnetic flux, which is a relatively small value due to the low current ripple, thus the volume of inductor can be decreased.
The inductor volume is closely related to inductor value, current RMS value, current ripple level and maximum flux density.
According to [18], the core geometrical constant Kg is a
figure-of-merit that describes the effective electrical size of magnetic cores. Eq.(3) is utilized to determine the minimum core geometrical constant Kgmin of the inverse coupled
inductor core,
2 2 2 1 2 , min_coupled 2 _ cu M M sat L L g sat u cu totL
i
I
I
K
B
K
P
(3)The wire effective resistivity ρcu is 1.724*10-8 Ω·m. The
magnetizing inductance LM is 80*10 -6
H. The maximum magnetizing current iM,sat is 1.75A. The DC component of
each winding’s current, IL1 and IL2, is 50A. The saturation
flux density Bsat is 0.4T. Total copper losses Pcu_tot are 50W.
The winding fill factor Ku is 0.6. Based on the calculation,
Kgmin_coupled is needed to be bigger than 0.00704cm5 and
E31/13/9 core of FORREXCUBE® has been selected. To make a comparison of the inductor volumes, the magnetic core has been selected for the uncoupled inductors. The topology and the specifications of converter are the same as the one proposed in this study. The minimum core geometrical constant Kgmin_uncoupled is obtained by Eq.(4).
2 2 max min_uncoupled cu2 L g sat u L
L
I
K
B
K
R
(4)The inductor value L is 160μH and the maximum inductor current value ILmax is 51.75A. The inductor DC
resistance RL is 10mΩ, which is the same with coupled
inductor for single winding. E55/28/21 core of FORREXCUBE® has been chosen for uncoupled inductor and two cores are needed to be constructed in parallel to satisfy the requirements of minimum core geometrical constant. The volume of half core for the uncoupled inductor is 88cm3 (2*44cm3). The volume of coupled inductor core has been reduced by almost 94%. The total volume and total weight of coupled inductor for the six-phase IBC are separately 61.8cm3 and 156g.
The relationship between number of interleaved phases (N) and minimum magnetic core geometrical constant is presented by Fig.3 (a) and (b). Both uncoupled and coupled inductors are analyzed to make a comparison. Obviously, Kgmin_coupled is much smaller than Kgmin_uncoupled. Additionally,
the minimum core geometric constant decreases while the number of interleaved phases increases with both designs.
(a). Relationship between Kgmin and number of phases
(b). Zoom of Fig.3 (a) Fig.3. The relationship between N and Kgmin 4. THE CONTROL STRATEGY DESIGN PROCESS
4.1 The design of Sliding-Mode Control strategy
A Proportional-Integral (PI) controller is well known and widely applied in industrial application fields to optimize the
4 5 6 7 8 9 10 0 5 10 15 20 25 30 Number of Phases M in im u m m g a n e ti c c o re g e o m e tr ic a l c o n st a n t (c m 5
) Relationship between minimum core geometrical constant Kg and number of phases interleaved
Kgmin uncoupled=f(N),fs=100kHz Kgmin coupled=f(N),fs=100kHz 4 5 6 7 8 9 10 0.005 0.01 0.015 0.02 0.025 0.03 0.035 Number of Phases M in im u m m g a n e ti c c o re g e o m e tr ic a l c o n st a n t (c m 5
) Relationship between minimum core geometrical constant Kg and number of phases interleaved
steady-state performance. Unfortunately, on account of the strongly non-linear characteristic of coupled inductor, classical PI control strategy does not satisfy the requirements, especially when dynamic changes occur to the electric loads. The unifications of inductor currents are strictly required in our study to guarantee the magnetic components operating under non-saturation zone. This requirement is needed to be satisfied whether under static work point or dynamic processes. Further, the operating processes of coupled inductor are strongly related to duty cycle and number of interleaved phases. More interleaved branches can lead to complicated operating process. Meanwhile, duty cycle, which is closely related to load level, can influence the regulating process of inductor currents significantly. Supposing significant differences occurring between inductor currents, magnetic saturation could be introduced. In other words, well controlled inductor currents can lead to desirable performance of magnetic components. The most interesting point of inverse coupled inductor is that the DC magnetic fluxes are almost cancelled inside the core, thus compact structure can be obtained in our proposed topology by the utilization of inversely coupled inductor compared with uncoupled one.
Sliding-Mode Control (SMC), which has been proposed by [19], is theoretically robust to the plant parameter variations, insensitive to disturbance and can achieve a zero steady-state error. More importantly, the design process of SMC depends on the large signal model of DC/DC converter. Its stability is not restricted by variations around operating point, which contributes to an overall improved controller performance.
The sliding surface in our study is defined by the following expression.
_ref
0
_ref
t
Li Li Li Li Li Li
S
I
I
K
I
I
d
(5)In Eq.(5), i and ILi respectively stand for the sequence
number and average current of each inductor. ILi_ref is the
reference current and KLi, which is positive, is a coefficient
that defines the dynamic of convergence to zero of the static error.
The Control-Lyapunov function is used to test whether a system is feedback stabilizable [20]. A characteristic method is applying a Lyapunov candidate function to test the stability of dynamic system.
Hence, ε, which equals to ILi minus ILi_ref, is defined as
the error between actual and desired inductor current. Thus, Eq.(5) can be re-written as
0 t
Li Li
S
K
d
(6)A Control-Lyapunov candidate is presented as Eq.(7), which is positive definite for all ILi_ref≠0, d(ILi_ref)/dt≠0.
2
1
2
V
S
(7)The purpose is to achieve the time derivative to be
0
V
V
g
,
(8)which is globally exponentially stable if V is globally definite.
The convergence dynamic of the sliding surfaces to zero is defined as Eq.(9), which can be proved by Eq.(6), (7) and (8). This control law will guarantee global exponential stability.
Li Li Li
S
S
(9)λLi, the convergence factors, are positive real numbers.
The larger convergence factors are, the faster the system reaches its steady state. However, due to the limitations of the system, it is not possible to increase the value beyond a certain value.
According to the operating process, the state space model of proposed converter can be obtained as described by Eq.(10). The duty cycle of each phase as a function of time, which is presented by Eq.(11), can be achieved based on the equations mentioned previously.
1
1
Li in i o Li Ld
I
L
V
D
V
i
r
dt
(10)
_1
1
i in L Li A o Li i Li ref Li iD t
V
r
I
L
x
V
x
S
I
K
(11)The matrixes [L] and [LA] are separately the inverse
coupled inductor matrix and the similar matrix of its inverse matrix. They are presented as follow. Due to Eq.(11), the control inputs are independent and will not be influenced by the disturbance of loads.
2
0
0
0
2
0
0
0
0
2
0
0
0
0
2
0
0
0
0
2
0
0
0
2
L
M
M
M
L
M
M
L
M
L
M
L
M
M
L
M
M
M
L
1 0 0 0 0 0 2 1 0 0 0 0 0 2 1 0 0 0 0 0 2 1 0 0 0 0 0 2 1 0 0 0 0 0 2 1 0 0 0 0 0 2 A L M L M L L M L M L M L M Combining Eq.(5), Eq.(9) and Eq.(11) together, we can obtain:
LiK
Li
LiK
Li 0td
0
(12) The time derivative of Eq.(12) is
LiK
Li
LiK
Li0
(13)This equation is irrelevant with the topology parameters, which means a high robustness for the controller. The classical tuning method for second-order systems can be used to determine the coefficients KLi and the convergence
factors λLi to achieve the desired performance. 4.2 The integration of EIS with SMC
In consideration of the limited effective volume of FCEV, the integration of EIS functionality in control strategy of converter is a promising technique in purpose of realizing on-line monitoring the state of health of FC [21]. The strategy of EIS integration in SMC consists in injecting the current perturbation Isin around the polarization current IFC as
presented in Fig.4.(b). In Fig.4, a delay (Tdelay) existed
between neighbor phases drive signals (PWM Phase N). This value depends on number of phases (N) and cycle period (Ts). In our case, N and Ts separately equal to 6 and 10us.
Thus, Tdelay can be achieved as (10/6) us.
Fuel Cell Stack
Proposed DC/DC Boost Converter Power Flowing Pass
PI SMC
+
-Vref Vo IL_ref PWM Phase N VFC, IFC ILN (N=1,2,...)
(a). Control strategy at normal operating condition Fuel Cell
Stack
Proposed DC/DC Boost Converter Power Flowing Pass
PI SMC
+
-+
+
Vref Vo Isin IL_ref VFC, IFC ILN (N=1,2,...) PWM Phase N(b). Control strategy at EIS detection condition Fig.4 The strategy of EIS integration in SMC
At nominal condition, DC bus voltage (Vo) of converter
will be compared with the reference voltage (Vref), and then
the difference will be transferred to a PI controller (out loop controller) to obtain the current reference (IL_ref) of each
phase. After that, IL_ref, fuel cell voltage (VFC), fuel cell
current (IFC) and inductor current (IL) of each phase will be
sent into the SMC (inner loop controller). After the
calculation process, PWM signals can be obtained and will be sent to corresponding power MOSFET as drive signal.
On-line detection of EIS based on the proposed DC/DC converter is presented by Fig.5. The process can only be handled when fuel cell stack operates at stable state, which is usually characterized by a steady-state stack voltage and stack temperature [21]. When the EIS monitoring is required, a sinusoidal perturbation will be superimposed to the output signal of PI controller (IL_ref). According to the process of
SMC, the current of each phase will track this reference value. Thus, the sinusoidal perturbation can be superimposed successfully to the fuel cell current. Owing to operate at linear range, the fuel cell voltage will also be perturbed by a sinusoidal signal combined with the same frequency as the current perturbation. Under this condition, the mean values of the fuel cell stack output voltage and current can be obtained separately. These two parameters are essential for the measurement of AC impedance. Meanwhile, benefiting from the high robustness of this control strategy, the output voltage of DC/DC boost converter can still be maintained relatively stable at the required value (<7%).
START
Inject a small sinusoidal perturbation to the inductor current reference IL_ref.
Fuel cell operates under stable state
The sinusoidal perturbations are separately introduced to IFC and VFC.
Mean value sampling both of IFC and VFC.
Apply DFT separately to IFC and VFC.
Achieve Re(ZFC) and Im(ZFC).
Draw Electrochemical Impedance Spectroscopy.
END
No
Yes
Fig.5 The process flow diagram of on-line detection of EIS based on the proposed DC/DC converter
5. THE SIMULATION RESULTS
PLECS, which is a software tool and especially designed for system-level simulations of power electronics, is utilized in our study to verify the proposed EIS monitoring functionality.
The required specifications are obligatory to be achieved both under nominal condition and disturbed condition. Naturally, nominal condition is tested firstly to verify the stability of the control strategy.
DC bus voltage, fuel cell current and inductor currents are separately presented in Fig.6. Obviously, the proposed converter is well controlled both under steady and transient states.
(a). DC bus voltage and inductor currents
(b). Zoom of Fig.6 (a) at steady state
Fig.6. Simulation results for steady and transient states under normal operating condition.
Hereby, in purpose of verifying the proposed detection strategy, the perturbation signal which possess the frequency of 10kHz was injected to the inductor current reference and the results were presented by Fig.7 (a)~(d). Obviously, the sinusoid perturbation has been successfully integrated with the fuel cell current and voltage. To be emphasized, close loop control has been achieved even during the process of perturbation injection. DC bus voltage has been well controlled and stabilized at the required value (Vbus_DC=350V, △Vbus<4%).
(a). DC bus voltage and inductor currents with perturbation
(b). Zoom of Fig.7 (a) at steady state
(c). Fuel cell voltage and current with perturbation
(d). Zoom of Fig.7 (c) at steady state
Fig.7. Simulation results for steady and transient states under perturbed condition.
As analyzed previously, when an AC signal of known amplitude and frequency is sent to the inductor current reference of proposed DC/DC converter, the amplitude responses of the fuel cell stack’s voltage and current can be recorded separately. This process can be repeated at different frequencies, thus, a Nyquist impedance spectrum can be formed by a series of the stack impedances at discrete frequency points to achieve more information about the cell parameters.
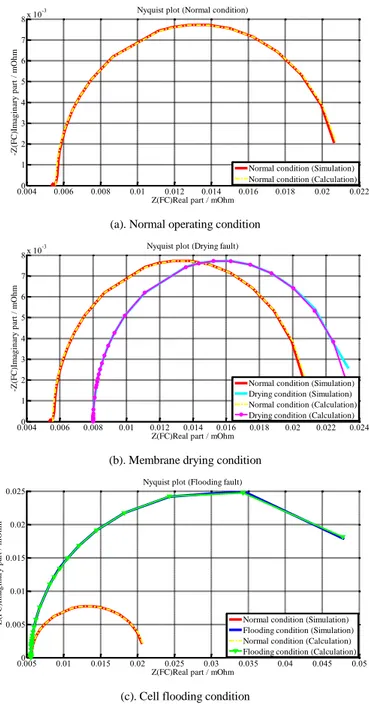
In Fig.8.(a), the curve constructed by yellow points represent theoretical calculations of impedance spectrum at nominal condition. The simulation results are identical with theoretical analyses. The proposed strategy is verified under nominal operating conditions based on Randles model.
In order to verify the proposed detection method, some parameters of fuel cell model are modified to simulate different faults occurring on the fuel cell stack. Water management inside fuel cell stack is essential to avoid breakdown or damage occurred to power source [22]. Different types of fault (flooding or drying) can be indicated by different impedance spectrums as a result of variations of fuel cell model parameters [23]. Therefore, according to visible variation introduced to impedance curves when these faults are brought into existence, EIS is an effective diagnosis tool for these situations. Table 2 presents different fuel cell parameters utilized for different operating states. These parameters are man-set values and just utilized in purpose of verifying the validity of proposed strategy.
Table 2. PEMFC parameters for the assumption of different man-set faults to verify proposed EIS detection functionality
State of Health
(SOH) Rm/mOhms Rc/mOhms Cdl/F
Normal 5.58 15.46 1.37
Drying 8 15.46 1.37
Flooding 5.58 50 1.37
1) Simulating membrane drying (Rm increased)
Drying can be caused if the membrane is not sufficiently hydrated, or the inlet gases are insufficiently humidified. The inlet gases’ temperature is below the fuel cell operating one can be another reason. Drying out can lead to an increase of membrane resistance. Hence, this fault can be detectable by any increase of cell resistance [24].
Rm is replaced by a bigger value to simulate drying fault
occurring to the fuel cell stack. Both theoretical analyses and simulation results are presented in Fig.8.(b). Distinctly, the impedance spectrums achieved by simulation are visibly different from nominal condition. In Nyquist plot, the left intersection of the curve and real axis moves to the right of positive axis which indicates the increase of Rm, or the
occurring of drying fault. The waveform doesn’t change, which means the biggest imaginary value is the same as in nominal condition.
2) Simulating cell flooding (Rc increased)
Flooding, which is one of the most recurrent PEMFC’s faults, is defined as an accumulation of liquid water in the gas channels or electrodes, impeding the access of reactive gases to the active layers, and therefore decreasing the reaction rate [25].
The flooding probability increases the difficulty of mass transport process. The lower the O2 diffusion rate is, the
more severe the flooding will be. Difficult mass transport leads to an arc owing a bigger diameter in Nyquist plot.
Rc is replaced by a bigger value to imitate flooding fault
occurred to fuel cell stack. Both theoretical analyses and simulation results are presented in Fig.8.(c). Obviously, the impedance spectrums obtained by simulation are visibly different from nominal condition. In Nyquist plot, due to the untouched membrane resistance, the left intersections of the
curves and real axis are the same. An arc combined with a bigger diameter is achieved by the flooding conditions.
(a). Normal operating condition
(b). Membrane drying condition
(c). Cell flooding condition
Fig.8. Electrochemical Impedance Spectrums of PEMFC under normal operating condition, drying faults and flooding faults are separately by (a), (b) and (c). EIS, one obtained by simulation results from PLECS, the other obtained by calculation results based on Randles model and parameters in Table 2, are presented to be compared.
Hence, according to the comparison analyses between theoretical and simulated results, the proposed strategy, which focuses on integration of EIS functionality with sliding-mode control on the considered DC/DC power converter, is effective to be applied for monitoring the state of health of a fuel cell stack. Both drying and flooding modes are detectable from the achieved impedance spectrums. On-line diagnosis of the fuel cell stack is realized; meanwhile DC bus voltage is well regulated even during detection procedure. To be emphasized, the proposed on-line diagnosis
0.0040 0.006 0.008 0.01 0.012 0.014 0.016 0.018 0.02 0.022 1 2 3 4 5 6 7 8 x 10 -3
Z(FC)Real part / mOhm
-Z (FC)Im ag in ary p art / mO h m
Nyquist plot (Normal condition)
Normal condition (Simulation) Normal condition (Calculation)
0.0040 0.006 0.008 0.01 0.012 0.014 0.016 0.018 0.02 0.022 0.024 1 2 3 4 5 6 7 8 x 10 -3
Z(FC)Real part / mOhm
-Z (FC)Im ag in ary p art / mO h m
Nyquist plot (Drying fault)
Normal condition (Simulation) Drying condition (Simulation) Normal condition (Calculation) Drying condition (Calculation)
0.0050 0.01 0.015 0.02 0.025 0.03 0.035 0.04 0.045 0.05 0.005 0.01 0.015 0.02 0.025
Z(FC)Real part / mOhm
-Z (FC)Im ag in ary p art / mO h m
Nyquist plot (Flooding fault)
Normal condition (Simulation) Flooding condition (Simulation) Normal condition (Calculation) Flooding condition (Calculation)
approach is accomplished without any additional equipment which is highly attractive for practical FCEV applications due to the limited space inside a vehicle.
6. CONCLUSION
This paper proposes a 21kW six-phase IBC combined with online EIS detection functionality of PEMFC for FCEV applications. The selection of IBC is meaningful for the extension of the FC lifespan. The total volume and weight of the power converter have been reduced significantly due to the selection of SiC semiconductors and inverse coupled inductors. SMC has been selected to satisfy the constrained requirements of current control for coupled inductor. EIS implementation based on proposed DC/DC converter (without any additional devices) has been realized and verified by Randles model in a wide range of frequency. For the next step, firstly, the DC/DC converter proposed in this paper will be realized and tested by experiments on a medium power scale fuel cell system test bench; and then, the proposed EIS detection strategy will also be verified based on existing fuel cell stacks in lab.
7. REFERENCES
[1] Song, S., & Tsiakaras, P. (2006). « Recent progress in direct ethanol proton exchange membrane fuel cells (DE-PEMFCs) ». Applied Catalysis B: Environmental, 63(3), 187-193.
[2] Magne, P., Liu, P., Bilgin, B., & Emadi, A. (2015, June). « Investigation of impact of number of phases in interleaved dc-dc boost converter ». In Transportation Electrification Conference and Expo (ITEC), 2015 IEEE (pp. 1-6). IEEE.
[3] Dang, Z., & Qahouq, J. A. A. (2017). « Permanent-Magnet Coupled Power Inductor for Multiphase DC–DC Power Converters ». IEEE Transactions on Industrial Electronics, 64(3), 1971-1981.
[4] Chen, T. L., & Wu, Y. C. (1992). « An optimal variable structure control with integral compensation for electrohydraulic position servo control systems ». IEEE transactions on industrial electronics, 39(5), 460-463.
[5] Sutharssan, T., Montalvao, D., Chen, Y. K., Wang, W. C., Pisac, C., & Elemara, H. (2017). « A review on prognostics and health monitoring of proton exchange membrane fuel cell ». Renewable and Sustainable Energy Reviews, 75, 440-450.
[6] Niya, S. M. R., & Hoorfar, M. (2013). « Study of proton exchange membrane fuel cells using electrochemical impedance spectroscopy technique–A review ». Journal of Power Sources, 240, 281-293. [7] Hong, P., Xu, L., Jiang, H., Li, J., & Ouyang, M. (2017). « A new
approach to online AC impedance measurement at high frequency of PEM fuel cell stack ». International Journal of Hydrogen Energy, 42(30), 19156-19169.
[8] Depernet, D., Narjiss, A., Gustin, F., Hissel, D., & Péra, M. C. (2016). « Integration of electrochemical impedance spectroscopy functionality in proton exchange membrane fuel cell power converter ». International Journal of Hydrogen Energy, 41(11), 5378-5388.
[9] Narjiss, A., Depernet, D., Candusso, D., Gustin, F., & Hissel, D. (2008). « On-line diagnosis of a PEM Fuel Cell through the PWM converter ». Proceedings of FDFC 2008.
[10] Hinaje, M., Sadli, I., Martin, J. P., Thounthong, P., Raël, S., & Davat, B. (2009). « Online humidification diagnosis of a PEMFC using a static DC–DC converter ». International journal of hydrogen energy, 34(6), 2718-2723.
[11] Bethoux, O., Hilairet, M., & Azib, T. (2009, November). « A new on-line state-of-health monitoring technique dedicated to PEM fuel cell ». In Industrial Electronics, 2009. IECON'09. 35th Annual Conference of IEEE (pp. 2745-2750). IEEE.
[12] Fouquet, N., Doulet, C., Nouillant, C., Dauphin-Tanguy, G., & Ould-Bouamama, B. (2006). « Model based PEM fuel cell state-of-health monitoring via ac impedance measurements ». Journal of Power Sources, 159(2), 905-913.
[13] Larminie, J., Dicks, A., & McDonald, M. S. (2003). Fuel cell systems explained (Vol. 2). Chichester, UK: J. Wiley.
[14] Wahdame, B., Girardot, L., Hissel, D., Harel, F., François, X., Candusso, D., ... & Dumercy, L. (2008, June). « Impact of power converter current ripple on the durability of a fuel cell stack ». In Industrial Electronics, 2008. ISIE 2008. IEEE International Symposium on (pp. 1495-1500). IEEE..
[15] Wang, H., Gaillard, A., & Hissel, D. (2016, October). « 6-Phase Soft-Switching Interleaved Boost Converter Based on SiC Semiconductor for Fuel Cell Vehicles ». In Vehicle Power and Propulsion Conference (VPPC), 2016 IEEE (pp. 1-7). IEEE. [16] Park, I. G., & Kim, S. I. (1997, June). « Modeling and analysis of
multi-interphase transformers for connecting power converters in parallel ». In Power Electronics Specialists Conference, 1997. PESC'97 Record., 28th Annual IEEE (Vol. 2, pp. 1164-1170). IEEE. [17] De Bernardinis, A. (2015, June). « Current-fed inverter topologies
and control strategy applied to modular power fuel cells in transportation applications ». In Transportation Electrification Conference and Expo (ITEC), 2015 IEEE (pp. 1-6). IEEE.
[18] Erickson, R. W., & Maksimovic, D. (2007). Fundamentals of power electronics. Springer Science & Business Media.
[19] Chen, T. L., & Wu, Y. C. (1992). « An optimal variable structure control with integral compensation for electrohydraulic position servo control systems ». IEEE transactions on industrial electronics, 39(5), 460-463.
[20] Freeman, R., & Kokotovic, P. V. (2008). « Robust nonlinear control design: state-space and Lyapunov techniques ». Springer Science & Business Media.
[21] Zheng, Z. (2014). « On line fault diagnosis of PEMFC stacks via on non-model based methods and EIS measurements ».
[22] Li, Y., Pei, P., Wu, Z., Xu, H., Chen, D., & Huang, S. (2017). « Novel approach to determine cathode two-phase-flow pressure drop of proton exchange membrane fuel cell and its application on water management ». Applied Energy, 190, 713-724.
[23] Dijoux, E., Steiner, N. Y., Benne, M., Péra, M. C., & Pérez, B. G. (2017). « A review of fault tolerant control strategies applied to proton exchange membrane fuel cell systems ». Journal of Power Sources, 359, 119-133.
[24] Steiner, N. Y., Hissel, D., Moçotéguy, P., & Candusso, D. (2011). « Diagnosis of polymer electrolyte fuel cells failure modes (flooding & drying out) by neural networks modeling ». International Journal of Hydrogen Energy, 36(4), 3067-3075.
[25] Li, H., Tang, Y., Wang, Z., Shi, Z., Wu, S., Song, D., ... & Liu, Z. (2008). « A review of water flooding issues in the proton exchange membrane fuel cell ». Journal of Power Sources, 178(1), 103-117.