HAL Id: halshs-01431160
https://halshs.archives-ouvertes.fr/halshs-01431160
Preprint submitted on 10 Jan 2017
HAL is a multi-disciplinary open access archive for the deposit and dissemination of sci-entific research documents, whether they are pub-lished or not. The documents may come from teaching and research institutions in France or abroad, or from public or private research centers.
L’archive ouverte pluridisciplinaire HAL, est destinée au dépôt et à la diffusion de documents scientifiques de niveau recherche, publiés ou non, émanant des établissements d’enseignement et de recherche français ou étrangers, des laboratoires publics ou privés.
French fish market
Laurent Gobillon, Wolff Francois Charles
To cite this version:
Laurent Gobillon, Wolff Francois Charles. The local effects of an innovation: Evidence from the French fish market. 2017. �halshs-01431160�
WORKING PAPER N° 2017 – 01
The local effects of an innovation:
Evidence from the French fish market
Laurent Gobillon
François-Charles Wolff
JEL Codes: L11, Q22
Keywords: fish, innovation, product quality, product prices, discontinuity,
difference in differences, synthetic controls, factor models
P
ARIS-
JOURDANS
CIENCESE
CONOMIQUES48, BD JOURDAN – E.N.S. – 75014 PARIS TÉL. : 33(0) 1 43 13 63 00 – FAX : 33 (0) 1 43 13 63 10
www.pse.ens.fr
CENTRE NATIONAL DE LA RECHERCHE SCIENTIFIQUE – ECOLE DES HAUTES ETUDES EN SCIENCES SOCIALES
ÉCOLE DES PONTS PARISTECH – ECOLE NORMALE SUPÉRIEURE
The local effects of an innovation:
Evidence from the French fish market
#
Laurent Gobillon
*and François-Charles Wolff
**Janvier 2017
Abstract
In this paper, we investigate the effect on quality, quantity and prices of an innovative fishing gear introduced for a subsample of vessels on a single wholesale fish market in France. Estimations are conducted using transaction data over the 2009-2011 period during which the innovation was introduced. Using a difference-in-differences approach around the discontinuity, we find that for the treated the innovation has a large effect on quality (29.2 percentage points) and prices (23.2 percentage points). A shift in caught fish species is observed and new targeted species are fished very intensively. We also quantify the treatment effect on the treated market from aggregate market data using factor models and a synthetic control approach. We find a sizable effect of the innovation on market quality which is consistent with non-treated vessels adapting their fishing practices to remain competitive. The innovation has no effect on market quantities and prices.
Keywords: fish, innovation, product quality, product prices, discontinuity, difference in differences, synthetic controls, factor models
JEL Classification: L11, Q22
# We thank Luc Behaghel, Gabriel Fack and Thomas Piketty for their useful comments as well as participants to
the Labour and Public Policy Seminar at the Paris School of Economics, IAAE 2016 Conference in Milan, TEPP Winter School in Aussois and seminars in Toulon and Lyon. We are also grateful to Laurent Baranger, Jean-François Bigot and Pierrick Olivier for giving us access to the data and for very helpful discussions on the introduction of the Danish seine.
* Corresponding author. Paris School of Economics-CNRS, 48 Boulevard Jourdan, 75014 Paris, France, INED,
CEPR and IZA. E-mail: laurent.gobillon@psemail.eu, webpage: http://laurent.gobillon.free.fr/.
** LEMNA, Université de Nantes, BP 52231, Chemin de la Censive du Tertre, 44322 Nantes Cedex, France and
INED, Paris, France. E-mail: francois.wolff@univ-nantes.fr, webpage:
https://sites.google.com/site/francoischarleswolff/home.
1. Introduction
Technology diffusion plays a major role in the development of countries as it improves the productivity and well-being of the population. Consequently, a large effort has been devoted to understanding the mechanisms underlying diffusion especially in the agricultural sector (Foster and Rosenzweig, 2010). At the same time, the exact influence of new technologies on the market is still subject to debate due to an absence of natural and controlled experiments for an adequate assessment of their effect as well as the lack of appropriate data.
In this paper, we evaluate the impact of a new fishing technology subsidized by local public authorities that has been introduced for some vessels on a French wholesale fish market. The aim of this technology is to increase the productivity of newly-equipped vessels while reducing their fishing costs. Sustainability is an important matter since the technology targets some specific species which may be fished too intensively to remain in the long run. We assess the effect of the new technology on fish quality, quantity and selling prices for treated vessels, and more generally for the local market where the technology has been introduced. This evaluation is made possible by the availability of panel data on fish transactions in which vessels are tracked and panel data reporting the aggregate activity on every local fish markets.
The use of a new production technology is usually considered in the literature as an individual choice that depends on education, credit constraints, learning by doing and learning from others (Besley and Case, 1992; Foster and Rosenzweig, 1995; Bandiera and Rasul, 2006; Conley and Udry, 2010). Private entities and governments can influence adoption through extension agents that diffuse information on the new technology (Abdulai and Huffman, 2005, Genius et al., 2014) or through subsidies to purchase the equipment necessary to use the new technology. Here, we consider a natural experiment such that public authorities subsidized a new gear for some specific vessels located in a single fish market and we assess the extent to which this gear improved productivity. Indeed, new fishing gears usually represent a significant investment but they are expected to have a significant effect on revenues.
The impact of a new technology on outcome, productivity and profit is usually difficult to assess in agriculture since there can be a selection of individuals deciding to adopt it that depends on production costs, expected returns and risk. In particular, land soil and climate have an effect on the harvest. Only a very few papers propose a convincing empirical strategy to establish a causal effect. Duflo et al. (2008) establish the rate of returns to fertilizers in Kenya using a controlled experiment with a random allocation of fertilizer use to farmers. Suri (2011) evaluates the distribution of returns to hybrid maize in Kenya using extensive panel data technics.
Fishing offers a different context since producers are not attached to a location contrary to farmers cultivating fields. Vessels can fish everywhere at a reasonable distance from their port, and this
alleviates the concern of unobserved heterogeneity. Nevertheless, each gear is associated to specific expected return and risk, vessels can differ in their equipment, and the experience on gear choice and fishing spots can vary across captain and sailors (Eggert and Tveretas, 2004; Wolff et al., 2013). Moreover, the ability to obtain real-time information on the surrounding markets to determine the best place to land fish can differ across vessels and this information is crucial to sell all the catches at a good price (Jensen, 2007).
When assessing the effect of the innovation on fish quality, quantity and prices for newly equipped vessels, we resort to a discontinuity approach coupled with difference in differences since data follow vessels in a continuous way across time. More precisely, we contrast the changes in outcomes at the time of technology adoption between vessels which benefited from the technology and similar vessels in the same local fish market which did not. This strategy exploits time variations in outcomes and treatment across vessels. It provides estimators robust to both the presence of vessel unobserved heterogeneity that remains constant around the date at which the innovation is introduced and unconstrained time effects. This is a useful feature since the aggregate amount and composition of catches can vary tremendously from day to day.
At the aggregate level, the effect of the innovation on the treated local fish market is evaluated with factor models and the synthetic control approach. These two approaches exploit time variations in outcomes and treatment across local fish markets, and they both take into account heterogeneous time trends across markets. Factor models incorporate several vessel fixed effects interacted with time fixed effects in a linear panel specification (Bai, 2009; Gobillon and Magnac, 2016). The synthetic control approach estimates the treatment effect as the difference in outcome after treatment between the treated local fish market and a weighted average of control local fish markets with similar characteristics and outcomes before treatment (Abadie and Gardeazabal, 2003; Abadie et al., 2010, 2015).
We evaluate the effects on fish quality, quantity and prices of a new fishing gear, the Danish seine, which was used to equip six vessels located in the wholesale fish market of Les Sables d’Olonne in the region of Pays de la Loire on the French Atlantic coast during the year 2010. It is considered that this technology should allow vessels to catch fish of better quality but it would also be very intensive for some specific species. There is a heated public debate around its sustainability and its unfair competitiveness, and newly equipped vessels have been forbidden to fish around the coasts of three surrounding regions: Britany, Aquitaine and Poitou-Charentes (Hamon, 2015). Moreover, there are currently discussions on the opportunity to reduce the net of the new gear to limit its efficiency in the same way it was done in Norway where it is also used.
Estimations are conducted on two datasets. The first one provides information on all transactions of fish lots occurring in Les Sables d’Olonne and three surrounding local fish markets from September
2009 to June 2011. The data report the day during which each transaction occurs, a vessel identifier such that vessels can be tracked across transactions, as well as details on fish lots. The second dataset provides aggregate monthly information for every local fish market in France from July 2009 to June 2011. The data give the proportion of high-quality fish and the fish distribution across species. The analysis is restricted to local fish markets on the Atlantic coast since they form a rather integrated market which is distinct from the few fish markets located on the Mediterranean coast (Gobillon and Wolff, 2016).
Our estimations with transaction data show that the innovation had a large effect on treated vessels at the discontinuity when it was introduced, since it increased their proportion of high-quality fish by 29.2 percentage points and their prices by 23.2 percentage points. The average effect over the whole post-treatment period was slightly smaller for quality, but larger for prices possibly due to an increase of reputation over time. We also find that the composition of caught species was greatly affected, with a large increase in the quantity of fished mackerel, red mullet and whiting. This suggests that the new technology is very intensive in some specific segments of the fish market and it questions its sustainability, especially in the long run if it becomes widespread.
When quantifying the impact of the innovation on the treated market with factor models and a synthetic control approach using data at the fish market level, we find that the treatment effect on market quality is sizable and comprised within the 13.5-18.2 percentage points interval. This range can be contrasted with the counterfactual treatment effect obtained from transaction data under the assumption that there is no spillover of the treated vessels on the non-treated ones, which is found to be lower and around 5.5 percentage points. This suggests that non-treated vessels adapted their fishing practices to remain competitive, for instance by fishing closer to the coast to bring back fresher fish. The estimated treatment effects on market prices and quantity are small and not significant.
The rest of the paper is organized as follows. Section 2 discusses the context in which the new technology was introduced as well as its expected effects. Section 3 presents our two datasets as well as descriptive statistics on our samples. Section 4 explains our econometric approach and Section 5 discusses the results. Finally, Section 6 provides our conclusions.
2. Presentation of the policy, identification strategy and expected effects
2.1. Introduction of the new fishing gear
During the 2000s, the fishing industry in Europe was hit hard by a steep increase in gasoline price. This was particularly the case in France where prices increased by 120% over the 2004-2007 period. Vessel fleets needed to be adapted to the new market conditions and the European Community allowed for a temporary national support. A segment of the fleet could benefit from public subsidies
up to 60% of the costs incurred by the transformation of all or part of the vessels, as long as the energy spending represented at least 30% of production costs and the capacity of the fleet segment would be reduced by 30%. In France, such transformation was designed and conducted by public entities, since the fleet is heavily regulated, to ensure the sustainability of maritime resources.
It is in this context that local authorities in the region of Pays de la Loire on the Atlantic coast decided to experiment with a new fishing technology, the Danish seine, which requires shorter travels and is expected to allow for catches of better quality. The Danish seine was introduced on the fish market located in Les Sables d’Olonne on the Atlantic coast in 2010 whereas it had not been used in France before. For that year, this market was ranked 14th among 40 when considering the volume of traded
fish (4,900 tons), but 7th for the value (24.1 million euros). Six trawlers were temporarily withdrawn
from the local fleet to be equipped with the new technology, while six others were permanently withdrawn to reduce the size and cost of the fleet.1
The Danish seine is a conical net with two long wings and a pocket in the middle used to collect fish. There are long drag lines such that wings can embrace a large area. The seine is hauled thanks to a deck crane installed on the vessel, and the net is moved in a circle around the fish such that it is herded into the pocket. Buoys are used to maintain the seine close to the water surface and seiners target fish species living in midwater that include whiting, mackerel or red mullet. By contrast, trawlers drag large rectangular fish nets most often at the bottom of the sea, and no species is specifically targeted.
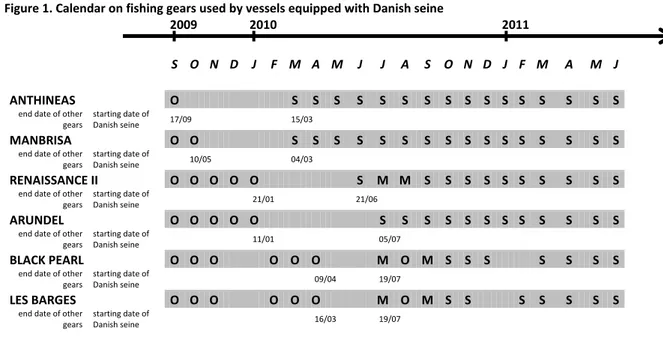
Equipping vessels with a new gear requires time and trawlers needed to stay on land between four and five months. Figure 1 gives the exact time schedule for the six treated trawlers. The transformation of the fleet was conducted in two steps: whereas two vessels began to fish with Danish seine in March 2010, the four others were reintroduced in the fleet between the end of June and the mid of July 2010. Three treated vessels alternate their fishing gear between the Danish seine and other technics (trawl) during the summer. Two of them (Black Pearl and Les Barges) have a specific license to fish white tuna as long as quotas are not exceeded, while the third one (Renaissance II) used temporarily a trawler to fish Norway Lobster. The crew of newly equipped vessels followed a training period in Island where they boarded seiners for two weeks.
[ Insert Figure 1 ]
1 Vessels permanently removed were chosen by local authorities because both the ship and the captain were
old. In particular, ships were built between 1986 and 1991 and they were between 14.4 and 20.8 meters long. Their withdrawal yielded a decrease of 31.6% in tank capacity for the fleet and a decrease of 36.7% in engine power.
2.2. Identification strategy
Our empirical strategy to identify the effect of the new technology at the vessel level consists in comparing the evolution of outcomes between vessels equipped with the new technology, that we label “treated vessels”, and some comparable control vessels.
The fleet segment considered by local authorities to be partially transformed is that of trawlers which are at least 12 meters long. Indeed, these vessels are large enough to accommodate the new gear. The selection criteria for being equipped with the new technology were that vessels had to be built recently (to make the investment profitable over the years) and that the captain agreed to transform his ship.2 The selected vessels have a length between 18 and 25 meters with an average of 20.9
meters. They were built between 1991 and 2005 with an average year of construction which is 2000.7.
Our control group consists in vessels not equipped with the Danish seine that are in the same length bracket. This group is restricted to vessels registered in Les Sables d’Olonne and operating fishing trawls, which is the gear used by seiners before their transformation. There are exactly six vessels verifying the three criteria related to location, size and fishing gear, and we match them one by one with treated vessels in decreasing order of length. We label them as “matched control vessels”. They have a length between 20.6 and 24.9 meters with an average of 22.6 meters, and they were built between 1983 and 1990 with an average of 1987.
There are differences in the dates at which treated and matched control vessels were built. Age can change the profitability of vessels as it influences costs such as fuel consumption and need for repairs. However, there is no technical reason why age should change the quality of catches for a boat of given length when considering a given gear. Quality mostly depends on the fishing gear and fishing locations. If vessels go far away from the coast, they have to freeze their catches and this lowers fish quality. Although the average power of vessels equipped with the Danish seine is initially higher than that of the matched control vessels (465.7 kW versus 408 kW), both treated and non-treated vessels were fishing in nearly the same places in the Bay of Biscane before the introduction of the Danish seine.3 Turning to the fish quantity brought back to the port, it depends on storage
capacities which are mainly determined by vessel length.
2 We are grateful to Laurent Baranger who is in touch with local fishing authorities for providing us with this
crucial information which is not reported in available official documents. The selection process is the result of numerous rounds of discussions before the adoption of the Danish seine that local committees of fisheries (Comité Local des Pêches Maritime des Sables d’Olonne and Comité Régional des Pêches et des Elevages Marins des Pays de la Loire) had with fishermen to propose a fleet adaptation plan to local authorities.
3 Even if there were changes in the trawling technology (with the introduction over time of more selective
trawls leading to catches of better quality), all vessels whatever their age had the possibility to upgrade their equipment by purchasing the most recent trawl engine.
In robustness checks, we define two alternative control groups which consist in all non-treated vessels landing fish in either Les Sables d’Olonne or Vendée. We will refer to them as “control vessels”. Both groups are more heterogeneous with respect to vessel length, with an average of 14.1 meters for Les Sables d’Olonne and 12.2 meters for Vendée.
2.3. Expected effects of the new technology
The introduction of the Danish seine is expected to have several effects on catches. First, caught species should be different since seiners fish in midwater rather than at the bottom of the sea, stay closer to the coast, and drag their net at a slower speed.4 In fact, seiners mainly target slow species
in midwater such as whiting, mackerel or red mullet. Second, the quality of a given fished species should improve since fish is caught alive and in good condition, rather than dead and spoiled. Indeed, fish is not dragged by a trawl net at the bottom of the sea. Moreover, most fishing trips are shorter when using the Danish seine rather than other fishing gears since they are made closer to the coast, so that fish can be brought back fresh without freezing it.
The expected effect of the Danish seine on quantity is difficult to sign. Indeed, the quantity brought back to the port depends on the maritime resources close to the coast for the new species that are fished. Moreover, even if the frequency at which vessels go back to the port increases, some of them may decide to return even if their hold is not full so that they can sell fresher fish. Finally, some vessels may choose fishing spots close to the coast even if available maritime stocks in these spots are rather low because this will allow them to sell fresh fish of high quality.
There are also several expected effects on prices. For treated vessels, prices should increase since quality increases. This effect can be mitigated in the medium run if non-treated vessels improve the quality of their catches, as this would increase the supply of high-quality fish and thus imply a decrease in prices on the corresponding segment of the market. Nevertheless, as more fish are caught close to the coasts, maritime resources and thus vessel supply may decrease in the medium or long run. This would put an upward pressure on prices. Finally, the reputation of treated vessels may improve over time with the diffusion of information on their fish quality and this could attract more buyers, in particular distant ones connected with internet to Les Sables d’Olonne where there are electronic auctions. This can increase the demand and thus the prices on the market at equilibrium.
4 A slower speed prevents to some extent the deformation of the net mesh. This ensures a better selection of
fished species and it can lead to substantial fuel savings.
3. Description of the data
3.1. Data at the transaction level
Data are available at the transaction level for the fish market in Les Sables d’Olonne as well as those in Saint-Gilles Croix-de-Vie, Noirmoutier, and Ile d’Yeu, which are located at a short distance within the same administrative unit, the département of Vendée. They cover the period spanning from September 2009 to June 2011 and each transaction corresponds to a fish lot.5
The sample includes 812,112 transactions with 50.9% of them occurring in Les Sables d’Olonne, 20.6% in Noirmoutier, 17.7% in Saint-Gilles Croix-de-Vie and 10.8% in Ile d’Yeu. Fish quantities are distributed differently across fish markets as the corresponding proportions are respectively 45.5%, 14.6%, 30.2% and 9.7%. We have details on the exact day of the transaction, the identities of seller (i.e. vessel) and buyer, the price, the quantity, the fish species, the size (up to seven categories depending on species), the presentation (whole, gutted, in pieces, etc.) and the quality.
In France, quality is graded following the European Community rule 2406/96 and workers grading fish who operate on fish markets are trained to ensure that grades are consistent over the whole territory. They are given reference documents which include pictures and detail multiple criteria on skin, eyes, gills, peritoneum and flesh, for specific groups of species such as white fish, blue fish and crustaceans. Quality evaluation is conducted using both touch and sight, and there are three grades that can be attributed: poor (B), average (A) and high (E which stands for Extra).
Over the whole period, there are 398,844 transactions in Les Sables d’Olonne such that 14.3% of them involve treated vessels and 15.8% of them involve matched control vessels. Catches of treated and matched control vessels represent respectively 16.8% and 18.0% of sold fish quantity.
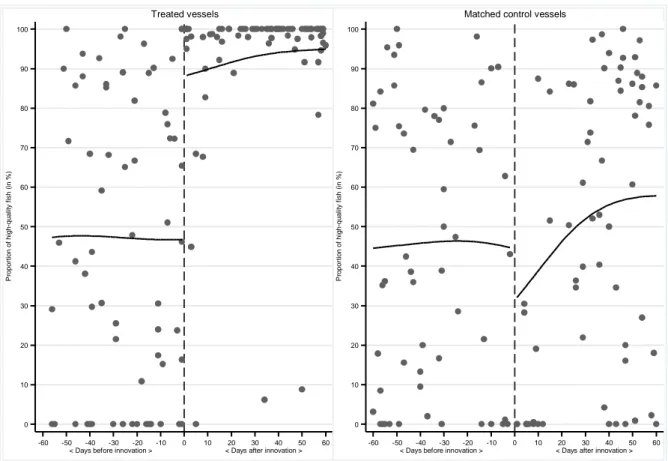
Effects at the discontinuity
We can assess to what extent the Danish seine has influenced fish quality with descriptive statistics at the discontinuity when the innovation was introduced. We plot on the same graph the daily proportion of high-quality fish (grade E) for every treated vessel during the two months before they are landed to get equipped with the new gear and during the two months after they are back to the sea.6 For comparison, we construct a similar graph for matched control vessels. Transactions
occurring during the period when their paired treated vessels are landed to change gear are not
5 The six vessels removed from the fleet are not in the sample because their exit date was before September
2009.
6 After the introduction of the Danish seine, transactions involving fish caught with another gear are excluded
from these computations since we are interested in the effect of the new technology.
taken into account.7 In each graph, we represent non-parametric trends before and after the
innovation obtained from local polynomial regressions.
Figure 2 shows that for treated vessels, the daily proportion of high-quality fish is around 50% before the treatment date. There is then a very large positive jump of 30% at the treatment date and the proportion increases afterwards to reach 95%. For matched control vessels, the daily proportion of high-quality fish is around 45% before the treatment date and it experiences a negative jump of 15% at the treatment date before increasing to reach 60% after two months. Overall, the sharp contrast between treated and matched control vessels is highly suggestive of a large effect of the Danish seine on fish quality. It is also suggestive of a spillover effect with matched control vessels increasing their fish quality over time after the new fishing gear is introduced. Given the time period that is considered, another possible mechanism is that, after the innovation is introduced, treated and matched control vessels turn to different fish species and this may affect their average quality. Indeed, winter is over and fish get closer to the coast so that both treated and matched control vessels may make shorter trips after treatment. This could increase to some extent their fish quality.
[ Insert Figure 2 ]
To deal with composition effects, we then construct a similar graph for each of the five main species fished by treated vessels, as well as a residual category labeled “others”. We assess whether there is a jump in the proportion of high-quality fish at the treatment date for treated vessels (but not for matched control vessels) in the case of each species.8 Figure A1 in Appendix shows that it is the case
for mackerel, red mullet, whiting and fish classified in the “others” category. By contrast, we do not observe any jump in the quality of cuttlefish and squid for treated vessels. These species can hardly be damaged and are already of high quality before treatment.
We also consider similar graphs for prices per kilogram.9 Interestingly, Figure A2 in Appendix shows
that neither treated vessels nor matched control vessels experience a jump in prices at the treatment date. However, it is possible to check that this absence of jump is due to a composition effect by repeating the same exercise for the five main species fished by treated vessels and the “others” category. Indeed, for treated vessels, we find a large positive jump of more than five euros for
7 This restriction is made to avoid differences in quality between treated and matched control vessels that are
related to the period at which fish is caught. It leads to the deletion of 15,016 transactions.
8 The five selected species are those with the largest contribution to total quantity fished by treated vessels
over the period. By decreasing order of importance, these species are mackerel (340.3 tons), red mullet (268.1 tons), whiting (224.2 tons), squid (177.8 tons) and cuttlefish (140.8 tons). We exclude albacore (205.7 tons) because tuna catches are highly seasonal and require specific permits.
9 Note that we do not conduct a similar analysis for quantities as it would not make much sense. Indeed, the
quantity is that involved in a given transaction and it does not correspond to the quantity of fish caught by a vessel over a given period. In particular, a vessel could sell many small fish lots or a single large fish lot for a given total quantity of fish. We rather investigate below how the daily quantity of caught fish varies after the introduction of the innovation for treated and matched control vessels.
squids, and smaller positive jumps for mackerel, red mullet and whiting as shown by Figure A3 in Appendix. The jump is close to zero for cuttlefish and negative for the “others” category. When pooling all the species, the negative and positive jumps cancel each other. By contrast, for matched control vessels, there is a positive jump for squid which is smaller than for treated vessels, and no jump for all the other species.
Effects over the whole period
We then assess whether there is a difference in the evolution of fish quality between treated and matched control vessels over the whole period spanning from March 2009 to June 2011. Panel A of Table 1 reports, for both the treated and matched control vessels, the proportion of high-quality fish when pooling all species and when considering each species separately, before and after treatment. The figures show for treated vessels that the proportion of high-quality fish experiences a large increase of 44.3 percentage points after the introduction of the innovation. The difference in the evolution of this proportion between treated and matched control vessels is smaller as it takes a value of 27.7 percentage points. This can be explained by an overall improvement of fish quality over time for all vessels.
[ Insert Table 1 ]
There is some heterogeneity in the evolution of quality across species since, for treated vessels, the increase in the proportion of high-quality fish is very large and above 50 percentage points for mackerel (69.1 pp), whiting (59.5 pp) and the “others” category (53.1 pp). It is smaller for red mullet and squid at 28.2 and 9.8 percentage points, respectively, and very small for cuttlefish at 3.7 percentage points. For every species, the difference in the evolution of quality between treated and matched control vessels is smaller than the evolution for treated vessels, and this points again at an overall increase in the quality of caught fish. This difference remains above 20 percentage points for mackerel (27.5 pp), whiting (47.7 pp) and the “others” category (31.6 pp), it is smaller at 17.7 percentage points for red mullet and close to zero for squid (4.3 pp) and cuttlefish (-2.0 pp).
Panel B of Table 1 reports descriptive statistics on the daily quantity of sold fish before and after the introduction of the innovation. It shows that the use of Danish seine is very intensive for the three species mackerel, red mullet and whiting since, on average, less than 0.15 ton of each were fished daily before the introduction of the new technology but more than 1.2 tons are fished daily afterwards (even more than 1.9 tons for mackerel). Interestingly, there are also increases in the sales of these three species for matched control vessels but they are much smaller. The difference in differences between the treated and matched control vessels is as high as 1.4 tons per day for red mullet, 1.0 tons per day for mackerel and 0.9 tons per day for whiting. It is smaller for squid at 0.2 ton per day and it is even negative for cuttlefish at -0.8 ton per day. Interestingly, there is a large
decrease in the catches of other species for treated vessels of -3.4 tons per day whereas there is a large increase for matched control vessels of 3.4 tons per day. As a consequence, there is an increase of the total quantity for treated vessels that is rather small at 0.7 ton per day, but a much larger one for non-treated vessels at 4.1 tons per day.
Panel C of Table 1 shows that there are very important changes in the composition of species fished by treated vessels after the innovation is introduced. By contrast, fish composition remains stable for matched control vessels. In particular, the difference in the proportion of red mullet between treated and matched control vessels increases by 17.1 percentage points, whereas the increase is 12.9 percentage points for mackerel and 12.3 percentage points for whiting.
Finally, we assess to what extent fish caught by treated vessels are better valued on the market after the innovation is introduced. As shown in Panel D of Table 1, the price per kilogram increases for the five main species fished by treated vessels. The increase is the largest for squid at 2.7 euros (+67%) but it also reaches 1.4 euros (+21%) for red mullet. It is smaller for the other species, but these species are also less expensive. Their price increase in percentage points, rather than in level, is non-negligible and sometimes even very large. Indeed, the increase is 0.8 euros (+26%) for cuttlefish, 0.7 euro (+115%) for mackerel and 0.3 euro (+19%) for whiting. For each of the five main species, the increase in prices for treated vessels is larger than the change in prices for matched control vessels. By contrast, for the “others” category, there is a slight decrease in prices that occurs for treated vessels and, to a lesser extent, for matched control vessels. This may be due to some changes in the composition of species caught by treated vessels within that category.
3.2. Data at the fish market level
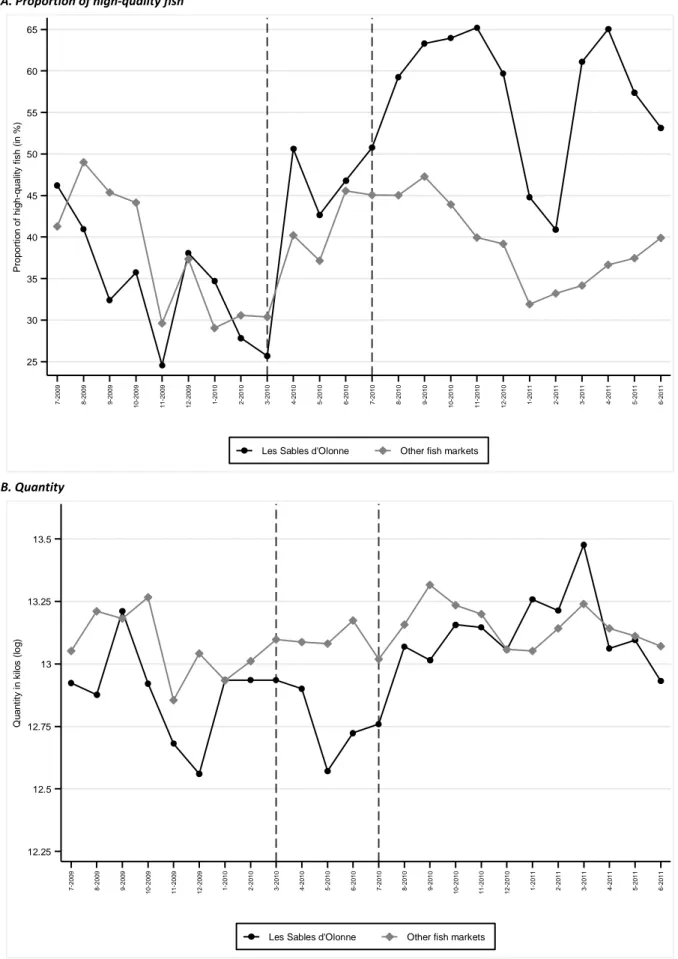
We also evaluate the overall effect of the innovation in Les Sables d’Olonne using an aggregate dataset that spans from July 2009 to June 2011, in which the observation unit is a fish market in a given month. In 2010, there were 40 fish markets in France among which 34 were localized on the Atlantic coast. As there are sizable differences in prices and species between the Atlantic and Mediterranean coasts (Gobillon and Wolff, 2016), we limit the sample to fish markets on the Atlantic coast. Specifically, we consider the 31 fish markets for which there are transactions every month for the five main species during the period and this sample includes the treated market of Les Sables d’Olonne. Data contain information on the overall fish quantity involved in transactions on the fish market, its market value, composition by species, and the proportion of high-quality fish. Fish price per kilogram is computed as the ratio between value and quantity.
Figure 3A represents the proportions of high-quality fish for Les Sables d’Olonne and the other fish markets on the Atlantic Coast. These proportions are rather similar before the innovation is introduced. The gap in quality is for instance at most 5 percentage points between November 2009
and March 2010. By contrast, quality in the treated market becomes much larger after the innovation is introduced. There is a sizable difference in the proportion of high-quality fish with other markets every month over the period after treatment. From July to November 2010, this difference increases from 5.7 to 25.3 percentage points and then decreases to around 10 percentage points. It then climbs again to reach 28 percentage points in March 2011 and decreases again. These variations in the quality difference could be related to seasonality effects such that the composition of caught species varies over time. In particular, seiners target specific species which may not be available to the same extent every month.
[ Insert Figure 3 ]
Interestingly, Figure 3B shows that the fish quantity sold at Les Sables d’Olonne is at the average level of other markets before the innovation is introduced. As expected, it decreases when some vessels are withdrawn from the fleet to be equipped with the new gear, but it then catches up with other fish markets at levels similar to those before the introduction of the innovation. This occurs whereas the fleet in Les Sables d’Olonne involves fewer vessels. As shown in Figure A4 in Appendix, this is mostly due to treated vessels catching more fish, but also to a lesser extent to an increase in quantity for matched control vessels. Finally, Figure A5 in Appendix shows that neither Les Sables d’Olonne nor the other fish markets experience a change in the trend of average prices per kilogram after the innovation is introduced.
4. Empirical strategy
We now present our methodology to quantify the effects of the introduction of the new technology. We first rely on a discontinuity analysis coupled with difference in differences at the transaction level to estimate the treatment effect on the treated. Identification relies on the comparison between treated and matched control vessels of the evolutions of fish quality and prices around the time at which the innovation is introduced. We then perform an evaluation using market level data to quantify the overall effects of treatment on the treated market. This additional exercise is of interest because there can be spillover effects from the treated to the non-treated vessels such that the aggregate treatment effects at the market level are large. The evolutions of fish quality, quantity and prices on the treated market are compared with those on other markets while taking into account flexible forms of unobserved heterogeneity with factor models and a synthetic control approach.
4.1. Estimation strategy using micro data
At the micro level, we assess whether the introduction of the Danish seine has a positive effect on quality and prices of fish lots. We present our approach for quality, but that for prices is similar. We first investigate whether there is an increase in the probability of fish lots to be of high quality just
after newly equipped vessels use the new technology. We consider only transactions occurring within two months before the vessels are landed to change their gear and within two months after they are back into water to fish.
Importantly, our setting is not a standard regression discontinuity design because the distribution of covariates is likely to be different before and after the introduction of the new technology. Indeed, the composition of fish in terms of species and characteristics varies over time at high frequency depending on daily conditions. In that case, it is not appropriate to use local polynomial regressions as the estimated treatment effect is biased when the expected values of covariates on both sides of the discontinuity are different (Imbens and Lemieux, 2008; Calonica et al., 2016). As a benchmark, we thus rather consider panel linear specifications involving a parametric time trend and fish characteristics to be estimated from the subsample of treated vessels. In order to better control for time effects, we then estimate difference-in-differences specifications at the discontinuity from the subsample of both treated and matched control vessels.
Discontinuity analysis using the subsample of treated vessels
We denote by 𝐸𝑖𝑗𝑡 the dummy taking the value one if the fish lot 𝑖 sold by vessel 𝑗 at time 𝑡 is of high
quality (and zero otherwise). We consider a linear probability model and our first specification is:
𝐸𝑖𝑗𝑡= 𝛿𝕝�𝑡≥𝑡̅𝑗�+ 𝑋𝑖𝜃 + 𝑓µ(𝑡) + 𝑢𝑗+ 𝜀𝑖𝑗𝑡 (1)
where 𝑡̅𝑗 is the first day at which vessel 𝑗 is able to use the Danish seine, 𝕝�𝑡≥𝑡̅𝑗� is a dummy variable
taking the value one if the day of transaction occurs after the innovation is introduced for the vessel making the transaction (and zero otherwise), 𝑋𝑖 is a set of fish characteristics (species, size and
presentation dummies), 𝑓µ(𝑡) is a parametric function of time that we consider to be a cubic time
trend,10 and 𝑢
𝑗 is a vessel fixed effect. Note that this specification ignores the fact that two vessels
equipped with the Danish seine keep using their previous gear during some specific time periods to catch mostly white tuna or Norway lobster. This simplification is rather innocuous because 97.3% of catches are made with the Danish seine after the vessels are equipped.11
Our parameter of interest δ measures the effect of being equipped with the Danish seine on fish quality. This effect is measured as the jump around the cubic time trend. Identification relies on the fact that vessel unobserved effects do not vary around the discontinuity, which is credible since the
10 Time is measured as the number of days since the beginning of the four-month window centered on the
discontinuity which is specific to each vessel. When studying prices, we also include in the specification fixed effects for the days of the week since the demand for fish is expected to vary during the week.
11 This is confirmed with robustness checks of our results available upon request.
boat engine, the captain and the crew remain the same after boats equipped with the Danish seine are back into water. We also rely on a continuity argument since the effect of time on quality is parametrized to be smoothed and the estimated effect of Danish seine is measured as a deviation from the time trend.
Difference in differences at the discontinuity
We then try to better control for time effects by using difference-in-differences at the discontinuity. We assess whether our results are robust when estimating the treatment effect as the difference in differences in the proportion of high-quality fish between treated and matched control vessels. For that purpose, we add to our sample the six matched control vessels that are similar to treated vessels and never use the Danish seine because they have not been equipped with this fishing gear. Remember that a control vessel is assigned to each treated vessel according to length. We consider for a given control vessel that the period after innovation is exactly the same as the one of the treated vessel to which it is matched, even if it does not receive treatment. We then estimate the following specification:
𝐸𝑖𝑗𝑡 = 𝛿𝕝{𝑗∈𝛺}𝕝�𝑡≥𝑡̅𝑗�+ 𝛾𝕝�𝑡≥𝑡̅𝑗�+ 𝑋𝑖𝜃 + 𝑓µ(𝑡) + 𝑢𝑗+ 𝜀𝑖𝑗𝑡 (2)
where 𝛺 denotes the set of treated vessels and 𝕝{𝑗∈𝛺} is a dummy that takes the value one if vessel 𝑗 is treated (and zero otherwise). Parameter 𝛾 captures the average post-treatment time effect while simultaneously controlling for the cubic time trend, and parameter 𝛿 now captures the difference in evolutions of fish quality between treated and matched control vessels when the innovation is introduced.
Note that our parameter of interest is the treatment effect on the treated only if there are no spillovers of the treatment on matched control vessels. Otherwise it measures the difference in the effect of innovation on quality between treated and matched control vessels. As matched control vessels may try to increase their fish quality in the post-treatment period to remain competitive, the estimated effect is likely to be a lower bound on the treatment effect on the treated.12
4.2. Estimation strategy using aggregate data
We also quantify the overall effect of the introduction of the Danish seine on the treated fish market located in Les Sables d’Olonne by contrasting the evolution of quality after the introduction of the innovation between the treated market and other markets. We begin our analysis with a standard
12 For instance, matched control vessels may try to improve the quality of their catches by making shorter
fishing trips as this allows them to unload fresher fish.
difference-in-differences approach that is valid under the assumption that the evolution for the treated market in the absence of the technological innovation would be the same as the evolution for the non-treated markets. As this assumption might be violated, we then turn to more general specifications that allow for heterogeneity in time trends across markets and estimate factor models involving a dummy for treatment. Nevertheless, estimates are based on extrapolation when the characteristics of the treated market are not in the support of control markets. We therefore confront our results with those obtained by interpolation when using the synthetic control method. We construct a synthetic market as a weighted average of control markets, and contrast the evolutions of quality after treatment between the treated and synthetic control markets.
Difference in differences
We first present the difference-in-differences approach that will be used to obtain first estimates of the treatment effect. Our data consist in a balanced panel of 𝑁 = 31 markets (including Les Sables d’Olonne) and 𝑇 = 24 months. The proportion of high-quality fish in market 𝑖 at month 𝑡 is denoted 𝑌𝑖𝑡 and the treated market is indexed by 𝑖 = 1. The specification is given by:
𝑌𝑖𝑡 = 𝛿𝕝{𝑖=1}𝕝{𝑡≥𝑡̅}+ 𝑍𝑖𝑡𝛽 + 𝜐𝑡+ 𝑢𝑖+ 𝜀𝑖𝑡 (3)
where 𝑡̅ is the month during which the new fishing technology is first introduced (ie. March 2011), 𝕝{𝑖=1} is a dummy for Les Sables d’Olonne (ie. the treated market), 𝕝{𝑡≥𝑡̅} is a dummy for the date
being post treatment, 𝛿 is the treatment effect, 𝑍𝑖𝑡 are some explanatory variables (in practice, the
shares of every fish species in total quantity sold on the market), 𝜐𝑡 is a month fixed effect, 𝑢𝑖 is a
market fixed effect and 𝜀𝑖𝑡 is a residual. This specification allows for a correlation between market
unobserved effects and treatment, and estimations are thus robust to the selection for treatment based on additive time-invariant local factors affecting quality. Nevertheless, selection may rather occur depending on local trends that can be heterogeneous across markets.
Factor models
We thus turn to a more general specification such that the effects of local factors depend on time in a very general way. Indeed, specification (3) can be augmented with interactions between time fixed effects and market fixed effects such that:
where 𝐹𝑡 is a 𝐾 × 1 vector of month fixed effects and 𝛬𝑖 is a 𝐾 × 1 vector of market fixed effects.
This specification contains not only market fixed effects 𝑢𝑖, but also 𝐾 series of interactive terms
involving market and month fixed effects which may be correlated with treatment. When rewriting the model in first difference, it can be seen that the specification allows for time-specific effects of several unspecified local factors on the evolution of fish quality. Specification (4) can be estimated with least squares provided that some constraints are imposed on month and market fixed effects to ensure identification (Bai, 2009).
Synthetic controls
We also apply the synthetic controls method by computing the treatment effect as the difference in post-treatment quality between the treated market and a synthetic control market with similar characteristics and pre-treatment quality. This synthetic market is constructed as a weighted average of other markets that are used as control markets (Abadie and Gardeazabal, 2003; Abadie et al., 2010). Weights are comprised in the unit interval and the treatment effect is thus estimated using an interpolation of control markets. The synthetic control approach can be contrasted with factor models which allow for extrapolation. In case of support issues, results obtained with synthetic controls can differ from those obtained with factor models (see Gobillon and Magnac, 2016, for a discussion).
More precisely, denote by 𝑍𝑖 = (𝑌𝑖1, … , 𝑌𝑖𝑡̅−1, 𝑋𝑖1, … , 𝑋𝑖𝑇)′ the set of pre-treatment qualities,
measured by the proportions of high-quality fish at every date before treatment, and all the realizations of explanatory variables at all dates. The synthetic controls method consists in solving the following minimization program:
min𝜔𝑗�𝜔𝑗≥0,∑𝑁 𝜔𝑗=1
𝑗=2 �∑ 𝜔𝑗
𝑁
𝑗=2 𝑍𝑗− 𝑍𝑖�′𝑊�∑𝑗=2𝑁 𝜔𝑗𝑍𝑗− 𝑍𝑖� (5)
where 𝑊 is a symmetric positive matrix. This program leads to the choice of weights 𝜔𝑗 that should
be attributed to control markets to obtain a synthetic control market which is similar to the treated market in terms of pre-treatment quality and realizations of explanatory variables at all dates. The matrix 𝑊 is used to fix the respective influence of pre-treatment quality and realizations of explanatory variables at all dates in determining the weights.13 Denoting the estimated weights by
𝜔�𝑗, an estimator of the treatment effect is given by:
13 In our application, the vector 𝑍
𝑖 contains 8 values for the pre-treatment quality and 144 values for the
proportions of our five main species and the “others” category at all dates. Hence, matrix 𝑊 is of dimension 152 x 152. It is fixed such that the contributions of pre-treatment quality and composition by species are respectively 80% and 20% when selecting weights. There proportions were chosen such that fish composition
𝜃� =𝑇−𝑡̅+11 ∑ �∑𝑇𝑡=𝑡̅ 𝑁𝑗=2𝜔�𝑗𝑌𝑗𝑡− 𝑌1𝑡� (6)
A test of nullity of the treatment effect at finite distance can be conducted with a Placebo experiment in which each market is alternatively considered to be fictitiously the treated market (although in reality no treatment is applied) and the treatment effect for that market is computed using the synthetic control approach (see Abadie et al., 2010). This experiment provides a distribution of the treatment effect and one can assess whether the estimate obtained for Les Sables d’Olonne is in the upper right tail of this distribution.
5. Results
5.1. The effect of the innovation on quality for treated vessels
We now discuss the results of our discontinuity analysis used to quantify the effect of the innovation on fish quality. We first focus on treated vessels only, and the effect is identified as the jump in the proportion of high-quality fish for these vessels when the innovation is introduced. As shown in panel A of Table 2, when only a cubic daily trend is introduced as a control, being equipped with the Danish Seine increases the proportion of high-quality fish by 35.2 percentage points for treated vessels (column 1). When additionally taking into account fish characteristics, the estimated effect remains rather stable at 33.3 percentage points (column 2). When also introducing vessel fixed effects, the estimated effect is slightly higher at 44.9 percentage points (column 3).
[ Insert Table 2 ]
We then resort to difference in differences at the discontinuity and conduct the estimations on a subsample that includes both the treated and matched control vessels. The treatment effect is now identified as the difference in jump in the proportions of high-quality fish between treated and matched control vessels. As shown in panel B of Table 2, the estimated treatment effect is of the same magnitude as when considering treated vessels only. It ranges from 42.9 percentage points when considering a cubic daily trend only in the set of control terms (column 1) to 29.2 percentage points when also including fish characteristics and vessel fixed effects (column 3). Interestingly, in column 2 where we control for both the cubic daily trend and fish characteristics, the dummy for being a treated vessel has an estimated effect which is small at -5.3 percentage points. Hence, the
has a sizable influence but it is still possible to approximate fish quality before treatment with that of the synthetic control market. The chosen matrix 𝑊 is diagonal with elements equal to .8/8=.1 for pre-treatment quality values and .2/144=.0014 for values of composition variables. We will also apply the synthetic control approach while omitting composition effects. In that case, matrix 𝑊 is of dimensions 8 x 8 and it is fixed to be the identity matrix.
treated and matched control vessels would catch fish of rather similar quality in the absence of treatment, once time and composition effects have been taken into account.
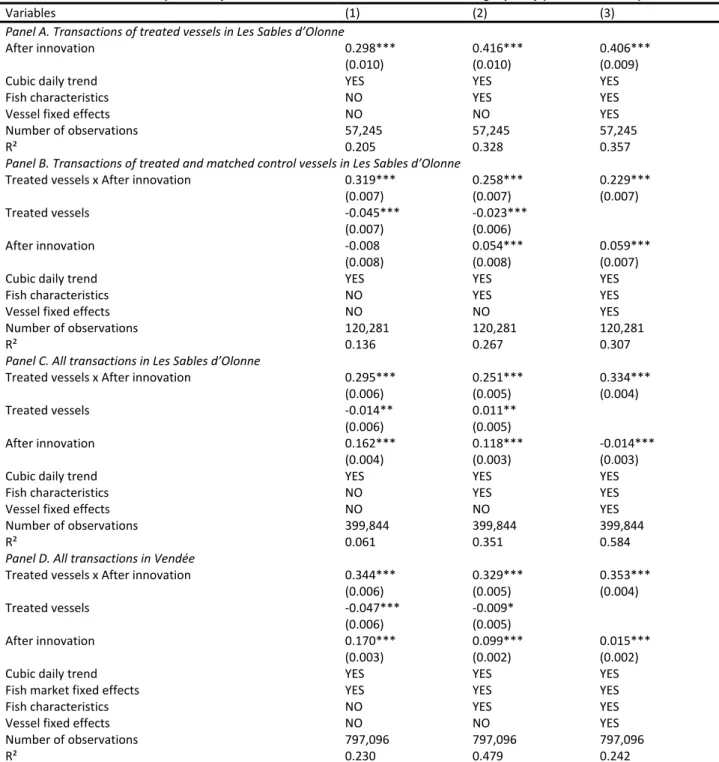
To assess the effect of the new technology in the longer run, we then estimate the treatment effect over the whole period which spans from September 2009 to June 2011 using the same specifications. Results reported in Table 3 show that, when considering the subsample of treated vessels only (panel A), the estimated treatment effect is of the same order of magnitude as at the discontinuity and it is stable across specifications. It amounts to 40.6 percentage points when all control terms are included (column 3). As before, matched control vessels are then added to the sample and the treatment effect is re-estimated (panel B). This time, it turns out to be smaller than when considering treated vessels only, but it remains sizable and it amounts to 22.9 percentage points when all the control terms are included in the specification (column 3). Possible explanations for the decrease in the treatment effect two months after the introduction of the innovation are a decrease in fish stocks close to the coast which forces treated vessels to go further to catch fish and/or a change in the fishing behavior of matched control vessels that may fish closer to bring back fresher fish.
[ Insert Table 3 ]
As a robustness check, we change the control group by considering alternatively all the non-treated vessels in Les Sables d’Olonne (panel C) and all the vessels in Vendée (panel D). We cannot impute a treatment date for control vessels that are not matched with treated vessels in the same way we did for matched ones. For those vessels, we choose to set that date to March 1, 2010 because the treated vessels which are the first to use the Danish seine do so in early March. When all the vessels in Les Sables d’Olonne are considered, the sample size more than triple but the estimated treatment effect remains sizable and even larger than before. It reaches 33.4 percentage points when all the control terms are included in the specification (column 3). Including all the vessels in Vendée makes the sample more than six times larger than when considering only treated and matched control vessels. Again, the estimated treatment effect remains stable and it reaches 35.3 percentage points (column 3). For all the specifications that include a dummy for being a treated vessel, the estimated coefficient of that dummy is positive or negative and sometimes significant, but always very small. This means that the pre-treatment quality is similar for treated and matched control vessels.
We also ran regressions similar to those reported in Table 3 for each of the five main fish species and the “others” category separately. Results obtained when including all the control terms (cubic daily trend, fish characteristics and vessel fixed effects) in the specification are reported Table A1 in Appendix. They are consistent with descriptive statistics. When considering treated vessels only (panel A), the innovation has no significant effect for cuttlefish and squid, a medium effect for red mullet at 13.3 percentage points, a large effect for whiting at 43.5 percentage points, and very large effects for mackerel and the “others” category at 56.6 and 53.3 percentage points, respectively.
When adding matched control vessels to the sample and using a difference-in-differences approach, there are changes in the size of estimated treatment effects. These variations occur because we now contrast treated vessels with matched control ones, and there are time changes in quality after treatment for matched control vessels that can be due to spillovers from treated to matched control vessels on top of the continuous daily time trend. In particular, the estimated treatment effects are now around 40 percentage points for mackerel (42.4pp) and whiting (46.2pp), around 30 percentage points for red mullet (30.5pp) and a bit lower for the “others” category (25.4pp). The estimated effects for cuttlefish and squid are now significant but small, taking the values of -3.2 and +7.1 percentage points respectively. There are changes in the estimated treatment effects again when including in the sample all the vessels in Les Sables d’Olonne (panel C) or all the vessels in Vendée (panel D), but results remain qualitatively similar.
Overall, our results suggest that control vessels – in particular those matched with treated ones – may have changed their fishing practice after the introduction of the innovation, for instance by shortening their trips to bring back fresher fish.14
5.2. The effect of the innovation on prices for treated vessels
We now present our estimation results when evaluating the effect of the innovation on prices. Using our discontinuity strategy, we first quantify the treatment effect as the jump in the price per kilogram for treated vessels when the innovation is introduced, while controlling for vessel fixed effects and a cubic daily trend, as well as fixed effects for the day of the week to take into account daily variations in supply and demand during the week.
Results reported in Panel A of Table 4 show that the effect is large at 100*[exp(0.389)-1]=47.6 percentage points (column 1).15 Part of this effect is due to an increase in quality. When adding to
the specification the observed quality, measured with a dummy for the fish to be of high quality, the estimated treatment effect on prices decreases by 23.4% to reach 38.3 percentage points (column 2). This remaining effect can be explained to some extent by an increase in unobserved quality for treated vessels since there are only three grades for quality and the high-quality category remains broad.16 In particular, some high-quality fish lots sold by treated and non-treated vessels may differ
14 In our regressions, we take into account time-invariant unobserved vessel characteristics through vessel fixed
effects, but not time variations in unobserved vessel characteristics that may occur because of changes in fishing practices. As a consequence, differences in time variations between treated and control vessels are captured by the treatment effect.
15 Subsequent figures are computed using the same formula.
16 Since there are three grades for quality (high, average and poor), we also estimated an alternative
specification with two dummies for quality (high and average) as controls rather than only one dummy for the high-quality grade. The estimated effect of the innovation remains close at 36.1 percentage points, instead of 38.3 percentage points. When considering alternatively interactive terms between the high-quality dummy and species, we obtain an estimated effect of the innovation a bit smaller at 29.8 percentage points.
in unobserved quality because treated vessels may bring back fresher fish as they fish closer to the shore and make shorter trips than non-treated ones.17 Some dimensions of unobserved quality are
partly captured by the size of fish lots since more valuable fish are often sold in smaller lots. When introducing in the specification the fish quantity involved in the transaction, the treatment effect on the treated decreases again and reaches a value of 28.5 percentage points (column 3).18
[ Insert Table 4 ]
We can assess whether characteristics of the market can explain this effect. In particular, treated vessels may sell to buyers which propensity to pay for very fine fish is larger than that of buyers involved in transactions with non-treated vessels. When replacing vessel fixed effects with buyer-seller fixed effects to control for specific matches between buyer-sellers and buyers (see Gobillon et al., 2016, for details on this procedure), the treatment effect on the treated decreases to 24.7 percentage points (column 4). Other market characteristics include the local supply and demand that we proxy respectively with total fish quantity and total number of buyers involved in transactions during the day in Les Sables d’Olonne. When adding these two variables to the specification, the treatment effect on the treated decreases to 22.9 percentage points (column 5). Moreover, the market variables have the expected effect since the price per kilogram on the market decreases with the total quantity of the day (ie. supply) but it increases with the total number of buyers of the day (ie. demand).
The remaining treatment effect could be due to changes in unobserved local conditions after treatment whether they concern fish quality or market structure, as these changes would be captured by the dummy for fishing with Danish seine after the innovation is introduced. To take them into account, we couple again our discontinuity analysis with a difference-in-differences approach conducted on the subsample including both the treated and matched control vessels. Panel B of Table 4 shows that the treatment effect on the treated when considering a cubic daily trend, fixed effects for the day of the week and vessel fixed effects in the specification is only 23.2 percentage points (column 1) compared to 47.6 in our discontinuity analysis involving only the treated vessels. In the case of our full specification that also involves a dummy for high quality, fish quantity of the lot, buyer-vessel match effects and market characteristics, the treatment effect on the treated in only
17 This mechanism cannot be investigated since our dataset does not contain any information on the date and
time at which vessels leave the harbor when they go to fish. Considering the difference between two successive transaction dates for a given vessel would lead to unreasonable approximations as vessels often wait before going back to fish after they landed their catches (since the crew may need a rest, weather conditions may be bad and fish markets are closed on Sunday).
18 As expected, the fish quantity involved in the transaction has a negative estimated effect on prices, which
means that larger lots are sold for a lower price per kilogram.
11.7 percentage points compared to 22.9 percentage points before (column 5).19 Hence, our results
suggest that local conditions would have changed significantly just after the innovation was introduced.
We then replicate the same exercise over the whole September 2009 - June 2011 period using the same specifications, and results are reported in Table 5. When considering the subsample of treated vessels only (panel A), the estimated treatment effect is slightly larger than at the discontinuity. It amounts to 53.6 percentage points when the daily time trend, fixed effects for the day of the week and vessel fixed effects are introduced as controls (column 1), and it drops to 27.0 percentage points for the full specification (column 5). When adding matched control vessels to the sample (panel B), the treatment effect on the treated decreases to 30.9 percentage points for our first specification (column 1) and to 16.0 percentage points for the full specification (column 5). Again, these are slightly larger figures than at the discontinuity. An explanation is the progressive diffusion of information over time on the quality of fish landed by seiners. This progressive improvement of the reputation should attract new buyers looking for high-quality products (and presumably with a high willingness-to-pay) on the fish market of Les Sables d’Olonne and increase the demand for fish sold by treated vessels.
[ Insert Table 5 ]
5.3. The effect of the innovation on quality, quantity and prices for the treated market
We now turn to the evaluation of the overall effect of treatment on the market where the innovation was introduced. Our goal is to assess whether there are externalities of the innovation on the non-treated vessels as they may try to improve their fish quality to remain competitive.
We first estimate a standard panel specification of the proportion of high-quality fish in which additive market and month fixed effects are included together with a treatment dummy, which is defined as the interaction between a dummy for being the treated market (Les Sables d’Olonne) and a dummy for being in the March 2010-June 2011 period. Panel A of Table 6 shows that, when fish composition is not taken into account, the estimated effect of the innovation is significant and sizable with a value of 16.1 percentage points (column 1). This effect can be explained by the evolution of quality for treated vessels, their significant market share, incentives for other vessels to improve their quality, as well as adjustments of local demand. As expected, it remains nonetheless lower than the increase in the proportion of high-quality fish for treated vessels.
[ Insert Table 6 ]
19 The estimated treatment effect is hardly affected when quality is rather taken into account with two
dummies for average and high-quality grades, as it reaches 11.4 percentage points.
As the treated and control markets might be characterized by different trends in the evolution of quality, we conduct robustness checks by estimating specifications that also include interactive terms involving market and month fixed effects. The estimated treatment effect hardly changes since it takes values between 15.3 and 16.1 percentage points, when varying the number of interactive effects that are introduced from 1 to 3 (columns 2-4).20
Heterogeneous time trends can also be taken into account with the synthetic control approach in which the treated market is compared to a synthetic control market, constructed as a weighted average of control markets such that pre-treatment quality is similar. As reported in Table A2 in Appendix, the synthetic market mostly involves six control markets, the two largest contributions being those of Loctudy (38.9%) and Ile d’Oleron (25.7%). These two fish markets are not located far from Les Sables d’Olonne but they are characterized by very different proportions of high-quality fish (respectively 13.2% and 74.6%).
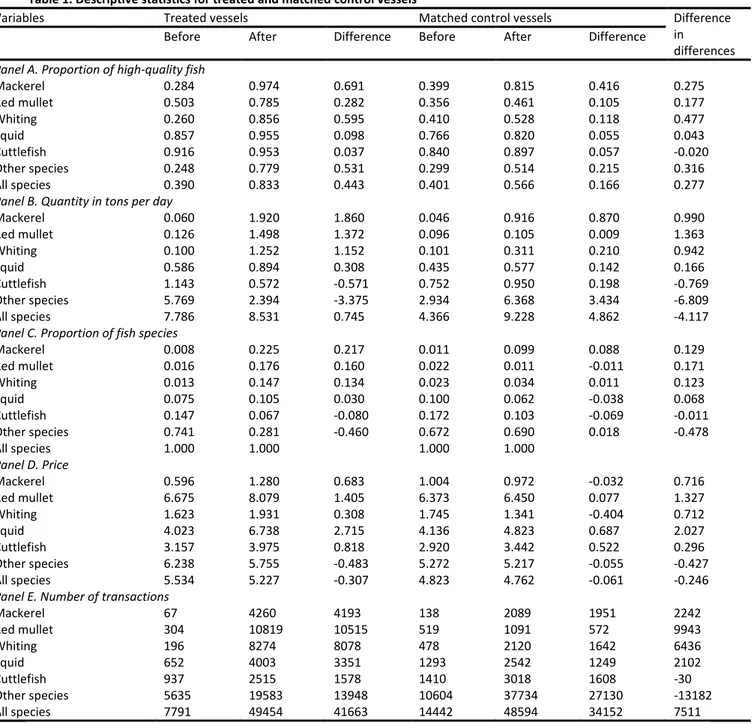
Figure 4 represents the evolution of the difference in quality between the treated and synthetic control markets. It shows that the synthetic market reproduces very well the quality in the treated market every month before treatment. There are variations in the estimated treatment effect over time since it increases until December 2010 before fluctuating negatively or positively. However, we obtain an average estimated treatment effect very close to other estimates at 16.0 percentage points (column 5 of Table 6).
[ Insert Figure 4 ]
We also conduct a Placebo experiment in which every control market is successively considered fictitiously as treated. We can then assess whether the estimated treatment effect obtained for the treated market is larger than those for the control markets. As the quality before treatment does not fit well for the synthetic control market obtained for some of the control markets, we only retain control markets for which the Root Mean Square Percentage Error (RMSPE) for quality before treatment is lower than five times that of the treated market.21 The evolution of the difference in
quality between each control market and its synthetic control market is represented in part A of Figure A6 in Appendix. Overall, the estimated treatment effect is larger for the treated market than for control markets, except during the transition period when treated vessels are successively reintroduced in the vessel fleet with their new equipment.
20 Even if there are procedures to determine the right number of factors to be included in the specification (Bai
and Ng, 2002; Moon and Weidner, 2015), they would be fragile (Onatski et al., 2013). As a consequence, we rather assessed the robustness of our results by varying the number of factors.
21 The RMSPE is given by the formula 1
𝑡̅−1�∑ (𝑦𝑡̅−1𝑡=1 𝑖𝑡− 𝑦𝑖𝑡𝑠)2 where 𝑦𝑖𝑡 is the observed quality for treated
market 𝑖 at time 𝑡 and 𝑦𝑖𝑡𝑠 is the estimated quality for its synthetic control market (see Abadie et al., 2015, p.
502, footnote 16).
We then take into account composition effects with the proportions of the five species most fished by treated vessels and the “others” category as additional controls. Panel B of Table 6 shows that the estimated treatment effect obtained with standard panel and factor model approaches is hardly affected. It is equal to 16.7 percentage points when estimating the difference-in-differences specification (column 1) and it oscillates between 15.2 and 18.2 percentage points when estimating factor models (columns 2-4). The synthetic control market now involves nine control markets which are rather different from those obtained when not taking into account the composition of species (see Table A2 in appendix). The estimated treatment effect obtained with the synthetic control method is a bit smaller than other estimates, at 13.5 percentage points (column 5).22 The reason for
this discrepancy is that the quality slightly differs between the treated and synthetic control markets during several months before treatment as shown by Figure 4. This occurs because it is not possible to construct a synthetic control market that is similar to the treated market in the dimensions of both pre-treatment quality and composition of species.
As before, we conduct a Placebo experiment and estimate the treatment effect for each control market by contrasting its post-treatment quality with that of a synthetic market as represented in part B of Figure A6 in Appendix. This time, we drop control markets for which the RMSPE for the quality before treatment is larger than two times that of the treated market. Indeed, the RMSPE for the treated market is now large due to the differences in quality before treatment between the treated and synthetic control markets.23 Nevertheless, the results are similar to those obtained when
not taking into account the composition of species, since the estimated treatment effect is larger for the treated market than for control markets after the transition period during which treated vessels are reintroduced in the fleet with their new equipment.
Overall, our results suggest that the treatment effect on the quality of the treated market would be comprised between 13.5 and 18.2 percentage points. This effect can be contrasted with the treatment effect obtained under the assumption that there is no spillover from the treated vessels to the non-treated ones. The treatment effect on treated vessels is 33.4 percentage points when considering the non-treated vessels in Les Sables d’Olonne as controls. Provided that 16.5% of transactions in the treated fish market involve treated vessels, this yields a treatment effect on the
22 Alternatively, we also experimented by considering, for composition variables, the proportions of the nine
main species in the volume sold in the treated fish market (along with a residual category). The estimated treatment effect is very similar. It is 16.8 percentage points when estimating the difference-in-differences specification, it ranges from 16.0 to 19.0 percentage points when estimating factors models, and it amounts to 12.6 percentage points when using the synthetic control method.
23 When fish composition is not taken into account, the RMSPE is equal to 0.0047 for the treated market of Les
Sables d’Olonne. The maximal RMSPE allowed for the placebo analysis is thus 5*0.0047=0.0235. When taking the fish composition into account, the RMSPE for les Sables d’Olonne is 0.0391 and we include in the placebo analysis only fish markets whose RMSPE is at most 2*0.0391=0.0782.