HAL Id: hal-02521252
https://hal.archives-ouvertes.fr/hal-02521252
Submitted on 27 Mar 2020
HAL is a multi-disciplinary open access
archive for the deposit and dissemination of
sci-entific research documents, whether they are
pub-lished or not. The documents may come from
teaching and research institutions in France or
abroad, or from public or private research centers.
L’archive ouverte pluridisciplinaire HAL, est
destinée au dépôt et à la diffusion de documents
scientifiques de niveau recherche, publiés ou non,
émanant des établissements d’enseignement et de
recherche français ou étrangers, des laboratoires
publics ou privés.
Anti-inflammatory activity of superoxide dismutase
mimics functionalized with cell- penetrating peptides
Emilie Mathieu, Anne-Sophie Bernard, H. Y. Ching, Andrea Somogyi, Kadda
Medjoubi, Jennifer Fores, Hélène Bertrand, Amandine Vincent, Sylvain
Trépout, Jean-Luc Guerquin-Kern, et al.
To cite this version:
Emilie Mathieu, Anne-Sophie Bernard, H. Y. Ching, Andrea Somogyi, Kadda Medjoubi, et al..
Anti-inflammatory activity of superoxide dismutase mimics functionalized with cell- penetrating peptides.
Dalton Transactions, Royal Society of Chemistry, 2020, 49 (7), pp.2323-2330. �10.1039/C9DT04619D�.
�hal-02521252�
Anti-inflammatory activity of superoxide dismutase mimics functionalized with cell-penetrating peptides
Emilie Mathieua, Anne-Sophie Bernarda, H. Y. Vincent Chinga, Andrea Somogyib, Kadda Medjoubib, Jennifer Rodon Foresa, Hélène C. Bertranda, Amandine Vincenta, Sylvain Trepoutc,d, Jean-Luc Guerquin-Kernc,d, Andreas Scheitlere, Ivana Ivanović-Burmazoviće, Philippe Seksikf, Nicolas Delsuca, Clotilde Policara
*
A superoxide dismutases mimic (Mn1) was functionalized with three positively charged-peptides: RRRRRRRRR (Mn1-R9), RRWWWRRWRR (Mn1-RW9) or Fx -r-Fx-K (Mn1-MPP). Characterization of the physico-chemical properties of the complexes show that they share similar binding affinity for Mn2+, apparent reduction potential and intrinsic superoxide dismutase activity. However, their accumulation in cells is different (Mn1-R9 < Mn1-MPP < Mn1-RW9 < Mn1), as well as their subcellular distribution. In addition, the three functionalized-complexes display a better anti-inflammatory activity than Mn1 when assayed at 10 µM. This improvement is due to a combination of an anti-inflammatory effect of the peptidyl moiety itself, and of the SOD mimic for Mn1-RW9 and Mn1-MPP. In contrast, the enhanced anti-inflammatory activity of Mn1-R9 is solely due to the SOD mimic. Keywords: Superoxide dismutase mimics, oxidative stress, anti-inflammatory compounds, cell penetrating peptides, multimodal imaging, X-fluorescence imaging. a Laboratoire des biomolécules, LBM, Département de chimie, Ecole normale supérieure, PSL University, Sorbonne université, CNRS, 75005 Paris, France. b Synchrotron SOLEIL, BP 48, Saint-Aubin, 91192 Gif sur Yvette, France c Institut Curie, Research Center, PSL University, Chemistry, Modelling and Imaging for Biology (CMIB), Bât 110-112, Centre Universitaire, F-91405 Orsay, France d INSERM U 1196, CNRS UMR 9187, Paris-Saclay University, Paris-Sud University, University Centre, Orsay, France e Department of Chemistry and Pharmacy, University of Erlangen-Nürnberg, Egerlandstr. 1, 91058 Erlangen, Germany f Sorbonne Université, Ecole normale supérieure, PSL University, CNRS, INSERM, AP-HP, Laboratoire des biomolécules, LBM 75012 Paris, France
Introduction
Superoxide dismutases (SODs) are very efficient enzymes, carved by evolution for high efficiency in the catalytic dismutation of superoxide (O2•−).1 These metallo-enzymes,
bearing Cu, Fe, Mn or Ni at their active site, are key redox enzymes for maintaining the redox homeostasis in cells and avoiding oxidative stress, defined as an imbalance between the production of reactive oxygen species (ROS) and antioxidant defenses. Common characteristics shared by SODs of different lineages point to important physicochemical parameters that tune their efficiency, such as the redox potential and the presence of electrostatic channels for O2•− attraction.1, 2 In mammals, the
mitochondrial MnSOD plays a crucial role in protecting mitochondria from oxidative stress. Its importance was demonstrated in vivo as its knockout is lethal to newborn mice.3, 4
One of the first metal complexes described for its SOD activity, i.e. its ability to catalyze the superoxide dismutation, was reported by R. F. Pasternack and B. Halliwell in 1979. This FeIII-porphyrin displays a catalytic rate constant at pH 10.1 of 3 x 10⁷ M-1.s-1.5 Soon after, the potential therapeutic applications of SOD mimics were perceived,6, 7 in which these catalytic antioxidants could nullify the excess of ROS in a situation of oxidative stress and reestablish redox homeostasis. Indeed, oxidative damages are observed in many different disorders, including chronic inflammation, cancers, or
neurodegenerative diseases.8, 9 The pitfalls of using a purified enzyme as a therapeutic treatment - cost of production, immunogenicity, and lack of cell penetration – may be overcome by using SOD mimics. Interest has shifted toward manganese complexes because, despite possible neurotoxicity of the free manganese ions,10 they do not efficiently catalyze Fenton reaction known to produce the deleterious hydroxyl radical,11 as opposed to iron or copper ions. Manganese ions are thus more suitable metal ions for
in vivo applications.2, 6
The criteria necessary for an efficient SOD mimic are as follows: (i) the SOD mimic needs to catalyze the superoxide dismutation, thus, the catalytic rate for this reaction must be greater than the catalytic rate for the spontaneous superoxide dismutation (5 x 10⁵ M-1.s-1 at pH 7).1, 2 This reactivity outside any cellular context can be defined as an intrinsic activity;2 (ii) the ligand must have a high affinity for both oxidation states of the metal ion.2, 6 Note that Mn(II), as a d5 ion with no ligand-field stabilization energy has a low association constant in the divalent metal ion transition series for most ligands. In biological systems, the endogenous ligands competing for Mn(II) binding also have low association constants, rendering the criteria on the association paradoxically less drastic for Mn(II) than for other metal cations;2, 12 (iii) the SOD mimics must be suitable for in vivo applications, and thus be non toxic, cell penetrating, and as inert as possible in biological media;2 (iv) their activity toward ROS must be characterized in a cellular context before going to in vivo experiments to
anticipate possible differences in biological activity. Their cellular distribution is key and should be investigated, bearing in mind the particular importance of the mitochondria protection.2 Indeed, biological systems are compartmented and superoxide being negatively charged cannot cross membranes.9, 13, 14 Therefore, the anti-superoxide activity of a SOD mimic is closely related to its subcellular distribution.
The parameters for the design of SOD mimics with an efficient intrinsic SOD activity are now well understood. The importance of a finely tuned redox potential has been evidenced in several series of SOD mimics.2, 15-17 Studies of Mn(III)-porphyrin complexes mimicking SODs have demonstrated the beneficial effect of positive charges introduced to the ligand on the catalytic rate constant of the dismutation of superoxide.10, 18 In our group, we have been designing SOD mimics bio-inspired from the MnSOD active site,2, 19, 20 for which a redox correlation with SOD-activity was demonstrated.20 We have functionalized one complex in this series, Mn1 (see Figure 1),21 with polyarginine peptides and described the effect of positive charges on the catalytic rate constant.22
Following on, the manganese (II) SOD mimics Mn1 (Figure 1) was studied in cells and in vivo.12, 23 Its ability to limit ROS flow in cells was demonstrated in activated macrophages.23 In addition, its study in a cellular model of inflammatory diseases demonstrated the ability of the complex to limit oxidative stress and inflammatory reaction in a cellular model of inflammatory bowel diseases at a concentration of incubation of 100 µM.12 At this concentration, Mn1 showed an homogenous subcellular distribution.
Two cell-penetrating peptides (CPPs) described in the literature were selected for coupling with Mn1: the polyarginine sequence R9 directly inspired from Tat,24-26 and RW9 (RRWWWRRWRR), which is based on penetratin.27-29 These hydrophobic and positively charged peptides (+9 for R9, and +6 for RW9) could help to target the complex into mitochondria, as the negative membrane potential of this organelle is known to favor the accumulation of positively charged lipophilic molecules.30-32 The third peptide selected was a mitochondria-penetrating peptide (MPP) designed by Kelley et al. to accumulate in mitochondria.33-35 Its sequence contains four amino acids Fx-r-Fx-K, with (L)-cyclohexyl (Fx), (D)-arginine (r), and
(L)-lysine (K) residues (Figure 1).
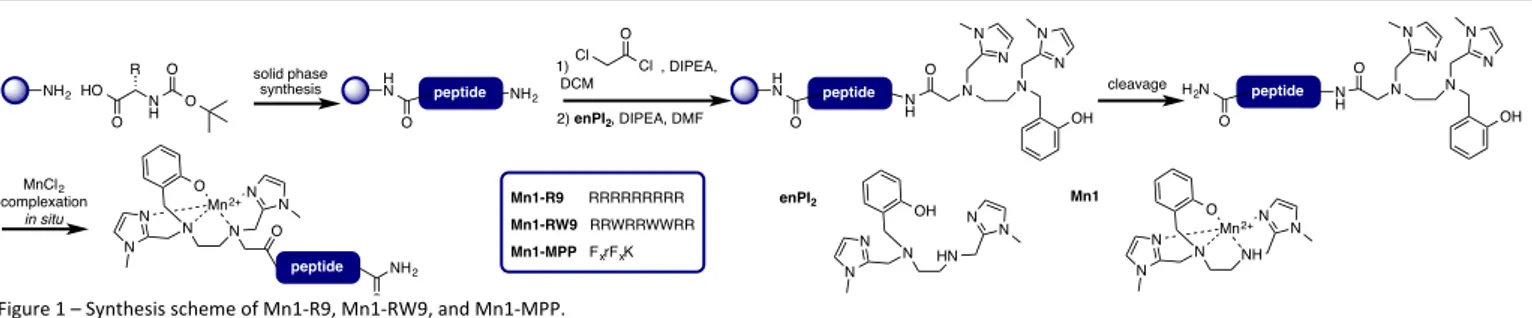
Figure 1 – Synthesis scheme of Mn1-R9, Mn1-RW9, and Mn1-MPP.
Results and discussion
Design and Synthesis
The parent ligand enPI2 (Figure 1) was functionalized with
three different peptidyl sequences. The peptides were obtained using standard solid phase synthesis, and conjugated to enPI2 before cleavage from the resin and purification by
preparative reversed-phase HPLC (Figure 1). As previously described,12, 22 the complexation was performed in situ by mixing the ligand and metal ion in a one to one ratio in HEPES buffer (0.1 M, pH 7.4) (see figure S1 for UV-visible titration).12
Physico-chemical properties Association constant
The thermodynamic parameters of the Mn2+-complexes were determined by isothermal titration calorimetry (ITC), and are given in Table 1. Data were best fitted to a 1:1 L/M model. As previously reported, the dissociation constants (Kd) of
[Mn-enPI2]+ (Mn1), and [Mn-enPI2-R9]10+ (Mn1-R9) found by this
method are comparable with values of 6.5 x 10⁻⁷ M and 6.3 x 10⁻⁷ M, respectively,22 and are similar to that measured for Mn1 by UV-visible spectroscopy (7.7 x 10⁻⁷ M).36 Similar to
Mn1-R9, for [Mn-enPI2-RW9]7+ (Mn1-RW9) and [Mn-enPI2
-MPP]3+ (Mn1-MPP) the K
d values are 7.1 x 10⁻⁷ M and 6.1 x 10⁻⁷
M, respectively. The increase in enthalpy for the peptide-functionalized complexes (16.3, 15.1, and 15.5 kJ.mol-1 for
Mn1-R9, Mn1-RW9, and Mn1-MPP respectively) in comparison to Mn1 (2.6 kJ.mol-1) can be assigned to an electrostatic effect,
with the positive charges on peptidyl sequences making the interaction with Mn2+ less favorable. This effect is
compensated by a favorable entropic component (174, 167, 176 J.mol-1.K-1 for Mn1-R9, Mn1-RW9, and Mn1-MPP
respectively) in comparison to Mn1 (124 J.mol-1.K-1), leading to
similar free energies of binding for the ligands. Hence, functionalization of enPI2 with short peptidyl sequences does
not impair the binding affinity for Mn2+. NH2 N H HO O R O O solid phase synthesis HN peptide O NH2 1) , DIPEA, DCM 2) enPI2, DIPEA, DMF Cl O Cl N O N N N OH N N cleavage H N peptide O N H N O N N N OH N N H2N peptide O N H Mn1-R9 RRRRRRRRR Mn1-RW9 RRWRRWWRR Mn1-MPP FxrFxK N N N N N N O Mn2+ O peptide NH2 O MnCl2 complexation in situ N HN N N N N OH enPI2 N NH N N N N O Mn2+ Mn1
Table 1. Thermodynamic parameters for complexation of Mn2+ to enPI 2 derivatives at 25 °C in HEPES (100 mM, pH 7.4, I = 40 mM) as determined by ITC. Ligand N a Kd a 10-7 M ΔHassoc a kJ.mol-1 ΔSassoc a J.mol-1.K-1 ΔGassoc a kJ.mol-1 enPI2 b 0.9 ± 0.2 6.5 ± 1.7 2.6 ± 0.2 124 ± 1 -34.5 ± 0.1 [enPI2- R9]9+ b 1.2 ± 0.1 6.3 ± 0.5 16.3 ± 0.3 174 ± 1 -35.4 ± 0.2 [enPI2-RW9]6+ c 0.9 ± 0.1 7.1 ± 0.4 15.1 ± 0.4 167 ± 4 -35.1 ± 0.4 [enPI2-MPP]2+ c 0.9 ± 0.1 6.1 ± 0.1 15.5 ± 0.4 176 ± 4 -35.6 ± 0.4
a Data represent mean ± standard deviation for 3 independent experiments. b From J. Inorg. Biochem., 2016, 160, 172-179.22 cThis work.
Electrochemistry
The electrochemical properties of Mn1 and Mn1-R9 have been previously reported and are reproduced in Table 2.22
Mn1-MPP was analyzed by cyclic voltammetry (CV) under the same conditions at a glassy carbon electrode in HEPES buffer (100 mM, pH 7.5). No CV was recorded for Mn1-RW9. Unlike the CV of Mn1, the CVs of Mn1-R9 and Mn1-MPP are irreversible, as was previously observed for polyarginines conjugates (Figure S2).22 However, the redox potential of the Mn3+/Mn2+ couple
was increased upon functionalization at the amine, but remains at a value that facilitates O2•− dismutation.
Intrinsic SOD activity
The intrinsic SOD activity was determined using the McCord-Fridovich assay, which compares the rates of reaction of a SOD mimic with a UV-visible probe specific for superoxide, ferricytochrome c in this study.2, 37 The IC50 is defined as the
concentration at which the rate of reaction with the probe is reduced by 50%. From this value, the constant kMcCF can be
calculated, which gives a good estimation of the catalytic rate constant for the reaction of superoxide dismutation.2, 5, 20 Using this method, the IC50 and kMcCF of Mn1 has previously
Table 2. E1/2 values determined by cyclic voltammetry.
Complex V vs. SCE Epa V vs. SCE Epc V vs. SCE E1/2 Mn1HEPES a 0.27 0.14 0.22
Mn1- R9HEPES a 0.45 -0.1 n/a
Mn1-RW9HEPES b n/a n/a n/a
Mn1-MPPHEPES b 0.42 -0.1 n/a
a From J. Inorg. Biochem., 2016, 160, 172-179. E
1/2, Epa, and Epc values were
determined in HEPES buffer (100 mM, pH 7.5) with a concentration of complex of 1 mM at a glassy carbon disk electrode at 0.5 V.s-1.22 b This work. E 1/2, Epa, and Epc values were determined in HEPES buffer (100 mM, pH 7.5) with a concentration of complex of 1 mM at a glassy carbon disk electrode at 0.5 V.s-1. been measured to be 0.81 µM and 7 x 10⁶ M-1.s-1 in phosphate buffer (50 mM, pH 7.8).21 In this study, HEPES (100 mM pH 7.5) was used instead of phosphate buffer to eliminate any activity related to Mn-phosphate adducts.38-40 Using these conditions,
the IC50 values were corrected for the Kd because of the low
assaying concentration range. The IC50
of Mn1, Mn1-R9, Mn1-RW9, and Mn1-MPP in HEPES buffer are reported in Table 3. kMcCF could not be determined because kcytC is not known in
this buffer. Note that a similar kinetics constant was determined by a stopped-flow method coupled with a UV detection.22 Table 3. SOD activity. IC50 values determined by Mc-Cord Fridovich assay, and catalytic rates determined by stopped-flow technique combined with fast-diode array UV-vis. Complex IC50 buffer pH µM kx 10stopped-flow6 M-1.s -1 Mn1 IC50 HEPES 7.5 0.47 ± 0.03 b ksf 5.0 ± 0.1 a Mn1- R9 IC 50 HEPES 7.5 0.19 ± 0.02 b ksf 5.0 ± 0.4 a Mn1-RW9 IC50 HEPES 7.5 0.32 ± 0.05 b ksf. 17.2 ± 0.2 b Mn1-MPP IC50 HEPES 7.5 0.33 ± 0.03 b ksf. 21.7 ± 0.1b
kmethod refers to the kinetic constant directly measured by stopped-flow (ksf); a
From J. Inorg. Biochem., 2016, 160, 172-179. ksf was determined by stopped-flow
in HEPES buffer (60 mM, pH 7.4). Data represent mean ± standard deviation for 3 independent experiments.22 b This work. IC
50 was determined in HEPES buffer
(100 mM, pH 7.5) with ferricytochrome c (22 µM), xanthine (200 µM) and xanthine oxidase. ksf was determined by stopped-flow in MOPS buffer (60 mM,
pH 7.4, ionic strength = 150 mM (NaCl)). Data represent mean ± standard deviation for 3 independent experiments.
The IC50 of Mn1-R9, Mn1-RW9, and Mn1-MPP are slightly
lower than IC50 for Mn1, which suggests a better SOD activity.
However, in HEPES buffer, the stopped-flow analysis of Mn1-R9 gives a ksf of 5 x 10⁶ M-1.s-1 as for Mn1,22 which rather
suggests that the SOD mimics have similar SOD activities. For Mn1-RW9 and Mn1-MPP, the ksf determined in MOPS buffer
are significantly higher (17.2 ± 0.2 106 M-1.s-1 and 21.7 ± 0.1 106 M-1.s-1 respectively) than for Mn1-R9 and Mn1. This is most likely due to the nature of the buffer since the measures for Mn1-RW9 and Mn1-MPP have been conducted in MOPS buffer, which is a less coordinating buffer in comparison with HEPES, thus less prone to competing with the ligand for Mn complexation. Studies in HT29-MD2 cells Toxicity The toxicity of Mn1-R9, Mn1-RW9, Mn1-MPP, and their redox inactive analogs (ZnII complexes) was checked by measuring the percentage of LDH released in the supernatant after incubation of these complexes. A compound leading to a %LDH released above 10% would be considered as toxic, which was not the case for the conditions of incubation used in this study (Figure S3).
Quantification
The accumulation of Mn1-R9, Mn1-RW9, and Mn1-MPP in HT29-MD2 cells was determined by measuring the total Mn content in cell lysates by EPR titration.12 HT29-MD2 cells were
incubated with the complexes for 6 hours, washed, lysed, and cell lysates were acidified in order to free all Mn2+ from its
Figure 2 the total Mn content for cells incubated with Mn1-R9, Mn1-RW9 or Mn1-MPP at 10 µM is higher than for control cells (0.36 nmol.mg-1 of proteins), but lower than in cells incubated with Mn1 at the same concentration (1.25 nmol.mg
-1). The Mn content for cells incubated with Mn1-RW9 is of 0.99
nmol.mg-1 of proteins. For cells incubated with Mn1-R9 and Mn1-MPP the Mn content was twice lower than Mn1, and was respectively 0.56 nmol.mg-1 and 0.68 nmol.mg-1 of proteins. Hence, the functionalization with the peptides has limited the accumulation of the complexes in cells. Using these values and the Kds, an estimation of the percentage of intact complexes in cells could be derived, and determined to be higher to 87% (from 87% to 99%, see Table S1). Figure 2 – Mn content in cell lysates of intestinal epithelial cells. Cells were incubated at 37 °C for 6 hours with media only (control), Mn1 (10 μM), Mn1-R9 (10 μM), Mn1- RW9 (10 μM), or Mn1-MPP (10 μM). Total Mn content in cell lysates was determined by EPR. Data represent mean ± SEM for n = 3-4 independent experiments: (*) p < 0.05, (**) p < 0.01 vs. control; (#) p < 0.05, (##) p < 0.01 vs. Mn1. For a table with the data in µM, see table S1. Distribution The subcellular elemental distribution of Mn in cells incubated with Mn1, Mn1-R9, and Mn1-MPP was studied by X-fluorescence microscopy. HT29-MD2 cells were grown on silicon nitride windows and incubated with the complexes at a concentration of 10 µM for 6 hours before cryofixation followed by freeze-drying. To ensure a good signal to noise ratio, long acquisition times (8 s.pixel-1) were used.
The Mn distributions of HT29-MD2 cells incubated with the complexes (10 µM) are shown in Figure 3a. Other elemental maps (K, P, Zn) are shown in Figure S6. The weak accumulation of the complexes in cells does not lead to enough changes to see a difference in Mn distribution between a basal Mn content (control cell) and the cell incubated with SOD mimics (Figures 3a). As the signal intensity is dependent not only on the amount of Mn but also on the cell thickness, we developed a method for normalizing the signal by the cell thickness (Figure 3b).
Figure 3 – Elemental distribution of Mn in HT29-MD2 cells (a), and normalized distribution (b). (a) Mn detection by X-ray fluorescence on cryofixed and freeze-dried
cells HT29−MD2 incubated 2 h under different conditions. (b) Normalization of the Mn distribution by the cell thickness using the homogeneously distributed K element. The maps were obtained by substraction of a scaled K map to the Mn map. The area where Mn accumulates (is not concentrated) are represented in red (in blue). Images recorded on the Nanoscopium beamline of Soleil synchrotron (excitation at 9.9 keV; integration time, 8.4 s pixel−1; pixel size, 300 nm).
In order to take into account the cell thickness, the signal intensity of the Mn maps was normalized using the elemental distribution of K as a reference. Indeed, in the case of cryofixed and freeze-dried cells, this element is homogeneously distributed in cells.41 A variation of the signal intensity of K thus reflects a variation in the cell thickness, the signal being stronger where the cell is thicker. The K map multiplied by a scale factor was subtracted from the Mn map (see details in ESI). This indicates areas where the Mn distribution is similar than that of K (grey area), or differs from K (red and blue areas) (Figure 3b). In particular, areas in red correspond to
areas of Mn accumulation, whereas blue areas are indicative of areas where Mn is less concentrated.
For a control cell incubated with the medium only, the subtraction map displayed a random distribution of spots with a higher (red) or lower (blue) Mn content in comparison to K (Figure 3b). In cells incubated with Mn1-R9, the distribution is similar to the control cell, which is in agreement with the overall low accumulation of Mn in cells for this complex (Figure 2). In contrast, the subtraction map for cells incubated with Mn1 showed large areas where the Mn distribution was different from that of K. This suggests that Mn1 acccumulates in specific subcellular part of the cells. This observation also contrasts with the Mn distribution for cells incubated with Mn1 at 100 µM that was shown to be similar to that of K.12 Similarly, incubation with Mn1-MPP greatly changed the distribution pattern, with large areas where Mn was accumulated (red) or was less concentrated relative to K (blue). The Mn distribution is a non-homogeneous, and an accumulation of Mn at the periphery of the cell is observed.
Antioxidant and anti-inflammatory activities in LPS-activated HT29-MD2 cells
Cellular model
The complexes were assayed on a cellular model of inflammatory bowel diseases.12, 42, 43 Intestinal epithelial cells HT29 were stably transfected to overexpress the protein
MD2.42, 43 The HT29-MD2 cells have an increased sensitivity to
LPS, which induces an inflammatory reaction in cells associated with an oxidative stress.14, 44-46
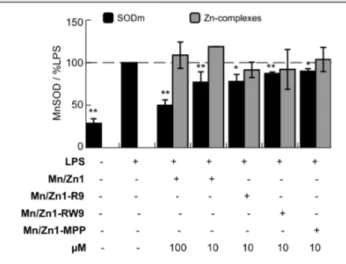
The antioxidant activity of the complexes was studied by looking at the expression of the mitochondrial SOD, which is overexpressed when cells are stressed with LPS.12, 47-57 In this set of experiments the redox inactive zinc complexes (Zn1-R9, Zn1-RW9, and Zn1-MPP) were also assayed as redox inactive controls.12
Antioxidant activity
The expression of MnSOD in cell lysates was determined by western-blot (see figure S5). The results in Figure 4 show the ratio MnSOD/actine for each condition, expressed as a percentage of the ratio MnSOD/actine for LPS-activated cells. Activation of HT29-MD2 cells with LPS leads to an approximately two-fold increase in MnSOD expression in comparison to control. Pre-incubation of LPS-activated cells with Mn1 at a concentration of 100 µM decreased MnSOD overexpression to 53% of LPS.12 At 10 µM the effect of Mn1 was reduced, with only a small decrease in MnSOD overexpression (89%). Mn1-R9, Mn1-RW9, and Mn1-MPP at 10 µM also decreased the MnSOD overexpression to 78%, 87%, and 90% of LPS, respectively. These SOD mimics are thus able to complement MnSOD, as was previously shown for Mn1 at 100 µM.12 In the same conditions, the zinc complexes showed no effect on the level of expression of MnSOD in LPS-activated cells. This further indicates that the effects observed should be due to the redox properties of the complexes.
Figure 4 – MnSOD expression in intestinal epithelial cells activated with LPS.
Determination by western blotting (WB, see figure S5) of MnSOD and actin expression in HT29-MD2 cells after a 7 h incubation with medium only, or the specified compound. The incubation concentrations for each condition are indicated. When specified, LPS (0.1 μg mL−1) was added after 1 h of incubation. Data correspond to the ratio of bands intensities for MnSOD/actin, and represent mean ± SEM for n = 2-7 independent experiments: (*) p < 0.05, (**) p < 0.01 versus LPS. Control experiments without LPS are shown in Figure S4.
Anti-inflammatory activity
The anti-inflammatory activity of Mn1-R9, Mn1-RW9, and Mn1-MPP in LPS-activated cells was studied using the production of a pro-inflammatory cytokine, the interleukine 8 (IL8), which is excreted in the supernatant. IL8 production was quantified using a commercially available ELISA kit. Cells activated with LPS showed an increase in IL8 secretion in comparison to control (Figure 5). Cells pre-incubated with Mn1 at 100 µM showed a reduced IL8 production (47% of LPS), which demonstrates the anti-inflammatory activity of the complex, as previously described (Figure 5).12 At 10 µM, the anti-inflammatory activity of Mn1 is too low to be observed. In contrast, the three derivatives R9, RW9 and Mn1-MPP assayed at 10 µM significantly reduce the IL8 production to 62, 70 and 69% of LPS, respectively. The effect of the corresponding zinc complexes, R9, RW9 and Zn1-MPP, on IL8 production was also investigated. Zn1-RW9 and Zn1-MPP reduced the IL8 production in comparison to LPS-activated cells at a similar extent as Mn1-RW9 and Mn1-MPP. Zn1-R9 does not show an effect on IL8 overproduction. Cell-penetrating peptides are non-innocent carriers, with some of them having been identified for their anti-inflammatory properties.58-61 Therefore a combined effect of the SOD mimics and the peptidyl moiety can be responsible for the anti-inflammatory activity of Mn1-RW9 and Mn1-MPP, since their redox inactive analogs Zn1-RW9 and Zn1-MPP exhibited anti-inflammatory effects as well. In contrast, the conjugation of Mn1 with the polyarginine peptide seems to enhance specifically the anti-inflammatory activity of the Mn-moiety, with the Zn analog being inactive.
Figure 5 – IL8 production in intestinal epithelial cells activated with LPS. IL8 secretions
in supernatants of HT29−MD2 cells were measured by ELISA after a 7 h incubation with medium only (control), LPS, or the specified compound and LPS. LPS (0.1 μg mL−1) was added after 1 h of incubation. Data represent mean ± SEM for n = 4-8 independent experiments: (*) p < 0.05, (**) p < 0.01 versus LPS; (#) p < 0.05, (##) p< 0.01. Control experiments without LPS are shown in Figure S7.
Conclusions
The parent SOD mimics Mn1 was functionalized with three peptidyl moieties in order to improve its anti-inflammatory activity in a cellular model of inflammatory diseases. Three peptides were selected, the cell penetrating peptides polyarginine R9, and RW9, and a mitochondria targeting peptide MPP. Characterization of the complexes Mn1-R9, Mn1-RW9 and Mn1-MPP demonstrated that these compounds have similar intrinsic SOD activity, and dissociation constant values as Mn1. Investigation of the accumulation and subcellular location of the complexes show that the functionalization with peptidyl chains decreased their cell penetration, with Mn1-R9 being the less concentrated in cells. In addition, different subcellular distribution of the complexes was also observed. Finally, investigation of the antioxidant and anti-inflammatory activity of the functionalized SOD mimics in a cellular model of inflammatory diseases showed that Mn1-R9, Mn1-RW9 and Mn1-MPP have a better anti-inflammatory activity than Mn1 when assayed at a concentration of incubation of 10 µM. In particular, we demonstrated that the anti-inflammatory activity of Mn1-R9 is enhanced by the polyarginine peptide, and importantly, the redox-inactive analogue (Zn1-R9) is inactive. In contrast, for Mn1-RW9 and Mn1-MPP we observed a contribution of the peptidyl moiety to the anti-inflammatory effect independent of redox metal-based regulation This shows the importance of the redox inactive control as a ZnII analogous complex.
Overall, functionalization with the peptides led to an improved anti-inflammatory activity: indeed, it was possible to lower the incubation concentration by one order of magnitude, keeping a significant anti-inflammatory effect and allowing a better ratio activity/concentration, which is of interest for future applications in the field of inflammatory diseases.
Materials and Methods
Quantification of Mn-complexes by EPR in cell lysates
Cells were cultured in a 75 cm2 flask to reach 90% confluency. They were incubated with medium only, or tested compounds at the desired concentration, for 6 hours, at 37 °C. After a washing with 0.9% NaCl, a chaotropic shock was performed by washing the cells once with 1 M NaCl to remove charged species potentially externally associated to the cells. Cells were washed twice with 0.9% NaCl. They were harvested by scraping and centrifuged at 4°C for 10 min at 900 rpm. The supernatant was removed, 100 µL of MilliQ water was added and two freezing/thawing cycles in liquid nitrogen were performed. The protein content was determined for each sample. Cell lysates were acidified with HClO4 (10% v/v final
concentration), which freed manganese(II) ion from coordination.62 A calibration curve was established using MnCl2 in water acidified with 10% v/v HClO4, and
quantification of the manganese-content was performed using the two first lines in the six-line Mn2+ X-band EPR spectrum and reported per milligram of proteins.
EPR spectra were recorded on a Bruker Elexsys 500 spectrometer (Bruker, Wissembourg, France) operating at X-band (9.82 GHz), and a SHQ high-sensitivity cavity, in a glass capillary tube: microwave power, 32 mW; modulation frequency, 100 kHz; modulation amplitude, 18 G; receiver gain, 60 dB; time constant, 40.96 ms; conversion time, 40.96 ms; datapoints, 1024; field center, 3500 G; sweep width, 1000 G; sweep time, 41.94 s; nine scans; room temperature (21 °C). Data acquisition and processing were performed using Bruker Xepr software. Synchrotron radiation X-ray fluorescence microscopy HT29-MD2 cells were seeded on silicon nitride windows (size: 5 mm x 5 mm, thickness: 500 nm) in 24-well plate (75 000 cells/well). After 24 h, cells were incubated with the complex (10 µM) for 6 h at 37 °C. Cells were washed with 0.9% NaCl and a chaotropic shock was performed by washing the cells once with 1 M NaCl. They were then washed once with EDTA (50 mM), and twice with 0.9% NaCl. Cells were cryofixed in liquid ethane and freeze-dried.
Mappings of intracellular manganese (Mn), potassium (K), phosphate (P), iron (Fe), and zinc (Zn) were performed on the Nanoscopium beamline of SOLEIL synchrotron (L'Orme des Merisiers Saint-Aubin, France). Cells were located using a phase-contrast optical microscope. All measurements were performed at room temperature. Excitation, 9.9 keV; integration time, 8.0 s pixel-1; pixel size, 300 nm.
The procedure for image treatment is described in ESI.
Cell activation with LPS and incubation with the compounds
HT29-MD2 cells were seeded in 24 well-plates at 200 000 cells/well to reach 90% confluence after 3 or 4 days. Cells were incubated with media only, or the tested compounds at the desired concentration for 1 h. Then, LPS was added (0.1 µg/mL, 6 hours). Supernatants were collected and stored at -20 °C before ELISA and LDH assay. Cells were washed with
0.9% NaCl, lysed in PBS containing 1% triton X-100 and protease inhibitors cocktail. They were harvested by scraping, and stored at -20 °C before western blot, cytotoxicity and protein quantification experiments.
Conflicts of interest
Philippe Seksik declares consulting fees from Takeda, Abbvie, Merck-MSD and Biocodex, grants from Biocodex, sponsored travel from Merck-MSD and Takeda.These COI are not related with the present work.
Acknowledgements
We thank Ecole Normale Supérieure Paris Saclay for E. Mathieu PhD fellowship, TGE RENARD (FR 3443, CNRS) and UMR8601 for access to the EPR spectrometer for the EPR experiments, Dr. J.L. Guerquin-Kern, Dr. F. Poyer, and Pr. S. Marco for useful discussions and help in cryofixed samples preparation, Dr. F. Lambert for help in synthesis, B. Goetz for help with ICP-MS, Pr. A. Leturque and M. Moreau for access to the WES, Dr. G. Sommeria-Klein for useful discussions. We also thank Dr. L. Grimaud for help for electrochemistry experiments, Dr. Sandrine Sagan for ITC and the IBPS SU, FR3631 mass spectrometry core facilities for access to the MALDI-TOF spectrometer, Martha Zoumpoulaki for recording MS-MS spectra. Association François Aupetit, ANR (ANR-10-IDEX-0001-02 PSL* project INOCELLCHEM and ANR-15-CE07-0027 project MAGIC), Fondation pour la Recherche Biomédicale (project DIE20151234413) are acknowledged for financial supports. SOLEIL and APS committees are acknowledged for beamtime. Use of the Advanced Photon Source, an Office of Science User Facility operated for the U.S. Department of Energy (DOE) Office of Science by Argonne National Laboratory, was supported by the U.S. DOE under Contract No. DE-AC02-06CH11357.
Supporting Information
Supplementary figures, materials, synthetic procedures, physico-chemical characterization (isothermal titration calorimetry, electrochemistry, McCord-Fridovich assay), cell culture, cytotoxicity assay, protein concentration, MnSOD analysis, IL8 quantification, statistical analysis.
Abbreviations
CPP, cell-penetrating peptides; CV, cyclic voltammetry; EPR, electron paramagnetic resonance; IL8, interleukine 8; ITC, isothermal titration calorimetry; LDH, lactate dehydrogenase; LPS, lipopolysaccharide; MD2, myeloid differentiation protein-2; MPP, mitochondria-penetrating peptides; ROS, reactive oxygen species; SOD, superoxide dismutase; TLR4, Toll-like receptor 4; XTT, 2,3-Bis-(2-Methoxy-4-Nitro-5-Sulfophenyl)-2H-Tetrazolium-5-Carboxanilide;
References
1. Y. Sheng, I. A. Abreu, D. E. Cabelli, M. J. Maroney, A.-F. Miller, M. Teixeira and J. S. Valentine, Chem. Rev., 2014,
114, 3854-3918.
2. C. Policar, in Redox Active Therapeutics, eds. J. S. Reboucas, I. Batinic-Haberle, I. Spasojevic, D. S. Warner and D. St. Clair, Springer, 2016, ch. Chapter 17, pp. 125-164.
3. S. Melov, P. Coskun, M. Patel, R. Tuinstra, C. Barbara, A. S. Jun, T. H. Zastawny, M. Dizdaroglu, S. I. Goodman, T.-T. Huang, H. Miziorko, C. J. Epstein and D. C. Wallace,
P.N.A.S., 1999, 96, 846-851. 4. Y. Li, T.-T. Huang, E. J. Carlson, S. Melov, P. C. Ursell, J. L. Olson, L. J. Noble, M. P. Yoshimura, C. Berger, P. H. Chan, D. C. Wallace and C. J. Epstein, Nature Genetics, 1995, 11, 376-381. 5. R. F. Pasternack and B. Halliwell, J. Am. Chem. Soc., 1979, 101, 1026-1031. 6. D. P. Riley, Chemical Reviews, 1999, 99, 2573-2588. 7. D. Salvemini, C. Muscoli, D. P. Riley and S. Cuzzocrea,
Pulm. Pharmacol. Ther., 2002, 15, 439-447.
8. A. M. Pisoschi and A. Pop, European Journal of Medicinal
Chemistry, 2015, 97, 55-74.
9. M. Valko, D. Leibfritz, J. Moncol, M. T. D. Cronin, M. Mazur and J. Telser, The International Journal of
Biochemistry & Cell Biology, 2007, 39, 44-84.
10. I. Batinic-Haberle, A. Tovmasyan, E. R. Roberts, Z. Vujaskovic, K. W. Leong and I. Spasojevic, Antiox Redox
Signal., 2014, 20, 2372-2415.
11. J. G. Charrier and C. Anastasio, Atmos. Environ., 2011, 45, 7555-7562.
12. E. Mathieu, A.-S. Bernard, N. Delsuc, E. Quévrain, G. Gazzah, B. Lai, F. Chain, P. Langella, M. Bachelet, J. Masliah, P. Seksik and C. Policar, Inorg. Chem., 2017, 56, 2545-2555. 13. C. C. Winterbourn, Nature Chemical Biology, 2008, 4, 278-286. 14. M. Schieber and N. S. Chandel, Curr. Biol., 2014, 24, R453-R462. 15. I. Batinić-Haberle, I. Spasojević, P. Hambright, L. Benov, A. L. Crumbliss and I. Fridovich, Inorganic Chemistry, 1999,
38, 4011-4022.
16. I. Batinić-Haberle, J. S. Rebouças and I. Spasojević, Antiox
Redox Signal., 2010, 13, 877-918.
17. S. Miriyala, I. Spasojevic, A. Tovmasyan, D. Salvemini, Z. Vujaskovic, D. St. Clair and I. Batinic-Haberle, Biochim.
Biophys. Acta, 2012, 794-814.
18. S. Reboucas Julio, I. Spasojevic, D. H. Tjahjono, A. Richaud, F. Méndez, L. Benov and I. Batinic-Haberle, Dalton Trans, 2008, 9, 1233-1242.
19. S. Durot, F. Lambert, J.-P. Renault and C. Policar, Eur. J.
Inorg. Chem., 2005, 2789-2793. 20. S. Durot, C. Policar, F. Cisnetti, F. Lambert, J.-P. Renault, G. Pelosi, G. Blain, H. Korri-Youssoufi and J.-P. Mahy, Eur. J. Inorg. Chem., 2005, 3513-3523. 21. F. Cisnetti, A. S. Lefevre, R. Guillot, F. Lambert, G. Blain, E. Anxolabéhère-Mallart and C. Policar, Eur. J. Inorg. Chem., 2007, 4472-4480. 22. H. Y. V. Ching, I. Kenkel, N. Delsuc, E. Mathieu, I. Ivanović-Burmazović and C. Policar, J. Inorg. Biochem., 2016, 160, 172-179.
23. A.-S. Bernard, C. Giroud, H. Y. V. Ching, A. Meunier, V. Ambike, C. Amatore, M. Guille Collignon, F. Lemaître and C. Policar, Dalton Trans., 2012, 41, 6399-6403.
24. M. Green and P. M. Loewenstein, Cell, 1988, 55, 1179-1188.
25. A. D. Frankel and C. O. Pabo, Cell, 1988, 55, 1189-1193. 26. E. Vivès, P. Brodin and B. Lebleu, Journal of Biological
Chemistry, 1997, 272, 16010-16017.
27. C. Bechara and S. Sagan, FEBS Letters, 2013, 587, 1693-1702.
28. D. Derossi, A. H. Joliot, G. Chassaing and A. Prochiantz,
Journal of Biological Chemistry, 1994, 269, 10444-10450.
29. A. L. J. Marschall, A. Frenzel, T. Schirrmann, M. Schüngel and S. Dübel, mAbs, 2011, 3, 3-16.
30. B. E. Schultz and S. I. Chan, Annu. Rev. Biophys. Biomol.
Struct., 2001, 30, 23-65.
31. J. A. Enríquez, Annual Review of Physiology, 2016, 78, 533-561.
32. M. P. Murphy, Biochimica et Biophysica Acta (BBA) -
Bioenergetics, 2008, 1777, 1028-1031.
33. K. L. Horton, M. P. Pereira, K. M. Stewart, S. B. Fonseca and S. O. Kelley, ChemBioChem, 2012, 13, 476-485. 34. S. O. Kelley, K. M. Stewart and R. Mourtada,
Pharmaceutical Research, 2011, 28, 2808-2819.
35. K. M. Stewart, K. L. Horton and S. O. Kelley, Organic &
Biomolecular Chemistry, 2008, 6, 2242.
36. A. Conte-Daban, V. Ambike, R. Guillot, N. Delsuc, C. Policar and C. Hureau, Chem. Eur. J., 2018, 24, 5095-5099. 37. J. M. McCord and I. Fridovich, J. Biol. Chem., 1969, 244,
6049-6055.
38. I. Spasojevic, I. Batinic-Haberle, R. D. Stevens, P. Hambright, A. N. Thorpe, J. Grodkowski, P. Neta and I. Fridovich, Inorg. Chem., 2001, 40, 726-739.
39. K. Barnese, E. B. Gralla, D. E. Cabelli and J. S. Valentine, J.
Am. Chem. Soc., 2008, 130, 4604-4606.
40. F. C. Friedel, D. Lieb and I. Ivanovic-Burmazovic, J. Inorg.
Biochem., 2012, 109, 26-32.
41. S. Roudeau, A. Carmona, L. Perrin and R. Ortega,
Analytical and Bioanalytical Chemistry, 2014, 406,
6979-6991.
42. C. Lenoir, C. Sapin, A. H. Broquet, A.-M. Jouniaux, S. Bardin, I. Gasnereau, G. Thomas, P. Seksik, G. Trugnan, J. Masliah and M. Bachelet, Life Sci., 2008, 82, 519-528. 43. P. Seksik, H. Sokol, V. Grondin, C. Adrie, H. Duboc, B.
Pigneur, G. Thomas, L. Beaugerie, G. Trugnan, J. Masliah and M. Bachelet, Innate Imunnity, 2010, 16, 381-390. 44. Y. Lei, K. Wang, L. Deng, Y. Chen, E. C. Nice and C. Huang,
Medicinal Research Reviews, 2015, 35, 306-340.
45. S. Bhattacharyya, P. K. Dudeja and J. K. Tobacman, AJP:
Gastrointestinal and Liver Physiology, 2008, 295,
G784-G790. 46. S. H. H. Chan, K. L. H. Wub, L. L. Wang and J. Y. H. Chan, Free Radical Biol. Med., 2005, 39, 603-618. 47. H. S. Nick, R. J. Rogers and J. M. Monnier, J. Biol. Chem., 2001, 276, 20419-20427. 48. J. F. Valentine and H. S. Nick, Gastroenterology, 1992, 103, 905-912.
49. H. Ogawa, P. Rafiee, J. Heidemann, P. J. Fisher, N. A. Johnson, M. F. Otterson, B. Kalyanaraman, K. A. Pritchard and D. G. Binion, The Journal of Immunology, 2003, 170, 5956-5964.
50. J. Mitchell, H. Jiang, L. Berry and B. Meyrick, Journal of
Cellular Physiology, 1996, 169, 333-340.
51. Y. Kifle, J. Monnier, S. E. Chesrown, M. K. Raizada and H. S. Nick, Journal of Neurochemistry, 66, 2128-2135.
52. M. J. Pabst, K. M. Pabst, D. B. Handsman, S. Beranova-Giorgianni and F. Giorgianni, Proteome Science, 2008, 6, 13.
53. D. D. Bannerman and S. E. Goldblum, American Journal of
Physiology-Lung Cellular and Molecular Physiology, 2003,
284, L899-L914.
54. M.-F. Tsan, R. N. Clark, S. M. Goyert and J. E. White,
American Journal of Physiology-Cell Physiology, 2001, 280,
C1422-C1430.
55. V. Sampath, A. C. Radish, A. L. Eis, K. Broniowska, N. Hogg and G. G. Konduri, Free Radical Biology and Medicine, 2009, 46, 663-671.
56. J. E. White and M.-F. Tsan, American Journal of
Respiratory Cell and Molecular Biology, 2001, 24, 164-169.
57. L. S. Gibbs, P. J. Del Vecchio and J. B. Shaffer, Free Radical
Biology and Medicine, 1992, 12, 107-111.
58. K. H. Park, Y. H. Nan, Y. Park, J. I. Kim, I.-S. Park, K.-S. Hahm and S. Y. Shin, Biochimica et Biophysica Acta (BBA) -
Biomembranes, 2009, 1788, 1193-1203.
59. Y. F. Wang, X. Xu, X. Fan, C. Zhang, Q. Wei, X. Wang, W. Guo, W. Xing, J. Yu, J.-L. Yan and H.-P. Liang, Molecular
Therapy, 2011, 19, 1849-1857.
60. R. Steel, J. Cowan, E. Payerne, M. A. O'Connell and M. Searcey, ACS Medicinal Chemistry Letters, 2012, 3, 407-410.
61. H. Kim, S. Moodley and M. Liu, Drug Delivery and
Translational Research, 2015, 5, 275-278.
62. D. E. Ash and V. L. Schramm, J. Biol. Chem. , 1982, 257, 9261-9264.