1
Design and fabrication of an electrode array sensor
for probing the electric potential distribution at the
mesoscopic scale in antistatic felts
M Boutaayamou1, P Lemaire2, B Vanderheyden1 and P Vanderbemden1
1
Department of Electrical Engineering and Computer Science, B28, University of Liège, B–4000 Liège, Belgium
2
Centexbel, the Belgian Textile Research Centre, unit "Health, Safety & Security", avenue du parc 38, B–4650 Herve, Belgium
E-mail : mboutaayamou@ulg.ac.be
Abstract.
We present an original voltage probe design for measuring the electric potential distribution at the mesoscopic scale (i.e., 1 mm–1 cm) in antistatic felts. The felts are composed of a mixture of non-conductive and metallic fibers and exhibit complex non-linear electric behaviour— including possibly non-linearity and hysteresis effects—which may be due to localized electrical or electromechanical phenomena. The sensor consists of an array of 8 9 needle electrodes (160 µm at the shaft and less than 50 µm toward the apex), which are mechanically maintained at fixed relative positions while their tips are inserted inside the fabric of the sample. The interelectrode distance is 1.5 mm and the overall active area is 12 12 mm². The electrical insulation resistance for nearest neighbour pairs of electrodes was found to be larger than 860 Gthus making the sensor suitable for measuring antistatic felts with an electric resistance that typically does not exceed a few GThe sensor was successfully used for measuring the distribution of the electric potential in a polyester fabric subjected to voltages of up to 6.2 kV, and in a sample containing 2% in weight of metallic fibers, demonstrating the presence of irreversible changes in that felt sample (i.e., with conductive fibers) at high voltages. It is concluded that the developed probe voltage is a promising technique that could be used for the assessment of the conduction mechanisms in the antistatic materials at the mesoscopic scale.
2 Keywords: Antistatic felts, antistatic fibers, conduction mechanisms, electric potential distribution, electrode array sensor, nonwoven felts, voltage probe.
1. Introduction
Antistatic felts can be used in filtering or powder sieving applications, where the electrostatic charges liberated by contacts between the filtered particles and the fabric of the filter might accumulate and lead to a build-up of electrostatic potential. Such a situation may result in spark discharges and even in an explosion in the presence of flammable substances or combustible dusts [1, 2]. The risk of an explosion increases for smaller particle sizes [3]. The build-up of electrical potential can be avoided by allowing the felt to drain the accumulated charges to a grounded point, for instance by incorporating conductive fibers into its fabric [4, 5]. Conductive fibers can be added randomly or can be arranged according to a predefined structure. The resulting felts have rather uniform electrical properties over the scale of many fibers (a few tens of cm), but start showing strong inhomogeneous properties at smaller scales (~1 cm and smaller), with a high sensitivity to fiber orientation over the sub-millimeter scale for the random arrangements. This ‘mesoscopic’ scale (1 mm–1 cm), i.e., between the ‘macroscopic’ scale (where properties are averaged over a lot of fibers) and the ‘microscopic’ scale (on the order of the fiber diameter), is precisely the relevant one for exploring the conduction mechanisms [6] that are responsible for the antistatic properties of the felts, as will be investigated in the present paper.
The antistatic properties of felts (containing conductive fibers or not) can be assessed by several measurements techniques most often carried out using well-defined standards [7–9]. As an example, the techniques using electrical contacts include resistivity measurements on rectangular samples of different lengths [7] or along the two diagonals of a 50 cm-side square sample [8]. The contactless methods involve measuring the electric charge vs. time decay after triboelectric charging of a 30 cm square sample [9]. Such methods provide valuable information on felts of macroscopic size [10]. The characterization of conduction processes on the mesoscopic scale, however, requires characterizing the felts by measuring a voltage distribution (as opposed to a voltage difference) throughout the sample, with a millimetric resolution. Among the techniques that can be used for mapping the electric potential at the surface of insulators [11–13], very few can be adapted easily to nonwoven felts. A moving electrode can be placed in contact with the sample and displaced at several locations of the sample surface [14] but this method is time consuming. Contactless techniques (electrostatic fieldmeters and voltmeters [15]) using a Kelvin capacitive probe [16] allow voltage mappings to be performed when the probe is scanned above the sample surface [17].Sub-millimetric resolutions can be achieved with so-called Pockels device using a Bi4Ge3O12 crystal [18] but require an advanced optical system with
3 Ar laser and CCD camera [19]. In addition, an electric field microscopy system has been developed to measure and image surface charge distributions with high spatial resolutions [20, 21]. Nevertheless, this electric field microscopy system along with the high-resolution implementing the Kelvin probe in an atomic force microscope (AFM) such as Kelvin probe force microscopy (KPFM) or surface potential microscopy (SPM) [22–25], are better suitable to the analysis of thin films or unique fibers [26] rather than the highly irregular surface of nonwoven felts [27]. The aforementioned contactless techniques [15–25] have the advantage of not perturbing the voltage distribution but the spatial resolution is limited by the small, but finite, surface-to-probe distance [28]. Moreover, these techniques, i.e., [15–25], are suitable for the measurement of the voltage distribution at the level of the sample surface, whereas our technique can measure this voltage distribution at the level of the sample volume. An example of research involving the determination of electrical resistance using an array of potential pick-up probes is presented in [29]. The device is used for low-voltage measurements and non-destructive evaluation of corrosion in conducting materials (e.g. steel). Consequently, the design does not address the same issues as for insulators. In particular, the electrical insulation resistance between the potential pick-up probes is critical when dealing with high electrical resistive nonwoven felts, measured possibly at high-voltages (a few kilovolts).
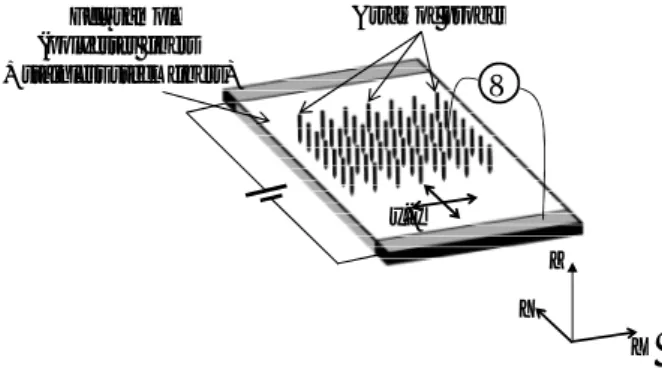
In this paper, we present an original design of measurement set-up on insulating materials based on an array of probes, as depicted in figure 1, where the electric potential is measured and recorded at the different electrodes almost simultaneously. The novelty of this setup is to use several electrodes with fixed relative positions, instead of a single electrode which has to be moved throughout the surface of the sample. The probe array setup guarantees a better accuracy in positioning the electrodes and, by avoiding multiple displacements, considerably reduces the time needed to map out the electrical potential distribution.
The manuscript is organized as follows: The characterized samples are presented in Sec. 2; the voltage probe design and realization is discussed in Sec. 3 and the results are analyzed in Sec. 4. Our conclusions are drawn in Sec. 5.
2. Antistatic felt samples
The felts used in this research are nonwoven fabrics provided by the company SIOEN Felt & Filtration, Liège, Belgium. The materials are either composed of insulating polyester fibers (sample A) or polyester fibers and stainless steel conductive fibers with a weight percentage of 2% (sample B) (see figure 2(a)). In term of the volume fraction, a felt sample B is typically composed of 17.9% of polyester fibers, 0.1% of stainless steel fibers and 82% of air. The conductive and non-conductive
4 fibers have a diameter of 12 µm. The conductive fibers have a typical length of a few centimeters. In sample B, the conductive fibers are inserted at random. The felt samples have a thickness of 2 mm and the surface investigated for electrical measurements is typically a few square centimeters. As can be seen in figure 2(b), the surface is highly irregular, as is the case for non-woven felts [30].
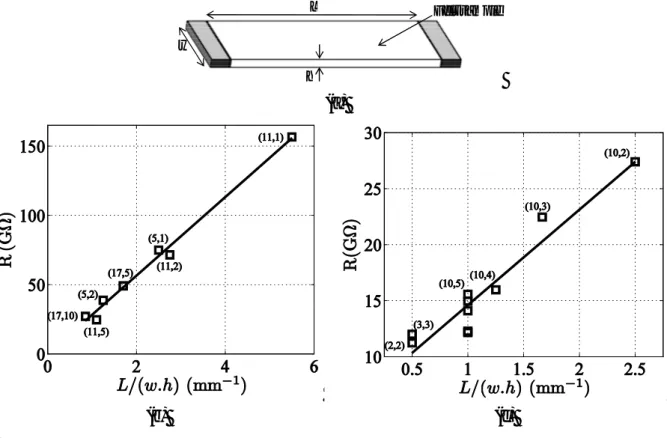
The DC electrical resistance of the two felt materials is first characterized on several rectangular samples of different sizes (see figure 3(a)). The applied current is always parallel to the sample surface and the resistance is measured using a Keithley 6517B electrometer. The electrical contacts are two planar silver painted electrodes located at extremities of the samples (see figure 2(b)). Experiments were carried out in controlled climatic conditions, in the present case (23 0.1) °C and a relative humidity of (40 0.4)%. For each sample, the electrical resistance was recorded after 1 min of applying a DC electrical potential difference of 100 V. Measurement results on samples of different rectangular geometries (length and width ranging from 20 mm to 170 mm, and 10 mm to 100 mm, respectively) allow the electrical resistivity to be estimated as the slope of the regression lines in figures 3(b) and 3(c). Results show that the electrical resistivity of the polyester felts (with no conductive fibers—material A) is at least three times larger than that of felts containing 2% weight conductive fibers (material B) (see table 1). In addition, measurements on small size samples point out an influence of the detailed arrangement of the fibers close to the electrical contacts: resistance measurements may yield different results depending on whether the electrode probes are locally in contact or not with conductive fibers.
Table 1. Electrical resistivity of felt samples A and B at a temperature of (23 0.1) °C and at a relative humidity of (40 0.4)%.
Sample A Sample B Electrical resistivity (MΩ m) 28 ± 3 8.5 ± 0.8
3. The voltage probe design
3.1. Design considerations
Designing a voltage probe array with a sub-millimeter resolution poses three main challenges:
1. The electrodes must be very thin and have precisely fixed relative positions. In addition, the holder must keep the probes fixed throughout the measurement, in particular while the tips are plunged inside the fabric.
5 2. The electrical insulation resistance between the electrode probes must be larger than the
electrical resistance of the samples (typically, several G).
3. The electrical insulation between the probes must be able to withstand high voltages (up to several kV).
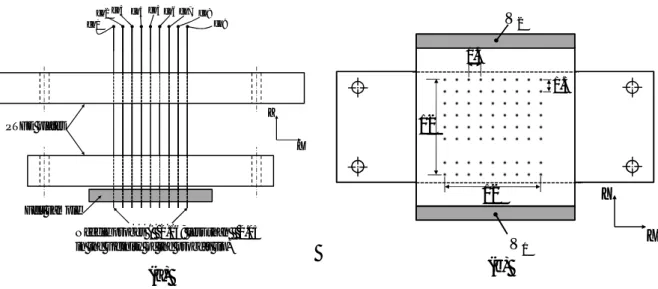
To address these challenges, the voltage probe is manufactured as an array of electrodes with a diameter of 160 µm at the shaft and less than 50 µm in the vicinity of the tip, as depicted in figure 4. The used electrodes are needles made in surgical stainless steel with copper handle [31]. The electrodes are mechanically maintained with two PTFE plates (thickness = 5 mm) in which 8 9 counterbore holes ( 1 mm– 200 µm and depth = 2 mm) are machined and epoxy resin is used as a bonder. The second PTFE plate ensures the vertical alignment of the electrodes so that they can be inserted perpendicularly in the felt sample. The spacing between neighbouring electrodes is 1.5 mm and the voltage probe covers an overall area of 12 12 mm². In addition, PTFE is an excellent electrical insulator, which is able to withstand an electrical potential difference of several kilovolts (dielectric strength = 50–170 kVmm–1 [32]).
The final prototype of the voltage probe consists of an array of 8 9 needles rigidly fixed to the two PTFE plates through its holes while being perpendicular to each plate, thereby realizing a ‘fakir board’-like structure. The upper part of each individual electrode probe (in copper material) emerging from the upper PTFE plate is electrically isolated from its neighbours by incorporating it in a PTFE sheath. The felt sample area that can be mapped is 12 12 mm². In order to determine the electric potential distribution, the potential of each electrode is measured against of the potential of the silver painted electrodes (located at extremities of the sample) used as reference electrode (here, 0V).
A major point of the design is to ensure that the probe array has much larger resistance than the equivalent source resistance of the felt sample, to prevent any loading error. The procedure and results of the measurement of the electrical insulation resistance between pairs of neighbouring electrodes are reported in figure 5. As can be seen, the resistances are always larger than 860 G. Such value is almost two orders of magnitude larger than the typical electrical resistance of the investigated felt samples, which does not exceed 12 G (i.e., the electrical resistance of sample A with length, width, and thickness equal to 25 mm, 30 mm, and 2 mm, respectively). Hence, the loading error caused by the finite electrical resistance of the probe holder is always smaller than 1.4%.
6
3.2. Electrical circuit
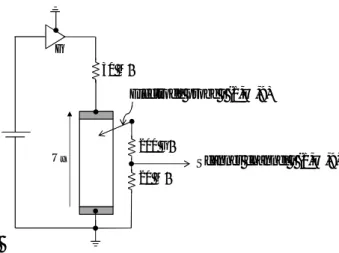
The measuring circuit is shown in figure 6. The electrical potentials of each of the 8 9 probes are recorded individually while the sample is connected to a voltage source of several kV, obtained by applying the DC voltage supply of an electrometer Keithley 6517B to a TREK power amplifier (model 20/20A). The DC voltage applied to the sample is denoted Ux. The resistor 30 M is placed in series
with the source to protect the high-voltage generator. A low current Keithley 6522 scanner board is used to automatically record the electric potentials of 9 electrodes in a given column; the scan speed is 1.5 channels s–1. The next column of 9 electrodes is then connected mechanically to the scanner board for the following measuring sequence and the process is repeated until all columns are recorded. The scanner is connected only to 9 electrode probes during the same experiment, and the remaining 63 electrode probes are not connected to the scanner. Besides, a set of voltage dividers made with precision resistances (200 G–20 M) allows the signal to be attenuated by a factor of 104 in order to respect the input voltage rating of the input scanner board. The voltage dividers allow not only the application of higher voltages, but also increase the input resistance to about 200 G which is clearly higher than the value of the input impedance of the scanner 6522 (a few GThe loading error caused by the input resistance of the voltage divider is then 6% for a source resistance of 12 G and decreases with decreasing source resistance.
In addition, current-voltage (I‒V) curves were recorded by connecting the considered felt sample to the voltage source of the electrometer Keithley 6517B. The voltage between the electrodes of the considered felt sample can be then swept between 5 and 1000 V. The current is measured by the ammeter of the same electrometer Keithley 6517B. A 1 MΩ protection resistor is placed in series with the felt sample. The electrometer and the scanner are controlled using a GPIB USB-HS board connected to a personal computer running NI LabVIEW®. All measurements are carried out in a shielded climate chamber. The relative humidity and the temperature are monitored with sensors positioned in the close vicinity of the felt sample.
4. Results and discussion
In order to test and validate the developed voltage probe for determining the electric potential distribution at the mesoscopic scale, the two felt samples A and B described in Sec. 2 are considered. In the following experiments, electric potential mappings are carried out at several applied voltages. For all samples, the overall measurement time at every applied voltage Ux is less than 20 min; the
dwell time between measurements is 1 s; the dwell time between two consecutive columns is less than 3 min; 5 successive measurements are made at each voltage level and in each electrode probe and an arithmetic voltage is taken to construct the potential distribution. After a change in voltage, the settling
7 time allowed before taking the first measurement point is 10 s. In the measurements of electric potential distribution described below, the voltage was ramped up to the maximum voltage Umax and
then decreased to 0. In each experiment, the samples are conditioned during 24 hours at a relative humidity of 45%–46% and at a temperature of 21 °C–22 °C. In view of clarity, data are normalized by dividing the measured potential values by the applied DC voltage Ux.
In addition to measurements performed with the electrode array sensor, I‒V curves were taken on samples from the felt material containing conductive fibers (sample B) for several cycles of applied voltage.
4.1. Felt sample without conductive fibers
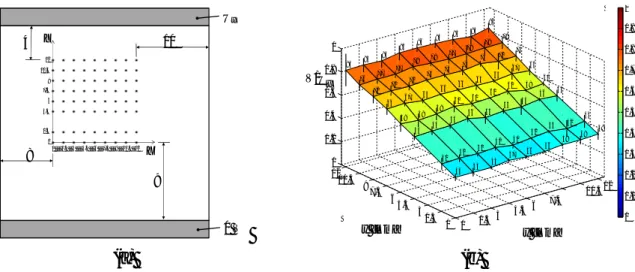
The experiment is first carried out on sample A containing polyester fibers only. Its length, width, and thickness are 25 mm, 30 mm, and 2 mm, respectively. Figure 7(a) shows the 72 locations within the 12 12 mm² area of the voltage probe. The corresponding average potential distribution is shown in figure 7(b) for the external applied DC voltage Ux = 6.2 kV. As can be seen, the resulting potential
distribution is consistent with the linear distribution that is expected for an ohmic and homogeneous medium with uniform electric resistivity, as is the case for sample A. These results demonstrate the ability of the voltage probe to measure the potential distribution in the felt sample subjected to high voltages (up to 6.2 kV).
4.2. Felt sample containing conductive fibers
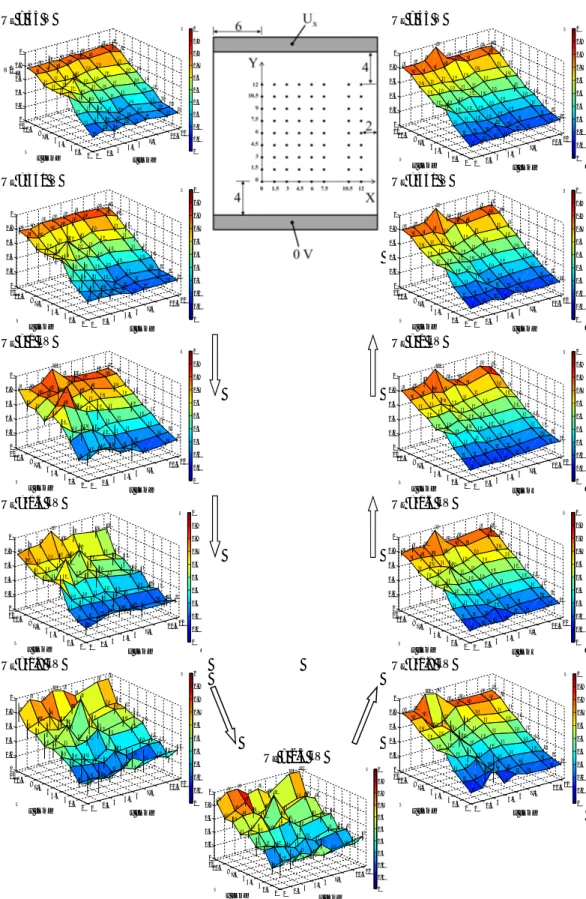
A similar measurement is now carried out on the felt sample containing both polyester fibers and stainless steel fibers at 2% weight (sample B). Its length, width, and thickness are 20 mm, 20 mm, and 2 mm, respectively. The applied voltage Ux is varied in two sweeps, first from 45 V to 2.3 kV and then
back from 2.3 kV to 45 V. The results are shown in figure 8.
During the increasing voltage sweep, it can be observed that the measured potential distribution becomes more and more irregular with increasing applied voltage Ux. While the voltage distribution is
almost linear for Ux = 45 V, several electric potential peaks appear for higher values of Ux. Note that
such peaks cannot be observed for the metal-free material (sample A). These peaks are thus likely to be caused by electrical discharges caused by the stainless steel fibers. As the applied voltage is decreased, the peaks disappear, which gives rise to a voltage distribution which is generally smoother than for increasing voltages. This result gives evidence that the activity of electrical discharges between fibers is somewhat reduced after the material has experienced a large electric field.
8 In order to investigate the difference between the potential distribution recorded during the raising sweep (Ux = 45 V to 2.3 kV) and that recorded during the decreasing sweep (Ux = 1.9 KV to 45 V), we
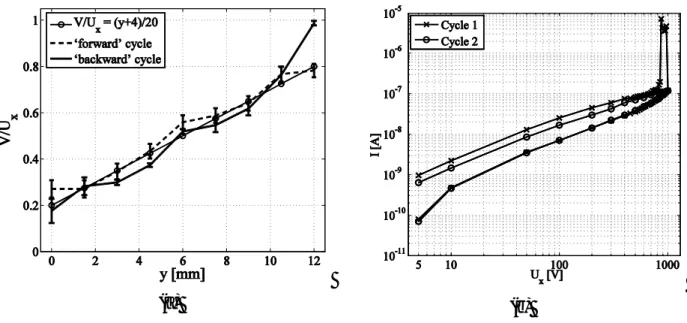
compare the potential distribution along the line x = 4.5 mm for an applied voltage of 45 V in two different situations: (a) for a virgin sample which has never been subjected to a higher voltage, and (b) for a sample which has previously been subjected to a sweep of voltages raising up to 2.3 kV. The results are shown in figure 9 and compared with what would be expected in a perfectly ohmic sample, i.e., to a linear distribution between the two silver painted electrodes (and therefore a linear distribution between 9 V and 36 V in the area covered by the microprobe, or 60% of the total voltage). It can be observed that the measured distributions in both raising and decreasing sweeps are close to this linear distribution except for the presence of a peak at x = 4.5 mm, y = 12 mm. This peak is likely due to an electrical contact between the electrode probe and a conductive fiber. As the peak potential is equal to Ux, we can deduce that this conductive fiber is in electrical contact with the high voltage
electrode. One possible explanation of this behaviour is that the large electric field in such soft felt material has produced some mechanical displacement of the stainless steel fibers. The observation that both voltage distributions at 45V are very similar to each other points to the fact that the characterization of voltage distribution on such felt samples should be carried out preferentially at high voltages, as can be allowed by the probe described in the present paper.
In order to investigate the nature of the irreversible changes which have occurred due to the application of high voltages to a felt with conductive fibers, we have performed I‒V measurements for several samples of felt B (5 5 cm²) during two cycles of applied voltage. A typical result is shown in figure 9(b) which shows the logarithmic plots of the resulting I‒V curves. The arrows indicate the sweeping directions. In cycle 1, the current increases with the increasing voltage sweep following almost Ohm’s law up to approximately 700 V. Then, the current rises sharply from ~0.13 µA to ~7 µA at a threshold voltage of about 800 V (The sharp increase is only observed when the maximum voltage of the cycle exceeds this threshold.) During the decreasing voltage sweep, the current decreases continuously; the descending branch is always found to lie below the ascending one. In cycle 2, the
I‒V curve exhibits almost the same behaviour as in cycle 1 except the sharp current rise that
disappeared. These I‒V characteristics are likely to be due to the electrical discharges that occurred between the conductive fibers. Such a measurement reveals an irreversible behaviour above the threshold voltage whereas the rest of the curve appears to be reproducible from cycle to cycle. In addition, the occurrence of these irreversible changes in samples of felt B generally depends on their size and on the orientation of their conductive fibers.
9 5. Conclusions
An original voltage probe for measuring the electric potential distribution at the mesoscopic scale in the antistatic felts has been designed, developed and tested. In contrast to a classical technique based on a ‘moving’ single electrode probe, the developed voltage probe is based on ‘fixed’ electrode probes with an interelectrode distance of 1.5 mm. The electric potential of each one of the 72 electrodes within an area of 12 12 mm² in two polyester fiber-based felt samples (containing or not conductive fibers) has been successfully measured for several applied voltages (up to 6.2 kV). We conclude that the developed probe voltage is a promising technique that could be used for the assessment of the conduction mechanisms in the antistatic materials at the mesoscopic scale.
Acknowledgments
This work is part of a project supported by the Walloon Region (Belgium) under contract no. 716683 (NEOCERAT) and was performed in a collaboration between Centexbel, University of Liège (ULg), Université Catholique de Louvain (UCL) and SIOEN Felt and Filtration (Liège, Belgium).We would like to thank P Harmeling (ULg), A Calderon (ULg), and J-F Arban (ULg) for their technical assistance. We also would like to thank V Beauvois (ULg) and Professor J Destiné (ULg) for allowing us to use their respective laboratory facilities.
References
[1] Glor M 2003 Ignition hazard due to static electricity in particulate processes Powder Technol. 135– 136 223–233.
[2] Kathirgamanathan P, Toohey M J, Haase J, Holdstock P, Laperre J and Schmeer-Lioe G 2000 Measurements on incendivity of electrostatic discharges from textiles used in personal protective clothing J. Electrostat. 49 51–70
[3] Going J E and Lombardo T 2007 Dust collector explosion prevention and control Process Saf.
Prog. 26 164–176
[4] Blakemore J E 1974 Static Electricity in Carpets Text. Res. J. 44 459–463
[5] Classen E, Schubert M, Beringer J, Vogel C and Niemz F-G 2009 Developing new types of conductive structures to optimize antistatic textiles—Part 2 Tech. Text. 2 E57
[6] Boutaayamou M, Léonard A, Vanderheyden B and Vanderbemden P 2011 Study of conduction mechanisms in antistatic felts at the mesoscopic scale Int. Symp. on New Frontiers in Fiber
Materials Science (Charleston, SC, USA, 11–13 Oct.)
[7] Standard DIN 54345–5 1985 Testing of textiles; electrostatic behaviour; determination of electrical restistance of strips of textile fabrics Deutsches Institut Fur Normung EV (German
10 [8] Standard ISO 10965:2011 Textile floor coverings; determination of electrical resistance
International Organization for Standardization
[9] Standard DIN EN 1149–3 2004 Protective clothing; electrostatic properties; part III: test methods for measurement of charge decay DIN-adopted European Standard in English (German)
[10] Lemaire P 2004 Evaluation of antistatic effectiveness of filters without global conductivity 6th
Int. Symp. EL-TEX on Electrostatic and Electromagnetic Fields—New Materials and Technology (Łódź, Poland)
[11] Greason W D 2004 Measurement methods in electrostatics applications: review and trends
Electrostat. 2003, Morgan H (Ed.), Taylor & Francis 315–324
[12] Vosteen W E 1984 A review of current electrostatic measurement techniques and their limitations
Conf. on Electrical Overstress Exposition (San Jose, CA, USA, 24–26 April)
[13] Molinie P 2012 A review of mechanisms and models accounting for surface potential decay IEEE
Trans. Plasma Sci. 40 167–176
[14] McIlhagger D S 1969 Simultaneous measurement of surface temperature and potential distribution over electrically stressed high-voltage insulators J. Sci. Instrum. 2 741–2
[15] Noras M A 2002 Non-contact surface charge/voltage measurements fieldmeter and voltmeter methods, Trek Application note 3002, www.trekinc.com/library/
[16] Noras M A 2002 Non-contact surface charge/voltage measurements: capacitive probe—principle of operation, Trek Application note 3001, www.trekinc.com/library/
[17] Rivenc J, Lebey T, Loubière A, Biron M and Warnant J 1998 A discussion of current-voltage and surface potential measurements to stress grading materials J. Phys. D:Appl. Phys. 31 2612–21 [18] Zhu Y, Takada T, Sakai K and Tu D 1996 The dynamic measurement of surface charge
distribution deposited from partial discharge in air by Pockels effect technique J. Phys. D: Appl.
Phys. 29 2892–900
[19] Kumada A, Chiba M and Hidaka K 1998 Potential distribution measurement of surface discharge by Pockels sensing technique J. Appl. Phys. 84 3059–65
[20] Beardsmore-Rust S T, Watson P, Prance R J, Harland C J, Prance H 2009 Imaging of charge spatial density on insulating materials Meas. Sci. Technol. 20 095711
[21] Watson P, Prance R J, Beardsmore-Rust S T, Prance H 2011 Imaging electrostatic fingerprints with implications for a forensic timeline Forensic Sci. Int. 209 e41–45
[22] Nonnenmacher M, O'Boyle M P and Wickramasinghe H K 1991 Kelvin probe force microscopy
Appl. Phys. Lett. 58 2921–3
[23] Cheran L-E, Johnstone S, Sadeghi S and Thompson M 2007 Work function measurement by high-resolution scanning Kelvin nanoprobe Meas. Sci. Technol. 18 567
11 [24] Mélin T, Barbet S, Diesinger H, Théron D and Deresmes D 2011 Note: Quantitative
(artifact-free) surface potential measurements using Kelvin force microscopy Rev. Sci. Instrum. 82 036101 [25] Machleidt T, Sparrer E, Kapusi D and Franke K-H 2009 Deconvolution of Kelvin probe force
microscopy measurements—methodology and application Meas. Sci. Technol. 20 084017
[26] Yin J and Nysten B 2010 Charge dissipation in antistatic felts: an atomic force microscopy study
18th Int. Vacuum Cong. —IVC18 (Beijing, China 23–27 August, 2010)
[27] Singha K, Maity S, Singha M, Paul P and Gon D P 2012 Effects on fiber diameter distribution on nonwoven fabrics on its properties Int. J. T. Sci. 1 7–14
[28] Biron M, Warnant J, Vanderschueren H W, Krecke M and Goffaux R 1997 Correlation between direct surface potential measurements by electrostatic voltmeter and indirect method based on an electrical transmission line with distributed parameters J. Electrostat. 40–41 407–12
[29] Sposito G, Cawley P, Nagy P B 2010 Potential drop mapping for the monitoring of corrosion or erosion NDT & E Int. 43 394–402
[30] Vassiliadis S G, Provatidis C G 2004 Structural characterization of textile fabrics using surface roughness data Int. J. Clothing Sci. Tech. 16 445–57
[31] 2009 www.marcopolo-direct.com [32] 2010 www.goodfellow.com
12 x-y V Y X Z Felt sample (polyester fibers
+ stainless steel fibers)
Array of probes
Figure 1. Array of probes for the measurement of the distribution of the electrical potential at different locations in the felt sample subjected to a DC electric potential difference.
13 12 µm Stainless steel conductive fibers ( 12 µm) Polyester fibers ( ) 12 µm 12 µm 200 µm (a) 3 cm 3 cm 2 mm (b)
Figure 2. (a) Felt sample B with polyester fibers and stainless steel conductive fibers (weight percentage of 2%). (b) Felt sample B with the silver painted electrodes located at its extremities.
Felt sample L w h (a) (b) (c)
Figure 3. (a) Geometry of felt samples A and B with length L, width w, and thickness h. Variation of the DC electrical resistance of (b) sample A and (c) sample B vs. the varying geometrical parameters (L, w), the lines being the linear interpolation of experimental data. The dimensions of L and w are in cm, and h = 2 mm.
14 Z X ch8 ch9 ch1 ch2 ch3 ch4 ch5 ch6 ch7 PTFE plates Felt sample . . . .
Needle probes ( 0.16; less than 0.05 in the vicinity of the probe’s tip)
(a) z V2 V1 Y X 12 1.5 1.5 12 (b)
Figure 4. Schematics of the voltage probe: (a) front view and (b) bottom view. The felt sample can be inserted perpendicularly to the electrode probe array. All dimensions are in mm.
15 2 4 5 6 8 7 1 3 10 12 13 14 16 15 9 11 18 20 21 22 24 23 17 19 26 28 29 25 27 31 33 34 35 37 36 30 32 39 41 42 43 45 44 38 40 47 49 50 51 53 52 46 48 55 57 58 54 56 60 62 63 64 66 65 59 61 68 70 71 72 74 73 67 69 76 78 79 80 81 82 75 77 84 86 87 83 85 89 91 92 93 95 94 88 90 97 99 100 101 103102 96 98 105 107 108 109 110 111 104 106 113 115 116 112 114 118 120 121 122 124 123 117 119 126 128 129 130 132 131 125 127 134 136 137 138 140 139 133 135 142 144 145 141 143 147 149 150 151 153 152 146 148 155 157 158 159 161160 154 156 163 165 166 167 168 169 162 164 171 173 174 170 172 176 178 179 180 182 181 175 177 184 186 187 188 190 189 183 185 192 194 195 196 198 197 191 193 200 202 203 199 201 205 207 208 209 211 210 204 206 213 215 216 217 219218 212 214 221 223 224 225 226 227 220 222 229 231 232 228 230 234 233 235 236 237 238 239 (a) (b)
Figure 5. (a) Illustration of the procedure for measuring the electrical resistance between pairs of neighbouring electrodes. The arrows between electrode probes indicate the considered pairs of neighbouring electrodes. The measurements are ordered according to the numbers, 1, 2, …, 239, associated to these arrows. (b) Results of the electrical insulation resistance measurements which were performed with the electrometer 6517B using the constant voltage method (the value of the applied voltage source was 500 V).
16 Electrode probe i (1,…,9) 200 GΩ 20 MΩ 30 MΩ G Scanner channel i (1,…,9) Ux
17 12 10.5 9 7.5 6 4.5 1.5 0 0 1.5 3 4.5 6 7.5 9 10.5 12 9 4 10 8 Ux 0 V X Y (a) 0 1.5 3 4.5 6 7.5 10.512 0 1.5 3 4.5 6 7.5 9 10.5 12 0 0.2 0.4 0.6 0.8 1 38 44 38 42 38 55 44 36 60 56 42 66 36 58 x [mm] 54 73 40 67 37 62 55 79 72 42 65 35 60 86 53 78 75 41 65 35 60 83 56 78 73 42 66 35 61 84 54 77 73 41 66 59 85 54 78 73 65 58 86 53 79 72 67 59 86 y [mm] 77 72 66 83 77 72 83 76 83 V/Ux 0 0.1 0.2 0.3 0.4 0.5 0.6 0.7 0.8 0.9 1 (b)
Figure 7. (a) Tested polyester felt sample with no conductive fibers (sample A) and the 12 12 mm² region covered by the voltage probe (all dimensions are in mm). (b) Measured electrical potential distribution for Ux = 6.2 kV. The z axis values in the graphic are normalized to the applied voltage Ux.
18 Ux = 45 V Ux = 45 V Ux = 430 V Ux = 430 V Ux = 1 kV Ux = 1 kV Ux = 1.3 kV Ux = 1.3 kV Ux = 1.9 kV Ux = 1.9 kV Ux = 2.3 kV 0 1.5 3 4.56 7.5 10.512 0 1.5 3 4.5 6 7.5 9 10.5 12 0 0.2 0.4 0.6 0.8 1 24 27 23 29 26 41 31 26 47 40 31 57 23 49 x [mm] 37 64 27 59 27 45 75 29 66 27 22 53 80 44 80 35 29 62 27 52 82 43 39 69 33 58 21 56 48 78 43 68 33 59 53 79 53 81 43 64 72 62 81 65 77 63 62 63 78 y [mm] 75 66 63 80 75 65 78 76 79 V/Ux 0 0.1 0.2 0.3 0.4 0.5 0.6 0.7 0.8 0.9 1 0 1.5 3 4.5 6 7.5 10.512 0 1.5 3 4.5 6 7.5 9 10.5 12 0 0.2 0.4 0.6 0.8 1 21 24 19 30 25 40 33 19 44 39 25 55 21 46 x [mm] 32 63 22 57 18 41 74 30 64 28 19 49 79 39 78 30 22 59 19 47 81 37 32 67 24 53 16 52 40 76 35 61 25 55 48 79 42 82 34 62 58 48 80 52 76 65 58 51 99 y [mm] 76 65 60 84 75 67 82 78 83 0 0.1 0.2 0.3 0.4 0.5 0.6 0.7 0.8 0.9 1 0 1.5 3 4.5 6 7.5 10.512 0 1.5 3 4.5 6 7.5 9 10.5 12 0 0.2 0.4 0.6 0.8 1 21 24 21 25 24 37 28 21 43 37 25 54 19 45 x [mm] 31 61 23 56 24 40 72 24 63 24 25 51 78 39 78 31 27 61 26 48 81 40 36 69 30 56 25 54 44 80 39 63 34 58 52 83 49 79 43 62 73 58 82 66 78 64 59 64 82 y [mm] 77 61 64 82 71 65 78 76 80 0 0.1 0.2 0.3 0.4 0.5 0.6 0.7 0.8 0.9 1 0 1.5 3 4.5 6 7.5 10.512 0 1.5 3 4.5 6 7.5 9 10.5 12 0 0.2 0.4 0.6 0.8 1 20 24 19 31 24 40 33 18 46 39 24 57 21 47 x [mm] 31 65 21 58 16 40 77 30 65 26 20 49 83 38 79 26 24 59 18 47 83 34 36 66 23 53 15 47 43 76 33 61 25 50 51 78 42 79 34 56 60 51 79 56 68 64 60 54 99 y [mm] 76 66 60 85 75 67 81 78 82 0 0.1 0.2 0.3 0.4 0.5 0.6 0.7 0.8 0.9 1 0 1.5 3 4.5 6 7.5 10.512 0 1.5 3 4.5 6 7.5 9 10.5 12 0 0.2 0.4 0.6 0.8 1 24 29 22 35 28 45 35 19 51 42 26 61 27 51 x [mm] 36 68 24 61 27 45 78 36 67 26 38 56 80 45 77 40 31 67 38 60 79 39 52 75 30 66 29 69 62 47 81 52 72 24 59 70 81 48 82 44 96 79 85 60 70 81 73 68 100 y [mm] 79 78 56 85 77 66 79 66 83 0 0.1 0.2 0.3 0.4 0.5 0.6 0.7 0.8 0.9 1 0 1.5 3 4.5 6 7.5 10.512 0 1.5 3 4.5 6 7.5 9 10.5 12 0 0.2 0.4 0.6 0.8 1 22 26 23 30 27 40 34 20 46 43 25 57 20 51 x [mm] 32 64 24 62 16 41 76 32 69 26 17 50 82 42 84 31 24 59 17 50 88 40 36 65 24 56 16 51 47 75 35 63 26 55 55 77 45 79 36 60 63 48 81 52 73 67 60 51 100 y [mm] 78 65 61 86 76 66 81 75 83 0 0.1 0.2 0.3 0.4 0.5 0.6 0.7 0.8 0.9 1 0 1.5 3 4.5 6 7.5 10.512 0 1.5 3 4.5 6 7.5 9 10.5 12 0 0.2 0.4 0.6 0.8 1 25 19 24 30 21 27 32 24 44 30 22 39 28 43 x [mm] 34 50 22 45 31 32 52 32 54 26 31 49 81 38 54 34 22 49 24 52 81 36 35 59 60 23 58 20 55 38 35 79 24 52 49 86 39 64 34 61 80 61 80 63 66 61 53 65 99 y [mm] 68 60 59 85 66 63 83 72 79 0 0.1 0.2 0.3 0.4 0.5 0.6 0.7 0.8 0.9 1 0 1.5 3 4.5 6 7.5 10.512 0 1.5 3 4.5 6 7.5 9 10.5 12 0 0.2 0.4 0.6 0.8 1 21 26 21 33 27 41 36 20 46 42 26 57 23 50 x [mm] 35 64 24 61 17 43 75 33 67 30 19 52 81 41 80 29 22 62 19 49 84 37 33 68 25 55 16 50 42 75 35 62 26 54 50 80 46 79 36 59 69 55 80 58 72 65 63 56 99 y [mm] 74 67 61 81 76 65 83 75 80 0 0.1 0.2 0.3 0.4 0.5 0.6 0.7 0.8 0.9 1 0 1.5 3 4.5 6 7.5 10.512 0 1.5 3 4.5 6 7.5 9 10.5 12 0 0.2 0.4 0.6 0.8 1 26 41 40 41 30 40 42 21 38 57 38 60 47 52 x [mm] 35 66 27 57 35 35 68 45 69 25 28 51 96 43 68 33 21 51 32 64 96 31 36 5961 24 63 27 52 37 38 95 23 48 49 85 40 76 40 56 73 53 96 48 62 62 56 53 100 y [mm] 75 65 52 89 71 63 96 65 83 0 0.1 0.2 0.3 0.4 0.5 0.6 0.7 0.8 0.9 1 0 1.5 3 4.5 6 7.5 10.512 0 1.5 3 4.5 6 7.5 9 10.5 12 0 0.2 0.4 0.6 0.8 1 22 25 20 29 25 39 32 21 45 39 27 57 24 48 x [mm] 35 64 25 58 16 44 76 34 63 26 40 54 81 42 76 27 28 64 18 50 80 35 43 69 23 56 15 46 43 79 33 62 25 50 60 80 43 80 34 55 66 51 81 54 66 67 61 52 97 y [mm] 59 68 61 100 78 67 81 78 82 0 0.1 0.2 0.3 0.4 0.5 0.6 0.7 0.8 0.9 1 0 1.5 3 4.56 7.5 10.512 0 1.5 3 4.5 6 7.5 9 10.5 12 0 0.2 0.4 0.6 0.8 1 29 46 43 46 30 41 46 25 38 59 44 54 51 57 x [mm] 40 71 30 54 29 40 34 66 49 78 46 51 100 43 69 39 28 49 41 64 100 33 44 5764 32 65 35 60 40 48 91 26 48 58 79 44 66 48 60 74 58 91 47 59 74 58 60 87 y [mm] 85 73 55 99 76 68 98 68 87 0 0.1 0.2 0.3 0.4 0.5 0.6 0.7 0.8 0.9 1
Figure 8. Electrical potential distribution in the felt sample with the randomly inserted conductive fibers (sample B) for a voltage difference Ux varied from 50 V to 2275 V and from 2275 to 50V. The z
19
(a) (b)
Figure 9. (a) Comparison of raising and decreasing sweeps along the line x = 4.5 mm for Ux = 45 V.
The solid line shows the linear potential distribution which would be expected for an homogeneous ohmic material (i.e., V(y)/Ux = (y+4) / 20). (b) I‒V curves taken from a felt sample B during two