HAL Id: hal-02100702
https://hal.archives-ouvertes.fr/hal-02100702
Submitted on 16 Apr 2019
HAL is a multi-disciplinary open access
archive for the deposit and dissemination of
sci-entific research documents, whether they are
pub-lished or not. The documents may come from
teaching and research institutions in France or
abroad, or from public or private research centers.
L’archive ouverte pluridisciplinaire HAL, est
destinée au dépôt et à la diffusion de documents
scientifiques de niveau recherche, publiés ou non,
émanant des établissements d’enseignement et de
recherche français ou étrangers, des laboratoires
publics ou privés.
Comparison of K-means and GMM methods for
contextual clustering in HSM
Zhiqiang Wang, Catherine da Cunha, Mathieu Ritou, Benoit Furet
To cite this version:
Zhiqiang Wang, Catherine da Cunha, Mathieu Ritou, Benoit Furet. Comparison of K-means and
GMM methods for contextual clustering in HSM. Procedia Manufacturing, Elsevier, 2019, 7th
Inter-national conference on Changeable, Agile, Reconfigurable and Virtual Production (CARV2018), 28,
pp.154-159. �10.1016/j.promfg.2018.12.025�. �hal-02100702�
ScienceDirect
Procedia Manufacturing 00 (2019) 000–000www.elsevier.com/locate/procedia
2351-9789 © 2019 The Authors. Published by Elsevier B.V.
This is an open access article under the CC BY-NC-ND license (https://creativecommons.org/licenses/by-nc-nd/4.0/)
Peer-review under responsibility of the scientific committee of the International Conference on Changeable, Agile, Reconfigurable and Virtual Production.
International Conference on Changeable, Agile, Reconfigurable and Virtual Production
Comparison of K-means and GMM methods
for contextual clustering in HSM
Zhiqiang Wang
a,*, Catherine Da Cunha
b, Mathieu Ritou
a, Benoît Furet
aaLaboratoire des Sciences du Numérique de Nantes (LS2N, UMR CNRS 6004), Université de Nantes, 2 av. J Rouxel, 44 475 Carquefou, France bLaboratoire des Sciences du Numérique de Nantes (LS2N, UMR CNRS 6004), Ecole centrale de Nantes, 1 rue de la Noe, 44321 Nantes, France
Abstract
High speed machining (HSM) is widely used for the manufacturing of aircraft structures, turbine blades, etc. It greatly increases the efficiency and automation for the machining. However, in HSM, operators cannot detect incidents when they manage several machines of a production cell. Robust monitoring systems are required to protect the machine tool and the high value added parts. In the global context of the Industry 4.0, abundant digital data is available in a modern manufacturing company and could be used to turn the machines-tools smarter and to support the decision making of the operational management.
One of the first step of data mining approach is the accurate selection of relevant. To do so, the raw data need to be classified into different contextual clusters. This paper compares two different methods of the unsupervised classification of machining context: K-means and GMM (Gaussian Mixture Model). It was found that GMM method can classify correctly the machining context, whereas K-means is not suitable.
© 2019 The Authors. Published by Elsevier B.V.
This is an open access article under the CC BY-NC-ND license (https://creativecommons.org/licenses/by-nc-nd/4.0/)
Peer-review under responsibility of the scientific committee of the International Conference on Changeable, Agile, Reconfigurable and Virtual Production.
Keywords: HSM; Industry4.0; clustering; K-means; GMM
1. Introduction
Compared with the traditional machining, high speed machining (HSM) has greatly increased the cutting speeds. However, in HSM, the operator cannot detect incidents when he manages several machines of a production cell. Moreover, he has not enough time to rapidly stop the machine. Consequently, monitoring systems are required to
* Corresponding author. Tel.: +33-771235964; fax: +33-240376952.
Zhiqiang WANG et al./ Procedia Manufacturing 00 (2019) 000–000 2
protect the machine tool and the high value added parts. Especially in aeronautic parts manufacturing, those aeronautic pieces are high added value parts. To guarantee the quality of the surface of the parts, and to avoid the tool broken and prevent the great chatter. ([1] presents the link between the quality of surface and chatter), a smart machining monitoring system need to be set up. [2] presents a review of the state-of-the-art methods employed for conducting tool condition monitoring (TCM) in milling processes including sensors, feature extraction, and monitoring models.
Abundant digital data is available in a modern manufacturing company and could be used to turn the machines-tools smarter and to support the decision making of the operational management [3]. Data and data analytics are considered ever more important in manufacturing. [4] discusses the current situation exhibited in machine tool data analytics in manufacturing, and proposes a holistic approach to machine tool data analytics in order to tackle some of the identified shortcomings of current practices. During data analytics, the objective is to set up the adaptive criterions (KPI) and calculate the threshold for every criterion. Some algorithms will be used to exploit these criterions and thresholds. Data mining has been widely used in manufacturing. [5] Uses data mining to improve the products quality in assembly production. [6] presents an in-process tool wear prediction method based on deep learning CNN (Convolutional Neural Network). [7] presents a method that uses a support vector machine (SVM) as a machine learning approach to model the obtained process data. There are some other algorithms in machine learning which can be used in manufacturing data mining, ex. K-means [8]. Also, there are some Statistics algorithms interesting for our database, such as Gaussian mixture models GMM [9]. Next chapter will introduce the methods for the data analytics and how it will be used to the monitoring system for the machine-tool.
2. Proposed approach
LS2N has developed Emmatools during the UsinAE project (Fig.1). It collects the data from the CNC (Computer Numerical Control) and from additional sensors like accelerometers, every 0.1s. This project finally led to the creation of criteria (SBBPFO or SBN) to analyse wear variations at different time scales [10]. Then, Godreau et al. [11] proposed 3 criterions to detect defects during machining: chatter; tool breakage; and collision.
Fig. 1. Emmatools for process monitoring and data collection.
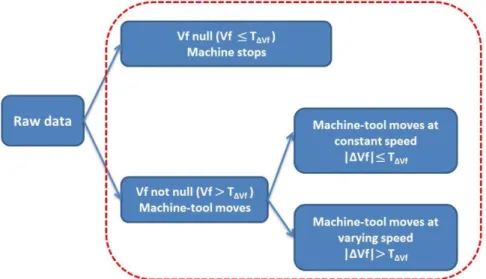
Abundant digital data have been collected by Emmatools. As cited in [12], data clustering is very important at the beginning of data mining. There are some criterions have been calculated in different clusters. For example, criterion of chatter is calculated in cluster when tool is cutting materials; while criterion of tool breakage is calculated when tool is out of materials [11]. A better selection of data is better for a more relevant calculation of criterions (KPI). For example, the tool cuts materials only when the machine-tool is not stopped (i.e. feed rate (Vf) of spindle is not null). Also, when tool is cutting materials, the tool must be rotating. Eventually, the machine-tool can (de)accelerate. The varying Vf involves varying cutting conditions. Therefore, classifying the raw data by the feed rate Vf (m/min) into three clusters is necessary: the machine-tool can be stopped or moving at constant or varying speed.
The Fig.2 represents the flow chart how to classify the raw data. A criterion for classification is set up:
Temperatures VIBRATIONS POWER MACHINING CONTEXT CNC & PLC Acquisition card Computer for data collect
symmetric ΔVf. It is equal to the half of the difference between the Vf the time after and the Vf the time before (∆𝑉𝑓 =𝑉𝑓𝑛+1−𝑉𝑓𝑛−1
2 ). And the objective is to find the threshold TΔVf which can define which data belongs to
machine-tool moving at constant speed and which data belongs to machine-tool moving at varying speed. Moreover, the data whose Vf are less than the threshold TΔVf will be considered as Vf null (machine-tool stops) in industry.
Which means, firstly, the data whose spindle feed rate Vf less than TΔVf is to be found, and is labelled ‘Vf null’
(machine-tool stops). And then, the data whose Vf bigger than TΔVf, is labelled ‘Vf not null’. And in the cluster ‘Vf
not null’, the data whose ΔVf less than threshold TΔVf is to be found, and is labelled ‘machine-tool moves at constant
speed’. Also in the cluster ‘Vf not null’, the data whose ΔVf bigger than threshold TΔVf is labelled ‘machine-tool
moves at varying speed’. See the Fig.2.
Fig. 2. Process of classification according the Feed rate Vf and ΔVf
3. K-means
To classify the machine-tool context information into 3 clusters, an unsupervised machine learning method named K-means may be helpful. K-means clustering aims at partitioning n observations into k clusters in which each observation belongs to the cluster with the nearest mean, serving as a prototype of the cluster [8]. There are three clusters: machine-tool stops; machine-tool moves at constant or varying speed. The data during one day from an aircraft company was taken for example. Firstly, the data with Vf equal to 0 m/min were removed from the selection. And the K-means was applied for the ΔVf (m/s²) for this given day. The threshold of machine-tool moving at constant or varying speed locates on the boundary between two clusters: TΔVf =1 (m/s²). The performance
of this classification can be tested by manual mining of feed rate Vf classification in 3 clusters, by detecting the errors of classification. Fig.3 illustrates the results of contextual classification of Vf, during a period of 30s. The Vf is labeled with different colors according to their clusters. Machine-tool stops are presented by green diamond; Machine-tool moving at constant speed are presented by red asterisk while machine-tool moving at varying speed are presented by blue plus. It is found manually that, during the Vf acceleration, there are many red asterisk (cluster machine-tool moving at constant speed) in this acceleration period. Which means the machine-tool is accelerating while the K-means suppose that these points are in the cluster machine-tool moving at constant speed. And there are many other classification errors in the machine-tool moving at constant speed (cycle purple). It means the threshold found by K-means TΔVf = 1 (m/s²) is too high. In fact, there is a limitation when using K-means. K-means assumes
that it deals with spherical clusters and that each cluster has roughly equal numbers of observations. For this case, the distribution of ΔVf is not spherical. And there are much more population of ΔVf around zero, compared to other population. Which means K-means will partition the data where machine-tool moving at varying speed into the cluster machine-tool moving at constant speed. So other data clustering methods will be tested.
Zhiqiang WANG et al./ Procedia Manufacturing 00 (2019) 000–000 4
Fig. 3. Vf-T according to K-means classification during one day (zoom 30 seconds)
4. GMM classification
Gaussian mixture models (GMM) [9] are often used for data clustering. Usually, fitted GMMs cluster by assigning query data points to the multivariate normal components that maximize the component posterior probability given the data. Its advantage is showing how to fit a GMM to data, cluster using the fitted model, and estimate component posterior probabilities. In this case, the same data as in chapter 3 is to be used for example. The Vf=0 m/min was taken away too, and the same column ΔVf is created also. Then GMM was to be used to classify ΔVf into 2 clusters: machine-tool moves at constant speed, machine-tool moves at varying speed. Here, the density of probability of ΔVf during this day is drawn. There are 2 great populations of ΔVf: ΔVf around zero (Y1) which is fine and high; ΔVf distributed along the whole day (Y2) which is wide and low. Therefore, 2 Gaussian distributions are set up to model the true data. The sum of the probability of these 2 Gaussians along with the ΔVf (Y3) is drawn to be compared with our true density of probability of ΔVf (Histogram of ΔVf). The result is in Fig. 4: the abscissa X is ΔVf, the abscissa Y is the density of probability in scale linear. It is found that the sum of these 2 Gaussians modeled well our true data. Next step, the population of Y1 (fine and high) is supposed to follow the distribution Gaussian. To find the threshold of the machine-tool moving at constant speed or varying speed, the σ, 2 σ, 3 σ and 4 σ will be tested by drawing the Vf along with the time, and zoom a period of 30 seconds to analyze.
Fig. 4. Density of probability of ΔVf for one day modeled by GMM (2 Gaussians).
errors
5. Results and discussion
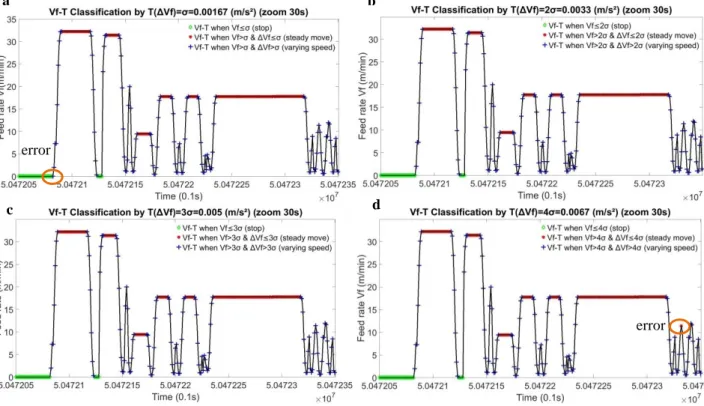
As the ΔVf within Y1 follows a normal distribution, the threshold TΔVf can be defined to be equal to σ, 2σ, 3σ
or 4σ. (While the mean of normal distribution μ = 0, and σ is the standard deviation of ΔVf within Y1). Because [-2σ, 2σ] represents the 95.45%, and [-3σ, 3σ] represents the 99.73% of all the data within Y1. For this day, the threshold TΔVf =2σ = 0.0033 m/s² and 3σ = 0.005 m/s² as well as 4σ = 0.0067 m/s². To verify which threshold is
the most suitable for this case, the feed rate Vf can be classified into 3 clusters by using these 3 thresholds. The same period 30s is always taken to be analyzed. Firstly, the classification by threshold T∆N=1σ= 0.00167 m/s² is tested. The result is in the Fig.5 (a): there is no wrong classification during acceleration which is better than the K-means method. However, just at the beginning of the acceleration, there is a blue plus point while it should be green. It is because the 1σis too small. And then the threshold 2σis tested in the Fig.5 (b): there is no wrong classification before and during acceleration which is better than 1σ. And then the threshold 3σis tested in the Fig.5 (c): classification by threshold 3σ is not better than that of 2σ. To confirm this threshold, the threshold 4σis tested in the Fig.5 (d): there is a classification error at the end of this 30s, during the varying speed Vf. It is because its ΔVf=0.0059<4σ, 4σsuppose that this point belongs to machine-tool moving at constant speed. 4σ is too big for threshold. Therefore, the threshold T∆N=2σ=0.0033 m/s² can be set as the threshold for this day’s data to classify
machine-tool stops and machine-tool moving at constant or varying speed. See the Fig.5.
Fig. 5. (a) Vf-T according to 1σ classification of ΔVf during 30 seconds; (b) Vf-T according to 2σ classification of ΔVf during 30 seconds; (c) Vf-T according to 3σ classification of ΔVf during 30 seconds; (d) Vf-T according to 4σ classification of ΔVf during 30 seconds;
6. Conclusion
Two methods of unsupervised machine learning, K-means and GMM, have been tested for contextual classification, based on the machine-tool feedrate, into 3 clusters: machine stopped; constant or varying move. The results are as below:
K-means is not suitable because the data is not spherical data (the population of ΔVf around zero is too large). However, GMM can classify the raw data well.
1 a b a c d a error error
Zhiqiang WANG et al./ Procedia Manufacturing 00 (2019) 000–000 6
According to GMM classification and statistical analyzes, the distribution of ΔVf in the Y1 population follows a normal distribution, the threshold can be defined as TΔVf = 2σ=0.0033m/s².
The data whose Vf is less than TΔVf is labeled as ‘machine-tool stopes’; the data whose Vf is greater than
2σ and its ΔVf is less than 2σ is labeled as ‘machine-tool moves at constant speed’; the data whose Vf and ΔVf are greter than 2σ is labeled as ‘machine-tool moves at varying speed’.
The threshold was chosen at 2σ by manual mining, through the verification of classification results. As the raw data has been classified into 3 clusters, the new KPIs can be calculated in each cluster in the
future. Such as, the tool will cut materials linear in the cluster ‘machine-tool moves at constant speed’ while the tool will cut materials in bending surface in the cluster ‘machine-tool moves at varying speed’. Acknowledgements
This research was funded by the French National Research Agency (ANR). We gratefully acknowledge for the financial support within the ANR SmarEmma project (ANR-16-CE10-0005).
References
[1] Godreau, V. (2017). Extraction des connaissances à partir des données de la surveillance de l'usinage.
[2] Zhou, Y., & Xue, W. (2018). Review of tool condition monitoring methods in milling processes. The International Journal of Advanced Manufacturing Technology, 1-15.
[3] Emeric O., Alexandre D., Le Julien D., Christophe D. Un Système à Base de Connaissances pour la gestion de données d’usinage dans une perspective de fouille de données. In : MUGV2018 et Manufacturing’21 Conf. Bordeaux, France ; 2018.
[4] Lenz, J., Wuest, T., & Westkämper, E. (2018). Holistic approach to machine tool data analytics. Journal of Manufacturing Systems.
[5] Da Cunha, C., Agard, B., & Kusiak, A. (2006). Data mining for improvement of product quality. International journal of production research, 44(18-19), 4027-4041.
[6] Martínez-Arellano, G., Terrazas, G., Benardos, P., & Ratchev, S., (2018). In-process Tool Wear Prediction System Based on Machine Learning Techniques and Force Analysis. In: 8th CIRP Conference on High Performance Cutting (HPC 2018). Budapest, Hungary; 2018. [7] Denkena, B., Dittrich, M. A., & Uhlich, F. (2016). Self-optimizing cutting process using learning process models. Procedia Technology, 26,
221-226.
[8] Julien JACQUES. Fouille de données / Data mining Université Lumière Lyon 2, 2001. 12. [9] Reynolds, D. (2015). Gaussian mixture models. Encyclopedia of biometrics, 827-832.
[10] De Castelbajac, C., Ritou, M., Laporte, S., & Furet, B. (2014). Monitoring of distributed defects on HSM spindle bearings. Applied Acoustics, 77, 159-168. 16.
[11] Godreau, V., Ritou, M., Chové, E., Furet, B., & Dumur, D. (2018). Continuous improvement of HSM process by data mining. Journal of Intelligent Manufacturing, 1-8.