Any correspondence concerning this service should be sent
to the repository administrator:
tech-oatao@listes-diff.inp-toulouse.fr
This is an author’s version published in:
http://oatao.univ-toulouse.fr/26646
To cite this version: Rochet, C. and Andrieu, E. and Arfaei, B.
and Harouard, J.-P. and Laurino, A. and Lowe, T.C. and
Odemer, G. and Blanc, C. Influence of equal-channel angular
pressing on the corrosion fatigue behaviour of an Al-Mg-Si
aluminium alloy for automotive conductors. (2020) International
Journal of Fatigue, 140. 105812. ISSN 01421123
Official URL
DOI :
https://doi.org/10.1016/J.IJFATIGUE.2020.105812
Open Archive Toulouse Archive Ouverte
OATAO is an open access repository that collects the work of Toulouse
researchers and makes it freely available over the web where possible
Influence of equal-channel angular pressing on the corrosion fatigue
behaviour of an Al-Mg-Si aluminium alloy for automotive conductors
C. Rochet
•
·\ E. Andrieu
•
, B. Arfae
i
°, J.-P. Harouard\ A. Laurino
h,
T.C. Lowe
ct, G. Odemer
•
,
C. Blanc
•
·
•
a CIRIMAT, Université de Toulouse, CNRS, INPT-ENSIACET, 4 Allée Emile Monso, BP 44362, 31030 Toulouse Cedex 4, France b LEONI Wiring Systems France, 5 Avenue de Newton, 78180 Montigny-le-Bretonneux, France
c FORD Motur Company, Research and Advanced Engineering, Palo Alto, CA 94304, USA
ct Colorado School of Mines, Departmen.t of MetaUurgical and Matmnls Engineering, Golden, CO 80401, USA
AB STR ACT Keywords: Aluminium alloys Brittle fracture Cold working Corrosion fatigue
The influence of equal channel angular pressing (ECAP) on the corrosion fatigue behaviour of an Al-Mg-Si alloy was studied. Preliminary fatigue tests in air showed an increase in fatigue lifetime for ECAP samples, as com pared to as-received samples, related to the ECAP-induced grain refinement. After pre-corrosion, the fatigue lifetime was lower for ECAP samples than for as-received samples, because the fragmentation of coarse inter metallics during ECAP led to an increase in the density of corrosion defects. Corrosion fatigue tests demonstrated a synergy between cyclic mechanical loading and corrosion processes for all samples; a deleterious effect of ECAP was also noted.
1. Introduction
Electrical conductors are found in most of technological systems such as high voltage lines, cars and aircrafts. In the automobiles, the electrical distribution system can reach almost 5 km in length, which represents a significant part of the total vehicle weight. Presently, Cu and Cu alloys comprise most wiring because of their high electrical conductivity. However, lighter and cheaper alternatives exist. Indeed, in high voltage lines for example, Al-Mg-Si alloys are increasingly used instead of Cu alloys, because of their low weight, relatively high con ductivity (50--60% International Annealed Cu Standard), good me chanical properties and high corrosion resistance. Therefore, car man ufacturers are currently evaluating the replacement of Cu wires by Al based wires in order to reduce the weight and cost of next-generation vehicles. Automotive wiring must resist degradation due to corrosion and fatigue embrittlement, to which Al alloys are known to be sus ceptible [1,2]. In the case ofa combination of vibrations and corrosive fluids, Al wires may experience corrosion fatigue embrittlement which is known to be very critical. Furthennore, car manufacturers are looking into new ways to improve the electrical conductivity and the mechanical properties of Al wires. Severe plastic defonnation processes (SPD) such as equal-channel angular pressing (ECAP) have already proven to be effective in this malter [3]. Therefore, ECAP could be of
• Corresponding author.
E-mail aMress: christine.blanc@ensiacet.fr (C. Blanc).
great interest for Al wires; however, before replacing Cu wires by 6xxx Al wires in automotive vehicles, it is necessary to measure the influence of ECAP on the corrosion fatigue resistance of Al-Mg-Si alloys.
Corrosion fatigue embrittlement includes both corrosion processes and a cyclic mechanical stress. The influence of SPD on the fatigue behaviour of Al alloys has already been studied in the literature and it is generally known that the fine grains obtained with SPD are beneficial in tenns of fatigue life [ 4]. However, this general conclusion must be qualified taking into account the numerous cyclic plasticity mechan isms that are likely to occur in relation to the alloy metallurgical states, the SPD parameters, and the operating environment. For instance, Murashkin et al. studied the fatigue behaviour of a 6061 aluminium alloy (M6061) processed by high-pressure torsion (HPT) [5]. They observed that the endurance limit was improved by a factor of two due to the formation of a very homogeneous ultrafine-grained (UFG) mi crostructure with homogeneous resistance to fatigue crack initiation in the high cycle fatigue (HCF, > 105 cycles) regime. In the low cycle fatigue (LCF, < 105 cycles) regime, the UFG alloy showed somewhat lower fatigue resistance due to its lower strain hardening ability. The corresponding fracture surfaces showed ductile striations in the stage of stable crack propagation in the coarse-grained (CG) T6-treated alloy, whereas brittle striations seemed to dominate on the fatigue fracture surface of the UFG allo y. The final fracture presented dimples in both
C. Rochet, et al.
material conditions, but with a smaller size for the UFG alloy. Similarly, Chung et al. studied the HCF life of an AA606 l processed by ECAP [ 4]. They observed a large enhancement in fatigue lifetime by a factor of about 10 after only one single pass of ECAP as compared to con ventionally processed AA6061-T6, and for both low and high cycle regimes contrary to Murashkin et al. [5]. Similar conclusions about the improvement of fatigue lifetime in the two regimes after ECAP were obtained by Esmaeili et al. for an AA7075 processed by ECAP [6].
Concerning the corrosion behaviour of conventional Al-Mg-Si al loys, literature is abundant, and published works have shown that the corrosion resistance in chloride media of these alloys is strongly related to their microstructure and mainly controlled by the precipitation state [7-12]. In this sense, many authors showed a significant influence of ECAP processes on the corrosion behaviour, in particular, pitting cor rosion of these alloys related to the fragmentation of coarse precipitates [13] and to the decrease in grain size [14].
On the contrary, very few works focused on the influence of SPD on the corrosion fatigue behaviour of Al-Mg-Si alloys, where multiple works about conventionally processed alloys have shown a decrease in fatigue lifetime due to premature crack initiation on corrosion defects [15-20]. The plastic deformation localisation around the corrosion defects and hydrogen embrittlement at defect/crack tip are the common mechanisms mentioned to explain this decrease in fatigue lifetime under corrosion fatigue conditions [21,22]. Sorne authors proposed a synergistic effect of corrosion and cyclic stress. Indeed, cyclic stress might enable an enhancement of oxide film embrittlement [23], the dissolution of the matrix surrounding metallurgical defects [24] and hydrogen penetration and trapping at the crack tip [20,25,26]. As stated above, the influence of SPD, and in particular ECAP, on such mechanisms is still not well documented at this time. Laurino et al. studied the corrosion fatigue behaviour and fracture mechanisms of an AA6101-T9 obtained by a two-step cold drawing process [15]. In the T9 metallurgical state, very elongated grains were observed in the wire drawing direction with a 500-nm width in the transverse plane. For this metallurgical state, no difference in fatigue lifetime was observed for corrosion fatigue tests as compared to fatigue tests performed on non-corroded and pre-corroded samples. In addi tion, similar to fatigue tests perforrned for pre-corroded samples, the crack initiation was localised on corrosion defects and a mainly inter granular fracture mode was observed in the propagation zone for samples tested under corrosion fatigue conditions. Sharma et al. studied the corrosion fatigue behaviour of UFG AA5083 obtained by a combi nation of cryomilling and hot isostatic pressing [27]. The UFG alloy presented a higher fatigue limit than the conventional alloy in air. In a
marine environment, the UFG alloy was found to be more susceptible to corrosion fatigue embrittlement. The experimental results suggested that at high stress ranges, slip-enhanced dissolution and hydrogen embrittlement were the dominant mechanisms for fracture in the UFG alloy. Conversely, at lower applied maximum stress values, pitting and crack closure were the prevailing mechanisms that led to crack initia tion and ultimate fracture.
In this framework, the present paper deals with the influence of ECAP on the corrosion fatigue behaviour of an Al-Mg-Si alloy. Fatigue tests were first perforrned in air for samples before and after ECAP, on both non-corroded and pre-corroded samples; the results obtained with non-corroded samples were considered as reference data, whereas those on pre-corroded samples allowed the effect of corrosion defects on the fatigue behaviour to be evaluated. Both sets of results were useful in analysing the data obtained after corrosion fatigue tests. To complete the results, fracture surfaces were analysed by scanning electron mi croscopy to characterise fatigue and corrosion fatigue fracture modes. Comparison of ail the results was helpful to distinguish between the influence of corrosion and cyclic mechanical loading on the corrosion fatigue behaviour of the alloy, and to deterrnine whether a synergy occurred between these two parameters, i.e. corrosion and mechanical loading. Furthermore, the influence of ECAP on these mechanisms was
analysed.
2. Material and experimental techniques 2.1. Material
The study focused on an Al-Mg-Si alloy with the following chemical composition (wt. %, Al balance): Mg 0.57, Si 0.37, Fe 0.10, Mn 0.04, Cu
0.01, others 0.10. The as-received condition, considered as the re ference metallurgical state, was provided as extruded 9.5 mm rods. As received samples were ECAP-processed under two different conditions, referred to as ECAP-RR and ECAP-RH.
1. ECAP-RR samples were submitted to two passes in an ECAP Conform machine (120° die angle) [28] at room temperature with a rotation of 90° between passes [29]. For both passes, the displace ment rate was 2.04 mm s-1 to impart a total effective strain e = 1.34.
2. For ECAP-RH samples, the same machine was used, but the first pass was perforrned at room temperature and the second one at 135-155 °C. There was also a rotation of 90° between passes, and for both passes, the displacement rate was 2.04 mm s-1 to impart a total effective strain e = 1.34.
2.2. Experimental techniques 2.2.1. Mechanical tests
To determine the influence of ECAP on the corrosion fatigue be haviour of the alloy, preliminary tensile tests were performed using an MTS testing machine equipped with a 30 kN Joad cell, to evaluate the yield strength (YS) and the ultimate tensile strength (UTS) of both the as-received and ECAP-processed samples. Cylindrical tensile samples, with a gauge length of 24 mm and a 4-mm diameter, were used. Tests were all performed at room temperature under a constant strain rate of 10-3 s-1 using a 20-mm extensometer to record sample deforrnation during testing. In order to assess the reproducibility of the mechanical response, at least three tensile samples were tested for each condition. Then, fatigue tests were perforrned in laboratory air on both the as received and ECAP-processed samples to obtain reference data. Fatigue tests were perforrned for non-corroded samples and pre-corroded samples, so that it was then possible, by comparison to the results ob tained during corrosion fatigue tests, to evaluate the synergy between the corrosion mechanisms and the mechanical loading during corrosion fatigue tests. Tests were carried out by using an Electroforce 3300 machine from TA instruments equipped with a 3.3 kN Joad cell. They were ail perforrned at a frequency of 50 Hz with a Joad ratio
R = 0""" = 0.1 under a sinusoïdal stress loading. Those testing condi tions°';,�re chosen in agreement with standard vibration tests performed at LEONI Wiring Systems. Cylindrical samples with a gauge length of 28 mm and a minimum diameter of 2.5 mm were used (Fig. 1). Prior to fatigue tests, samples were ground using SiC abrasive paper to P4000 (per the ISO 6344 standard designation of abrasives) and then polished using diamond paste to 0.25 µm. For the fatigue tests on pre-corroded samples, Silicone (CAFl) was used to mask the cylindrical sample, ex cept for 1 cm of the gauge length, which was exposed to the corrosive medium after polishing. Two different pre-corrosion tests were con sidered:
1. PC72h: immersion during 72 h in 0.5 M NaCI at the corrosion po tential (Ecorr
l-2. PClh30: immersion during 1 h 30 min in 0.5 M NaCI at E,=· In 0.5 M NaCI solution, E,orr was about - 0.72 VsCE for both as received and ECAP-processed samples [30]. Ail immersions were done at a controlled temperature of 25 °C; the electrolyte was stirred by using
"'
V,"'
(D"'
11>6.6Scale: 2:1
rr
Fig. 1. Fatigue sample geometry (NF EN ISO 11782-1). the same device as used for the corrosion fatigue tests.
Corrosion fatigue tests were performed on both as-received and ECAP-processed samples by using a corrosion cell directly mounted on the Electroforce fatigue machine. The electrolyte was a 0.5 M NaCI solution, at a controlled temperature of 25 •c, as for the pre-corrosion conditions described before. It was maintained at a constant flow rate by means of a peristaltic pump. Corrosion fatigue tests were ail per formed at Eco,,. For reproducibility, fatigue tests and corrosion fatigue tests were repeated at least three times.
2.2.2. Characterisation of the microstructure and analysis of the fracture surfaces
The microstructure of the as-received, ECAP-RR and ECAP-RH samples was described in detail in a previous paper [30]. Only major results are reproduced here. First, electron backscatter diffraction (EBSD) analysis showed a significant decrease in area-weighted average grain size from 24 µm for the as-received sample to 16 µm and 4 µm for ECAP-RR and ECAP-RH samples, respectively. This was associated with an increase in high-angle grain boundaries (HAGBs) density and a de crease in the global texture of the samples after ECAP. Additionally, an image analysis based on scanning electron microscope (SEM) observa tions enabled a full characterisation of the precipitation state of the alloy before and after ECAP. SEM observations combined with an en ergy dispersive spectroscopy (EDS) analysis highlighted the presence of numerous Fe-rich coarse intermetallic (!MC) precipitates inside the matrix. The IMCs fraction of surface area was found to decrease from 0.53% for the as-received samples to 0.32% and 0.34% for ECAP-RR and ECAP-RH samples, respectively. This was most likely related to fragmentation of the IMCs during ECAP, which resulted in a higher amount of small IMCs not detectable during image analysis [30]. This particular effect was also observed by other authors [14,31]. No ]3", j3' and j3-Mg2Si precipitates formed during ECAP processes.
A Quanta 450 SEM manufactured by FEI was also used to observe fracture surfaces and characterise crack initiation sites on fatigue samples.
2.2.3. Characterisation of corroswn defects
The corrosion defects morphology was analysed using a Sensofar S Neox-confocal microscope set in interferometry mode (vertical resolu tion of 0.1-1 nm). The depth, diameter and fraction of surface area of corrosion defects after pre-corrosion and corrosion fatigue tests were determined using Gwyddion Analysis software. To obtain re presentative values of the corrosion defect morphology, 25 images per sample were analysed. Only corrosion defects deeper than 0.1 µm were considered, which allowed an average of 100 defects per image (351 µm x 264 µm) to be characterised.
3. Results and discussion
3.1. Influence of ECAP on the fatigue behaviour of non-corroded samples To determine the influence of ECAP processes on the corrosion fa tigue resistance of the Al-Mg-Si alloy, fatigue tests were first carried out in laboratory air on non-corroded samples, to be used as reference tests. It is of major importance to note that laboratory air is not a well-con trolled or inert environment; it can be responsible for embrittlement of materials during fatigue due to the adsorption and penetration of hy drogen present in water vapor. Sorne models were proposed to describe the influence of a gaseous environment such as moist air on crack propagation. Lynch's mode! of Adsorption Induced Dislocation Emission (AIDE) shows that the adsorption of aggressive species such as hydrogen at a crack tip could promote dislocations emission by a de crease in surface energy [32]. Therefore, such species mainly influence crack propagation rather than crack initiation during fatigue tests. Since crack initiation is the main mechanism influencing the fatigue lifetime in the present work, the effect of hydrogen from air moisture during endurance tests carried out in laboratory air was neglected. However, for fatigue tests performed on pre-corroded samples and corrosion fatigue tests, hydrogen could be produced by corrosion me chanisms around corrosion defects and then al the crack tip [15]; in that sense, an H effect was likely to be present.
Fatigue tests were performed for different stress levels. Considering the differences in mechanical properties between ail samples, the stress levels for a given sample were chosen to correspond to varions per centages of the UTS measured for this sample. Therefore, in order to determine YS and UTS values of the as-received, ECAP-RR and ECAP RH samples, preliminary !ensile tests were performed al 25 ·c and 10-3 s-1 in air.
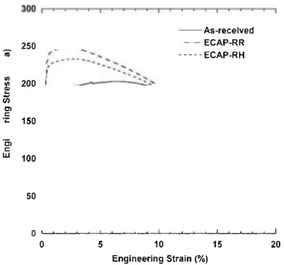
Fig. 2 shows the !ensile curves obtained for the as-received, ECAP RR and ECAP-RH sampi es at 10 -3 s-1
• An increase in both UTS and YS0.2 was observed as well as a decrease in the elongation to failure, for both ECAP samples as compared to the as-received sample. This evo lution was mostly related to the significant grain refinement induced by ECAP. Results also showed that the mechanical properties of ECAP-RH sample, with the smallest grain size, i.e. 4 µm, were lower than those of ECAP-RR sample, with a grain size of 16 µm. This was explained by the observation of an incomplete recrystallisation process for the ECAP-RR sample, whereas a complete recrystallization occurred for the ECAP-RH sample [30,33]. Indeed, the increase in processing temperature for ECAP-RH during the second pass led to a complete recrystallisation process, and then to a decrease in the deformation stored in grains, which induced a slight softening of the alloy.
Another point of interest of these tests was the decrease in
U::
ratio after both ECAP-RR and ECAP-RH processes (Table 1) essentially due to a significant increase in the yield stress. Such a result suggested a de crease in the plastic zone radius al the tip of a propagating crack so that the plastically deformed volume might be smaller than the re presentative elementary volume (REV) of the material and finally very sensitive to size and distribution of heterogeneities in terms of fatigue crack propagation rate. This point is important to consider in analysing the influence of ECAP on the fatigue behaviour of the alloy. As aC. Rochet, et at 250
..
..
..
e
iii
Cl C: ·,: "êi C: w 200 150 100 50 --As-recelved - - ECAP-RR ----·ECAP-RH 0'-'���-'--���-L���,_,���_._J 0 5 10 Engineering Strain (¾) 15 20Fig. 2. Tensile curves plotted for the as-received, ECAP-RR and ECAP-RH samples at 10-3 s-1•
reminder, it was shown previously, for the as-received sample, that the microstructure was characterised by a heterogeneous grain structure (with an average grain size of 24 µm) and the presence of IMCs [30]. Both ECAP-RR and ECAP-RH processes were found to induce a sig nificant grain refinement (associated with an increase in HAGB density) and a slight breakdown of IMCs. As discussed in the introduction, these microstructural heterogeneities influence the fatigue behaviour of Al alloys. Considering that ECAP induced an increase in the density of such heterogeneities, i.e. an increase in grain boundaries and !MC density, it was assumed that the plastically deformed volume will remain re presentative of the microstructure during fatigue tests, even for ECAP RR and ECAP-RH samples. This assumption is based on consideration of the decrease in the plastically deformed volume through a decrease in the microstructural scale.
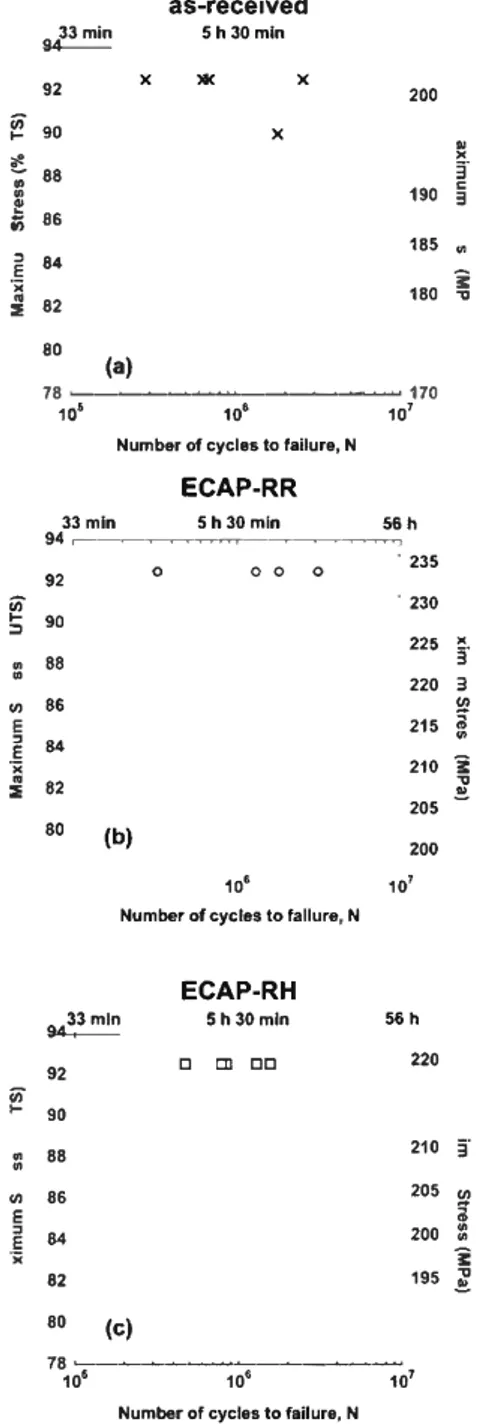
Fig. 3 thus shows S-N curves obtained for the as-received, ECAP-RR and ECAP-RH samples at 93%, 90% and 80% of the UTS. The fatigue limit (fixed arbitrarily at 107 cycles in this work) was reached for the as received, ECAP-RR and ECAP-RH samples as soon as the applied max imum stress was lower than 90% of the UTS. This clearly showed that it was necessary to reach a very high stress level ( > 90% of the UTS and > YS0_2) to induce a fracture whatever the samples. At 93% of the UTS, the numbers of cycles to failure were very close for ail samples. However, this stress level (expressed as a percentage of UTS) corre sponded to a higher effective stress level (expressed in MPa) for ECAP RH sample, and particularly for ECAP-RR sample. This was related to the enhancement of mechanical properties already observed on tensile curves, and was explained by the grain refinement induced by the SPD process. Indeed, the increase in HAGBs density could create efficient barriers to crack propagation. This should be responsible for a decrease in the cumulated plastic deformation during the first cycles, and should lead to a delay in the crack initiation for ECAP samples. In addition, during fatigue tests, this should induce a decrease in the dislocation
Table 1
Tensile properties of as-received, ECAP-RR and ECAP-RH samples.
As-received ECAP-RR ECAP-RH YS (MPa) 171 ± 3 233 ± 1 214 ± 1 YSo.2 (MPa) 175 ± 3 243 ± 3 222 ± 3
density in persistent slip bands leading to a Jess pronounced extrusion/ intrusion phenomenon at the sample surface resulting in a further delay in the crack initiation for ECAP-RR and ECAP-RH samples [4]. Fur thermore, as explained previously, the increase in ECAP processing temperature for ECAP-RH sample, leading to a complete recrystallisa tion process, induced a slight softening of the alloy. This could explain the differences observed between the two ECAP-processes samples.
Fig. 4 shows SEM observations of the fracture surfaces of as-re ceived, ECAP-RR and ECAP-RH samples after fatigue tests performed at 93% of the UTS. No difference in fracture modes was observed between the as-received, ECAP-RR and ECAP-RH samples. For ail samples, the fracture surfaces showed a single initiation site localised on the sample surface (Fig. Sa). Crack initiation site was most likely associated with the presence of IMCs (Fig. Sc) or extrusion/intrusion zones. The crack propagation zone was characterised by a granular aspect (Fig. 5d), which was consistent with the grain size of as-received, ECAP-RR and ECAP-RH samples measured in a previous study [30]. Therefore, it was considered that the crack propagated by intergranular fracture. No striations were observed for ail samples along this intergranular crack propagation zone; this could suggest an unsteady crack propagation, which did not progress at each cycle. This type of fracture had already been observed in previous work [15] and by Esmaeili et aL for AA7075
[6]. The numerous grain boundaries observed in ECAP-processed samples, in relation to the decrease in grain size due to the deformation process, acted as microstructural barriers, which finally promoted an intergranular fracture. Finally, it was observed that the final fracture zone was classically ductile and showed a high density of dimples (Fig. Sb) for ail samples.
Therefore, it was concluded that due to a significant grain refine ment during ECAP, both ECAP-RR and ECAP-RH samples showed a better fatigue resistance than the as-received sample. Then, for a better understanding of corrosion fatigue behaviour of ECAP-processed sam ples, the effects of corrosion and cyclic mechanical loading were con sidered separately in a first approach. For that reason, in the following part, the influence of pre-corrosion on fatigue lifetime in air was ex amined.
3.2. Effect of pre-corrosion on the fatigue lifetime in air
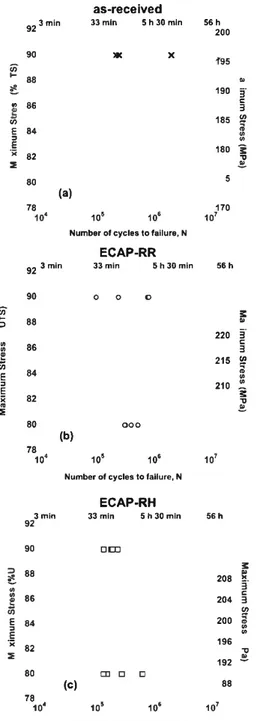
Fig. 6 shows S-N curves obtained in laboratory air at 90% and 80% of the UTS, for the as-received, ECAP-RR and ECAP-RH samples after a pre-corrosion step of 72 h in 0.5 M NaCI at E,orr• Results from tests performed without pre-corrosion were reported for comparison (grey areas). At 90% of the UTS, a decrease in fatigue lifetime was observed for pre-corroded samples for both the as-received and ECAP-processed samples. The ratio Npc72llNAfr (where Npcnh and NAfr were the average numbers of cycles to failure for the tests performed on pre-corroded and non-corroded samples, respectively) decreased from 0.07 ± 0.03 for the as-received sample to 0.05 ± 0.02 and 0.02 ± 0.01 for the ECAP RR and ECAP-RH samples, respectively. At 80% of the UTS, ail pre corroded as-received samples reached the fatigue limit, whereas pre corroded ECAP-RR and ECAP-RH samples both exhibited premature fractures ( < 106 cycles).
The corresponding fracture surfaces are reported in Fig. 7. Contrary to non-corroded samples, crack initiation sites were systematically re lated to corrosion surface defects (Fig. 7g, h and i). SEM observations of the samples revealed that those defects were homogeneously
UTS (MPa) 218 ± 2 253 ± 1 238 ± 5 A%(%) 13.9 ± 0.6 11.4 ± 0.7 13.2 ± 0.9 UTS YS 1.27 ± 0.03 1.11 ± 0.01 1.09 ± 0.02
9;3mln 92 � 90 � 88
ë
_; 86ê
84 ';ëi
82 80(a)
X as-received 5h30mln )1( X X 200�
!i'
190§
185 .,"i
180 -a 78 ---���---� 170 1� 1� 1�Number of cycles to failure, N
ECAP-RR 33mln 5h30mln 56h 94 �--���.-.,--�����.-, 92 0 0 0 0 . 235 . 230
�
::, 90 " 88..
"' 86 Eê
841
82 80(b)
10'Number of cycles to fallure, N
ECAP-RH si3mln 5h30mln
;;;
,_
"
"
"'
E :, E ·;; 92 90 88 86 84 82 80(c)
□
[D□□
225§'
220 3 !(? 215a
210 °i "0 e 205 200 107 56h 220 210 (j' 205 !(? al 200 g: j: 195i
78 �-�----�---� 10' 106 107Number of cycles to failure, N
Fig. 3. S-N curves (maximum stress (in % UTS or in MPa) vs. nurnber of cycles to failure) plotted for the as-received, ECAP-RR and ECAP-RH samples. The fatigue tests were perfonned in laboratory air for non-corroded sam.ples at 25 °C (f = 50 Hz, R = 0.1, sinusoidal stress loading). Black arrows refer to non broken sam.ples.
distributed on the surface of the fatigue test samples after pre-corrosion during 72 h, according to a previous study perforrned on fiat samples [30]. These corrosion defects corresponded to the dissolution of the matrix surrounding Fe-rich IMCs, in agreement with the common cor rosion behaviour observed for Al-Mg-Si alloys during immersion in NaCl [8,30,34]. To characterise these corrosion defects, i.e. their depth, their diameter, their density, and the corresponding corroded surface ratio (ratio between the surface area of the corroded zone and the total surface area), a confocal microscope set in interferometry mode was used.
A 3D profile of a corrosion defect forrned after the 72-h immersion in NaCl, and the corresponding 2D profile, obtained with the confocal microscope are shown in Fig. Sa and Sb, respectively. The dissolved areas had a crevice-like shape with a diameter depending on the size of the !MC around which the dissolution initiated. Statistical analysis perforrned on about 100 corrosion defects for each sample showed that the corrosion defects were slightly larger and deeper for the as-received sample (2.72 µm / 1.76 µm), as compared to ECAP-RR (2.05 µm / 1.21 µm) and ECAP-RH (2.38 µm / 1.54 µm) samples (Table 2). Moreover, the density of corrosion defects (the corroded surface ratio) was found to increase from 1.71 103 mm-2 (0.91%) for the as-received sample to 5.36 103 mm-2 (1.38%) and 3.52 103 mm-2 (1.44%) for ECAP-RR and ECAP-RH samples, respectively .
As already stated, the decrease in fatigue lifetime for pre-corroded samples could be related to corrosion defects acting as stress con centrator sites [35-37]. The decrease in Npcnh/NAic ratio for ECAP-RR and ECAP-RH samples, as compared to the as-received sample, sug gested that ECAP induced a higher susceptibility to the pre-corrosion step. Results shown above (Table 2) with less deep and fewer large defects for ECAP-processed samples did not seem consistent with this hypothesis. Indeed, it is generally expected that deeper and larger de fects are responsible for a higher contribution to stress concentration phenomenon [34]. Many studies, focused on the effect of pitting cor rosion on fatigue crack initiation, indicated that pit depth and diameter were critical parameters [38-42]. Rokhlin et aL developed an empirical relation predicting fatigue life of M2024-T3 after pre-corrosion, and showed that the deeper the corrosion pits, the lower the fatigue life of the sample [ 40]. In the present study, from this consideration, the as received sample should present the highest susceptibility to the pre corrosion step. However, Burns et aL pointed out that pit depth and width were not the only parameters controlling fatigue crack initiation [25]. Defect shape and defect surface density are also critical para meters in this regard. In agreement with this last statement, the slight increase in both density of corrosion defects and corroded surface ratio for ECAP-RR and ECAP-RH samples could explain the decrease in fa tigue lifetime for those samples. This should be associated with the fragmentation of Fe-rich IMCs during ECAP processes [14,30], those particles acting as preferential corrosion sites [33]. The presence of a higher amount of cathodic sites led to the formation of a higher number of corrosion defects at the sample surface and to premature crack in itiation in the case of ECAP samples. A similar result was already ob served by Korchef et aL [14].
Therefore, the results clearly demonstrated that the corrosion defect density was the most significant parameter to explain the deleterious effect of ECAP on the crack initiation step and finally on fatigue life time, for the pre-corrosion conditions used. However, during in-service use, corrosion mechanisms and cyclic mechanical loading affect the fatigue behaviour of the wire concurrently. Therefore, the influence of ECAP on the corrosion fatigue behaviour of the Al-Mg-Si alloy had to be examined.
3. 3. Influence of ECAP on the corrosion fatigue behaviour
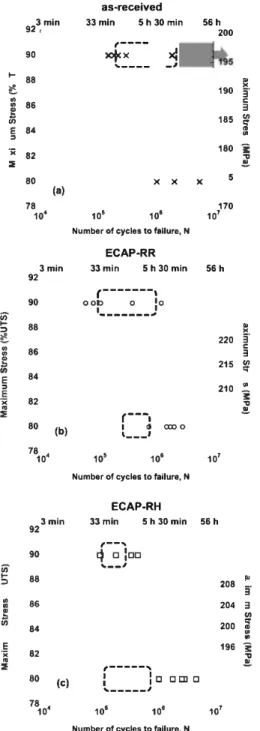
Fig. 9 shows S-N curves obtained for the as-received, ECAP-RR and ECAP-RH samples tested at 90% and 80% of the UTS in 0.5 M NaCl at Ecorr• Previous results obtained for non-corroded and PC72h
pre-C. Rochet, et al.
as-received ECAP-RR ECAP-RH
1 --1
I_ _ _ _ _ _ _ _ _ _ _ _ 20 µm 1
Fig. 4. SEM observations of the fracture surfaces of (a), (d) and (g) as-received sample; (b), (e) and (h) ECAP-RR sample; (c), (0 and (i) ECAP-RH sample tested at 93% of the UTS. The fatigue tests were performed in laboratory air for non-corroded samples at 25 °C (f = 50 Hz, R = 0.1, sinusoïdal stress loading).
Fig. 5. Fracture surfaces ofECAP-RH sample tested at 93% of the UTS: (a) Initiation/propagation zones; (b) ductile finale fracture zone; (c) Initiation defect and (d) intergranular propagation zone. The same observations were done for ECAP-RR and as-received samples. The fatigue tests were performed in laboratory air for non corroded samples at 25 °C (f = 50 Hz, R = 0.1, sinusoidal stress loading).
corroded samples are reported for comparison. NFclNA" ratios at 90% of the UTS were evaluated around 0.09 ± 0.04, 0.04 ± 0.02 and 0.02 ± 0.01 for as-received, ECAP-RR and ECAP-RH samples, re spectively. These values first showed that ECAP samples were more
susceptible to corrosion fatigue than the as-received samples. Then, comparison with Npcnh/NAir ratios also suggested that the decrease in fatigue lifetime during corrosion fatigue tests was similar to that with PC72h pre-corrosion. However, if attention was paid to the immersion
as-received
92 3 min 33mln 5 h 30 min 56h 200 90 li( X'vi
f95...
88..
�
190lï
86 C.,
3t
185"'
"'
;
E 84.,
:,.,
E 180'i:
·;. 82 "O :E -!. 80 5(a)
78 170 10' 10' 10' 107Number of cycles to !allure, N
ECAP-RR
92 3 min 33min 5 h 30min 56h
90 0 0 0
'vi
...
.::
88..
:;) 220lï
..
86"
.,
3!!
215 !('ûi
ii1 E 84"'
:, 210"'
E3:
·;."'
82 "O -!. ::E 80 000(b)
78 104 10' 10' 107Number of cycles to !allure, N
ECAP-RH
3mln 33 min 5h 30 min 56 h 92 90□
CD.::
:;) 88�-ê
208 Ill 3 Ill 86"
!
204 3 !(' E 84 200 ii1 :,.,
E.,
)( 82 196 "O :E 192 -!. 80 CDa
a
(c)
88 78 10' 10' 106 107Number of cycles to failure, N
Fig. 6. S-N curves of (a) as-received, (b) ECAP-RR and (c) ECAP-RH samples obtained after pre-corrosion in 0.5 M NaCI at Ecorr during 72 h. Grey areas refer to previous fatigue results obtained without pre-corrosion. The fatigue tests were perfonned in laboratory air at 25 �c (f = 50 Hz, R = 0.1, sinusoidal stress loading). Arrows refer to non-broken samples.
time of pre-corrosion tests and to corrosion fatigue test durations, i.e. 72 h vs. around 1 h 30 min, corrosion fatigue tests were undoubtedly significantly more damaging than fatigue tests on PC72h pre-corroded samples. At 80% of the UTS, similar conclusions could be done except for ECAP-RH sample that was Jess susceptible to a fatigue lifetime de crease under corrosion fatigue conditions .
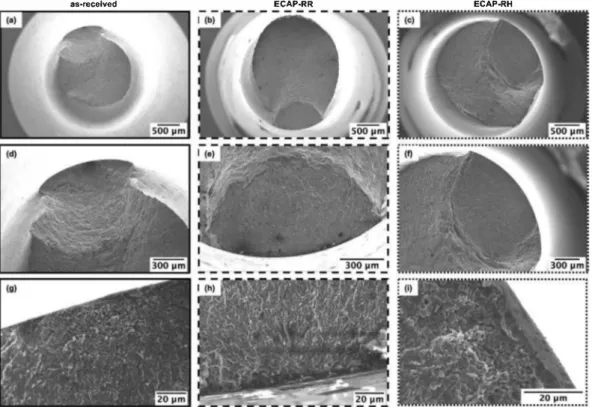
Fracture surfaces observed after corrosion fatigue tests are reported in Fig. 1 O. The fracture modes were identical to those observed for non corroded and PC72h pre-corroded samples. As for PC72h pre-corroded samples, crack initiation was always localised on corrosion defects (Fig. 10g, h and i), i.e. dissolution areas surrounding Fe-rich IMCs. No pits were observed for corrosion fatigue samples, which was consistent with the fact that these tests were performed at E,orr•
Previous results, showing a similar number of cycles to failure for both corrosion fatigue tests and fatigue tests on PC72h pre-corroded samples, but corresponding to shorter immersion times for corrosion fatigue tests, suggested a synergy between cyclic mechanical loading and corrosion processes. This had already been observed in previous studies on Al alloys [15,20,38]. To confirrn this assertion, fatigue tests were perforrned at 90% of the UTS on samples pre-corroded during 1 h 30 min, i.e. approximatively the corrosion fatigue test duration for as received, ECAP-RR and ECAP-RH samples at 90% of the UTS. Results showed that, for this pre-corrosion duration, ail samples reached a number of cycles to failure significantly higher than for corrosion fa tigue tests (Fig. 11). This demonstrated that, for the same immersion time in 0.5 M NaCI (at E00,,), the interaction between the cyclic me chanical loading and the corrosion processes led to a stronger decrease in fatigue lifetime of the alloy: a synergy effect between corrosion processes and the cyclic mechanical loading was clearly showed. As previously said, this synergy effect seemed to be more efficient for ECAP-processed samples.
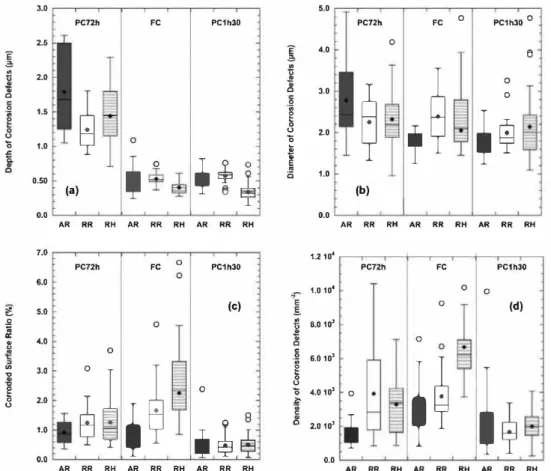
To explain this result, the corrosion defects formed during the cor rosion fatigue tests and during the PC1h30 pre-corrosion tests were characterised by using interferometric microscopy. The results are shown in Fig. 12. In order to have a statistical approach, results were presented using the boxplot representation. Each box encloses 50% of the data set with the median value displayed as a straight line. The top and the bottom of each box mark the limits of ± 25% of the data set (upper and lower quartiles respectively). The whiskers for each box refer to the minimum and maximum values from the data set that fa!! within an acceptable range. Any value outside of this range is re presented by a circle. First, a decrease in both depth and diameter of corrosion defects when the immersion time decreased was observed for ail samples when results obtained after a pre-corrosion of 72 h were compared to those obtained after a pre-corrosion of 1 h 30 min (Fig. 12a and b). Moreover, no significant difference in depth and diameter was observed between corrosion defects formed during corrosion fatigue tests and those forrned during PClh30 tests. This observation showed that a cyclic mechanical loading influenced neither the type nor the morphology of corrosion defects since previous observations of the fracture surfaces showed that, for corrosion fatigue tests, the corrosion defects corresponded to the dissolution of the matrix around IMCs as for PC72h and PC1h30 samples. In addition, no significant effect of ECAP on the depth of the corrosion defects forrned during corrosion fatigue tests was observed; a slight increase in the diameter of the corrosion defects for ECAP-processed samples could be noticed by comparison to the as-received samples. This was also true for samples pre-corroded during 1 h 30 min. On the contrary, as previously noted, significantly shallower corrosion defects were observed on ECAP samples pre-cor roded during 72 h as compared to the as-received samples. Ali these results were in perfect agreement with the conclusions drawn in a previous paper [30] stating that the influence of ECAP on corrosion defects morphology was only observed when defects reached critical dimensions. However, the main result here was that an increase in both the density and the corroded surface ratio was observed for corrosion fatigue samples by comparison to PClh30 samples (Fig. 12c and d).
C. Rochet, et at
Fig. 7. SEM observations of the fracture surface of (a), (d) and (g) as-received sample; (b), (e) and (h) ECAP-RR sample; (c), (f) and (i) ECAP-RH sample tested at 90% of the UTS after pre-corrosion during 72 h in 0.5 M NaCl at Ecorr• White arrows G), (k) and (1) indicate corrosion defects acting as crack initiation sites. The fatigue tests were performed in laboratory air at 25 °C (f = 50 Hz, R = 0.1, sinusoidal stress loading).
(a)
''
f
(b) 0,1 µmI
.,
•
•1.0l
-2,3 µm ·1.5_,,
...
..il-ffl}Fig. 8. (a) 3D profile of a dissolved area observed on the surface of a PC72h pre-corroded sample and (b) corresponding 2D profile. Table 2
Average depth, diameter, density of corrosion defects and corroded surface ratio (corroded surface / non-corroded surface ratio) determined for as-re ceived, ECAP-RR and ECAP-RH samples after pre-corrosion in 0.5 M NaCl during 72 h at Ecorr·
As-received ECAP-RR ECAP-RH
Depth (µm) 1.76 ± 0.12 1.21 ± O.Q7 1.54 ± 0.08 Diameter (µm) 2.72 ± 0.25 2.05 ± 0.09 2.38 ± 0.11 Density (103 mm -2) 1.71 ± 0.05 5.36 ± 0.05 3.52 ± 0.05
Corroded Surface Ratio(%) 0.91 ± 0.21 1.38 ± 0.22 1.44 ± 0.21
Comparison of Fig. 12b, c and d showed that the increase in the cor roded surface ratio for corrosion fatigue tests as compared to fatigue tests on PCl h30 pre-corroded sampi es was mainly due to an increase in
the corrosion defect density, with no significant effect of the cyclic mechanical loading on the diameter of the corrosion defects, as ob served above. Similar analyses were performed after fatigue tests at 80% of the UTS on samples pre-corroded during 16 h in 0.5 M NaCI by comparison with corrosion fatigue tests performed at 80% of the UTS (the mean duration of these tests was about 16 h). For brevity, these results are not reported in this paper but the conclusions were very similar, even if the differences observed between corrosion fatigue tests and fatigue test.s on pre-corroded samples were less pronounced th.an for tests perforrned at 90% of the UTS. Therefore, these results con firrned that an interaction occurred between the cyclic mechanical loading and the corrosion processes leading to an increase in the density of corrosion defects. Severa! mechanisms had been proposed in the literature to explain this synergy effect. The ones of interest in our case are those describing the influence of cyclic mechanical loading on oxide
9
i
min 90...
88ê
.,
86.,
!
E
84 ::,·;
82 2 80 (a) 78 10' 3 min 92 90�
88=>
�
Ill 86.,
�
ui
E 84 ::, Ex
..
82 :E 80 (b) 7810' 3min 92 90�
=>
88:
86 b Il) 84 E·;
..
82 2 80(c)
7810' as-received 33mln 5 h 30 min 56h 200,----
>4
x+x
'---
�
190 185 180 X X X 5 170 105 101 107Number of cycles to !allure, N
ECAP-RR
33min 5 h 30 min 56 h,---,
00�_______
0 :o.,
220 215 210,---,
1.,
CXX) 0, ___
,
10' 106 107Number of cycles to failure, N
ECAP-RH
33min 5 h 30 min 56 h,--,
q
'---'
□ :□□ 208 204 200 196,---,
: : □ □CD□'---'
105 10' 107Number of cycles to failure, N
..
!:!. 3 C 3,.,,
i
�
...
e
..
!!. 3 C 3,.,,
�
..
�
...
e
..
ËÏ 3la
=
..
�
...
!!.Fig. 9. S-N curves of as-received, ECAP-RR and ECAP-RH samples plotted fol lowing corrosion fatigue tests performed at 25 °C (f = 50 Hz, R = 0.1, sinu soidal stress loading) in 0.5 M NaCI at Ecorr· Plain and outlined grey areas refer to previous results obtained without pre-corrosion and with pre-corrosion during 72 h at Ecom respectively. Arrows refer to non-broken samples.
fihn resistance and metal dissolution [ 43]. During corrosion fatigue tests, a continuous breakdown of the surface mtide layer should occur, preferentially around surface defects, i.e. IMCs, that act as stress con centrator sites. This should promote the exposure of these particles to the corrosive solution, and thus the formation of corrosion defects [29,44]. This assumption could explain the increase in the corrosion defect density for corrosion fatigue tests as compared to fatigue tests on PClh30 pre-corroded samples, and thus the highest damaging effect of corrosion fatigue tests. With this analysis, the lifetime of the samples would be analysed by considering once more the density of the corro sion defects, more than their depth. Moreover, Fig. 12d also showed that the corrosion defect density for corrosion fatigue tests was higher for ECAP-processed samples as compared to the as-received samples, with even higher values for ECAP-RH samples. Such an observation could be related to the fragmentation of the Fe-rich IMCs during ECAP. Indeed, by considering the previous mechanism associated with the breakdown of the passive film around the IMCs due to the cyclic me chanical loading, it could be assumed that the more numerous the IMCs the more numerous the corrosion defects. However, the relationship between the density of corrosion defects and the fatigue lifetime was not trivial. Indeed, the differences in the susceptibility to corrosion fatigue between ECAP-processed samples and the as-received samples was explained by considering the density of corrosion defects. Never theless, it remained difficult to explain the differences observed be tween ECAP-RR and ECAP-RH samples, both showing a similar number of cycles to failure during corrosion fatigue tests, but significant dif ferences in the density of corrosion defects. This last observation sug gested that, in addition to the effect of the cyclic mechanical loading on the passive film breakdown, other mechanisms had to be considered to explain ail the results. Even if it was not the scope of this manuscript to analyse in detail such mechanisms, it could be useful to remind them . The first mechanism focused on crack initiation phenomenon, but other mechanisms, related to the crack propagation step, could be discussed to understand the possible interaction between fatigue and corrosion depending on the samples. Indeed, as soon as a crack initiates on a corrosion defect and starts to propagate, a non-passivated surface is created at the crack tip due to the localisation of the deformation and the emergence of slip bands. The slip dissolution mode! is generally used to describe the competition between plasticity and re-passivation at the crack tip [ 43]. If the re-passivation rate is lower than strain rate, crack propagation may carry on. But crack arrests may also occur by tip blunting depending on the dissolution rate at the crack tip. If the re passivation rate is higher than strain rate, crack propagation will stop [43]. Also, Jones et aL showed that anodic dissolution at crack tip was promoted by the electrochemical coupling effect existing between the tip and the edges of the crack that act as cathodic sites [ 45]. li could be assumed that the differences in microstructure shown in our previous paper [30] between the as-received sample and ECAP-processed sam ples, but also between ECAP-RR and ECAP-RH samples, should con tribute to explain some differences related to the crack propagation rate. Those differences of microstructure should also explain differences in the susceptibility to hydrogen embrittlement. Indeed, another me chanism which may be cited here is based on hydrogen-assisted crack propagation processes during corrosion fatigue tests or during corrosion defect propagation un der cyclic thermal exposures [ 46,4 7]. Preliminary tests on hydrogen embrittlement (HE) susceptibility of the Al alloy considered in this study suggested that HE was not a predominant da mage mechanism. However, it is necessary to keep in mind that the process zone al a fatigue crack tip is very small and that an effect of hydrogen in this area is still possible but very difficult to detect.
4. Conclusions
The influence of ECAP processes on the resistance to corrosion fa tigue of an Al-Mg-Si alloy was investigated. The main conclusions, in relation to previous studies performed on the same alloy [30], are the
C. Rochet, et al.
as-recelved ECAP-RR ECAP-RH
Fig. 10. SEM observations of the fractnre surfaces of (a), (d) and (g) as-received sample; (b), (e) and (h) ECAP-RR sample; (c), (f) and (i) ECAP-RH sample tested at 90% of the UTS in 0.5 M NaCl at Ecorr• The corrosion fatigue tests were performed at 25 °C (f = 50 Hz, R = 0.1, sinusoidal stress loading).
z
�.a
i
g
.. ..
107l
106 ô E=
zAs-recelved ECAP-RR ECAP-RH
Fig. 11. Comparison of the number of cycles to failure determined for the as received, ECAP-RR and ECAP-RH samples after corrosion fatigue test.s and PClh30 tests. Results obtained for PC72h tests are reported for comparison. Both corrosion fatigue tests and fatigue tests on pre-corroded samples were performed at 25 °C (f = 50 Hz, R = 0.1, sinusoidal stress loading). following:
1. Preliminary fatigue tests perforrned in laboratory air showed an increase in fatigue lifetime at high stress levels for ECAP-RR and
ECAP-RH samples, as compared to the as-received samples. This was attributed to the decrease in grain size induced by ECAP processes leading to a delay in crack initiation.
2. In agreement with the literature, corrosion defects formed during pre-corrosion at Ecom i.e dissolution of the matrix around Fe-rich IMCs, acted as stress concentrator sites resulting in a noticeable decrease in fatigue lifetime for both the as-received and ECAP-pro cessed samples. Moreover, results also showed that the depth of the corrosion defects was not sufficient to explain the differences in fatigue lifetime. Rather, fatigue lifetime correlated with the density of corrosion defects. This resulted in a more damaging effect of pre corrosion for ECAP-RR and ECAP-RH samples, as compared to the as-received samples, due to the fragmentation of IMCs during ECAP. 3. Corrosion fatigue tests showed the synergy between the cyclic me
chanical loading and the corrosion processes. This was attributed to an increase in the density of corrosion defects during corrosion fa. tigue tests, which may be related to cyclic oxide film damage. The influence of ECAP on corrosion fatigue susceptibility was similar to what was observed for pre-corroded samples, with an increase in the corrosion defects density for ECAP samples.
Declaration of Competing Interest
The authors declare that they have no known competing financial interests or persona! relationships that could have appeared to influ ence the work reported in this paper.
3.0 5.0 PC72h FC PC1h30 PC72h FC 0 PC1h30 O 2.5 0
I
Ê 4.0e
a
..
.,
2.0 ü+�
ü ,!! 0 ,!!..
�
..
s
Q 3.0 0 Q 0 0 1.5 -;;;'$
.; 0e
ci
u 2.0 u'ë
'ë
1.0 0:;;
,:.;
�
i
0 .$ 0;
ë5 1.0 0.50B �
(a)
(b)
0.0 0.0 AR RR RH AR RR RH AR RR RH AR RR RH AR RR RH AR RR RH 7.0 1.210' PC72h FC 0 PC1h30 PC72h FC PC1h30 6.0 0 1.0 10• 0.
(c)
E 0(d)
.::
5.0 §.,g
0 ü.,
8.0 10'�
,!!1l
4.0�
0 0 C: 0 6.010',�
,;;
Ill 3.0 0.
�
e
�$
,,
�-
uci
§
0'ë
4.010' 0 u 2.0f
8
C:'
ièi
Q 2.0 10' 1.0 0.0 0.0 AR RR RH AR RR RH AR RR RH AR RR RH AR RR RH AR RR RHFig. 12. (a) Depth; (b) equivalent diameter; (c) corroded surface ratio and (d) density of corrosion defects measured for the as-received (AR), ECAP-RR and ECAP-RH samples after pre-corrosion in the PC72h and PClh30 conditions and after corrosion fatigue tests.
Acknowledgements
The authors thank the ANRT for their financial support (Clement Rochet's PhD thesis). They also thank LEONI Wiring Systems for their financial support.
Data availability
The raw/processed data required to reproduce these findings cannot be shared at this time as the data also forrns part of an ongoing study. References
[1] Kairy SK, Rometsch PA, Diao K, Nie JF, Davies CHJ, Birbilis N. Exploring the electrochemistry of 6.xxx series aluminium alloys as a function of Si to Mg ratio Cu content, ageing conditions and microstructure. Electrochim Act.a 2016;190:92-103.
https:/ / doi.org/10.1016/j .electacta.2015.12.098.
[2] Jiang D, Wang C. Influence of microstructure on defonnation behavior and fracture mode of Al-Mg-Si alloys. Mater Sei Eng, A 2003;352:29-33. https://doi.org/10. 1016/S0921-5093(02)00456-2.
[3] Murashkin M, Medvedev A, Kazykhanov V, Krokhin A, Raab G, Enikeev N, et al. Enhanced mechanical properties and electrical conductivity in ultra:fine-grained Al 6101 alloy processed via ECAP-confonn. Metals 2015;5:2148-64. https://doi.org/ 10.3390/met5042148.
[4] Chung CS, Kim JK, Kim HK, Kim WJ. Improvement of high-cycle fatigue life in a 6061 Al alloy produced by equal channel angular pressing. Mater Sei Eng A 2002;337:39-44. https:/ /doi.org/l0.1016/S0921-5093(02)00010-2.
[5] Murashkin M, Sabirov I, Prosvirnin D, Ovid'ko I, Terentiev V, Valiev R, Dobatkin S. Fatigue behavior of an ultrafine-grained Al-Mg-Si alloy processed by high-pressure torsion. Metals 2015;5:578-90. https://doi.org/10.3390/met5020578. [6] Esmaeili A, Shaeri MH, Noghani Mf, Razaghian A. Fatigue behavior of AA7075
aluminium alloy severely defonned by equal channel angular pressing. J Alloys Compd 2018;757:324-32. https:/ /doi.org/10.1016/j.jallcom.2018.05.085. [7] Blanc C, Mankowski G. Susceptibility to pitting corrosion of 6056 aluminium alloy.
Corros Sei 1997;39:949-59. https://doi.org/10.10!6/S0010-938X(97)81160-2. [8] La.urina A, Andrieu E, Harouard J-P, Lacaze J, Lafont M-C, Odemer G, Blanc C. Corrosion behavior of 6101 aluminum alloy strands for automotive wires. J Electrochem Soc 2013;160:C569-75https://:doi.org/10.1149/2.08031 ljes. [9] Bhattamishra AK, Lal K. Microstructural srudies on the effect of Si and Cr on the
intergranular corrosion in Al-Mg-Si alloys. Mater Des 1997;18:25-8. https://doi. org/10.1016/S0261-3069(97)00027-7.
[10] Larsen MH, Walmsley JC, Lunder 0, Nisancioglu K. Effect of excess silicon and small copper content on intergranular corrosion of 6000-series aluminum alloys. J Electrochem Soc 2010;157:C61-8. https://doi.org/10.1149/1.3261804. [11] Ming Wang J, Dan Meng X, Ying Bai Y, Feng Ma G, Llu Y, Lln He C. Effect of
artificial aging on intergranular corrosion of 6063 Al alloy. Adv Mater Res 2013;842:275-8. https:/ /doi.org/10.4028/www.scientific.net/ AMR.842.275. [12] Zou Y, Liu Q, Jia Z, Xing Y, Ding L, Wang X. The intergranular corrosion behavior of
6000-series alloys with different Mg/Si and Cu content. Appl Surf Sei 2017;405:489-96. https://doi.org/10.1016/j.apsusc.2017 .02.045.
[13] Abd El Aal Ml, Sadawy MM. Influence of ECAP as grain refinement technique on microstructure evolution, mechanical properties and corrosion behavior of pure aluminum. Trans Nonferrous Met Soc China 2015;25:3865-76. https://doi.org/10. 1016/S1003-6326(15)64034-1.
[14] Korchef A, Kaboul A. Corrosion behavior of commercial aluminum alloy processed by equal channel angular pressing. Int J Corros 2013;2013:1-11. https://doi.org/ 10.1155/2013/983261.
[15] Laurino A, Andrieu E, Harouard J-P, Odemer G, Salabura J-C, Blanc C. Effect of corrosion on the fatigue life and fracture mechanisms of 6101 aluminum alloy wires
C. Rochet. et at
for car manufacturing applications. Mater Des 2014;53:236--49. https://doi.org/10. 1016/j.matdes.2013.06.079.
[16] Weber M, Eason PD, Ôzde� H, Tiryakioglu M. The effect of surface corrosion da mage on the fatigue life of 6061-T6 aluminum alloy extrusions. Mater Sei Eng A 2017;690:427-32. https://doi.org/10.1016/j.msea.2017 .03.026.
[17] Chanyathunyaroj K. Phetchcrai S, Laungsopapun G, Rengsomboon A. Fatigue characteristics of 6061 aluminum alloy subject to 3.5% NaCl environment. Int J Fatigue 2020;133:105420https://doi.org/10.1016/j.ijfatigue.2019.105420. [18] Domînguez Almaraz GM, Âvila Ambriz JL, Cadenas Calderôn E. Fatigue endurance
and crack propagation under rotating bending fatigue tests on aluminum alloy AISI 6063-T5 with controlled corrosion attack. Eng Fract Mech 2012;93:119-31.
https://doi.org/10.1016/j.engfracmech.2012.06.012.
[19] Dolley F.J, Lee B, Wei RP. The effect of pitting corrosion on fatigue life. Fatigue Fract Eng Mater Sttuct 2000;23:555-60. https://doi.org/10.1046/j.1460-2695.2000. 00323.x.
[20] Corsetti LV, Duquette DJ. The effect of mean stress and environment on corrosion fatigue behavior of 7075-T6 aluminum. Metall Trans 1974;5:1087-93. https://doi. org/10.1007 /BF02644320.
[21] Magnin T, Chambreuil A, Bayle B. The corrosion-enhanced plastieity model for stress corrosion cracking in ductile fcc alloys. Acta Mater 1996;44:1457-70.
https:/ /doi.org/10.1016/1359-6454(95)00301-0.
[22] Delafosse D, Chateau J-P, Chambreuil A, Magnin T. Dislocation-hydrogen interac tions during stress corrosion cracking in fcc metals: experiments on single crystals and numerical simulations. Mater Sei Eng A 1997;234-236:889-92. https://doi. org/10.1016/S0921-5093(97)00414-0.
[23] Mueller MP. Dependence of corrosion fatigue crack initiation mechanisms on the corrosion behavior oftwo stainless chromium steels. Corrosion 1982;38:431-6.
https:/ / doi.org/10.5006/1.3577356.
[24] Magnin T. Mechanisms of corrosion-fatigue of metallic alloys. Rev Métall 2002;99:423-32. https:/ /doi.org/10.1051/metal:2002161.
[25] Burns JT, Larsen JM, Gangloff RP. Driving forces for localized corrosion-to-fatigue crack transition in Al-Zn-Mg-Cu. Fatigue Fract Eng Mater Sttuct 2011;34:745-73.
https://doi.org/10.l l l 1/j.1460-2695.2011.01568.x.
[26] Pressouyre GM. Trap theory of Hydrogen embrittlement. Acta Metall 1980;28:895-911. https:/ /doi.org/10.1016/0001-6160(80)90106-6. [27] Shanna MM, Tomedi JD, Parks JM. A microscopie study on the corrosion fatigue of
ultra-fine grained and conventional Al-Mg alloy. Corros Sei 2015;93:180-90.
https://doi.org/10.1016/j.corsci.2015.01.020.
[28] Xu C, Schroeder S, Berbon PB, Langdon TG. Prineiples of ECAP-Conform as a continuons process for achieving grain refinement: Application to an aluminum alloy. Acta Mater 2010;58:1379---86. https://doi.org/10.1016/j.actamat.2009.10. 044.
[29] Furukawa M, Iwahashi Y, Horita Z, Nemoto M, Langdon TG. The shearing char acteristics assoeiated with equal-channel angular pressing. Mater Sei Eng A 1998;257:328-32. https://doi.org/10.1016/S0921-5093(98)00750-3. [30] Rochet C, Veran M, Rauch EF, Lowe TC, Arlaei B, Laurino A, et al. Influence of
equal-channel angular pressing on the microsnucture and corrosion behaviour of a 6:xxx aluminium alloy for automotive conductors. Corros Sei 2020. https://doi.org/ 10.1016/j .corsci. 2020.108453.
[31] Xu C, Zheng R, Hanada S, Xiao W, Ma C. Effect of hot extrusion and subsequent T6 treatment on the microsttucture evolution and tensile properties of an
Al-6Si-2Cu-0.5Mg alloy. Mater Sei Eng A 2018;710:102-10. https://doi.org/10.1016/j.msea. 2017.10.052.
[32] Lynch SP. Mechanisms of hydrogen assisted cracking - a review. International conference on hydrogen. Effects on material behaviour and corrosion deformation interactions, Moran, WY 2003;449-66.
[33] Shaeri MH, Shaeri M, Ebrahimi M, Salehi Mf, Seyyedein SH. Effect of ECAP tem perature on microsttucture and mechanical properties of Al-Zn-Mg-Cu alloy. Prog Nat Sei Mater Int 2016;26:182-91. https://doi.org/10.1016/j.pnsc.2016.03.003. [34] Ambat R, Davenport AJ, Scamans GM, Afseth A. Effect of iron-containing inter
metallic particles on the corrosion behaviour of aluminium. Carros Sei 2006;48:3455-71. https://doi.org/10.1016/j.corsci.2006.01.005. [35] Pidaparti RM, Rao AS. Analysis of pits induced stresses due to metal corrosion.
Carros Sei 2008;50:1932---8. https:/ /doi.org/10.1016/j.corsci.2008.05.003. [36] Chen GS, Wan K-C, Gao M, Wei RP, Floumoy TH. Transition from pitting to fatigue
crack growth-modeling of corrosion fatigue crack nucleation in a 2024-T3 alu minum alloy. Mater Sei Eng A 1996;219:126-32. https://doi.org/10.1016/S0921-5093(96)10414-7.
[37] Chlistovsky RM, Heffernan PJ, DuQuesnay DL. Corrosion-fatigue behaviour of 7075-T651 aluminum alloy subjected to periodic overloads. Int J Fatigue 2007;29:1941-9. https:/ /doi.org/10.1016/j.ijfatigue.2007 .01 .01 O. [38] Guérin M, Alexis J, Andrieu E, Blanc C, Odemer G. Corrosion-fatigue lifetime of
AlAl--Cu-Lithium alloy 2050 in chloride solution. Mater Des 2015;87:681-92.
https://doi.org/10.1016/j.matdes.2015.08.003.
[39] Li X-D, Wang X-S, Ren H-H, Chen Y-L, Mu Z-T. Effect ofprior corrosion state on the fatigue small cracking behaviour of 6151-T6 aluminum alloy. Corros Sei 2012;55:26-33. https:/ /doi.org/10.1016/j.corsci.2011.09.025.
[40] Rokhlin SI, Kim J-Y, Nagy H, Zoofan B. Effect of pitting corrosion on fatigue crack initiation and fatigue life. Eng Fract Mech 1999;62:425-44. https://doi.org/10. 1016/S0013-7944(98)00101-5.
[ 41] Co NEC, Burns JT. Effects of macro-scale corrosion damage feature on fatigue crack initiation and fatigue behavior. Int J Fatigue 2017;103:234-47. https://doi.org/10. 1016/j.ijfatigue.2017.05.028.
[42] van der Walde K, Hillberry BM. Initiation and shape development of corrosion nucleated fatigue cracking. Int J Fatigue 2007;29:1269--81. https://doi.org/10. 1016/j.ijfatigue.2006.10.010.
[43] Ford FP. Quantitative examination of slip-dissolution and hydrogen-embrittlement theories of cracking in aluminium alloys. Met Sei 1978;12:326-34. https://doi.org/ 10.1179/msc.1978.12.7.326.
[44] Menzemer C, Srivatsan TS. The effect of environment on fatigue crack growth be havior of aluminum alloy 5456. Mater Sei Eng A 1999;271:188-95. https://doi.org/ 10.1016/S0921-5093(99)00222-l.
[ 45] Jones DA. A unified mechanism of stress corrosion and corrosion fatigue cracking. Metall Trans A 1985;16:1133-41. https://doi.org/10.1007/BF02811682. [ 46] Menan F, Hénaff G. Synergistic action of fatigue and corrosion during crack growth
in the 2024 aluminium alloy. Proc Eng 2010;2:1441-50. https://doi.org/10.1016/j. proeng.2010.03.156.
[47] Larignon C, Alexis J, Andrieu E, Odemer G, Blanc C. The contribution of hydrogen to the corrosion of 2024 aluminium alloy exposed to thermal and environmental cycling in chloride media. Corros Sei 2013;69:211-20. https://doi.org/10.1016/j. corsci.2012.12.005.