Size fractionation as a tool for separating charcoal of different fuel source
and recalcitrance in the wild
fire ash layer
Giovanni Mastrolonardo
a,b,⁎
, Victoria A. Hudspith
c, Ornella Francioso
b, Cornelia Rumpel
d,
Daniela Montecchio
b, Stefan H. Doerr
e, Giacomo Certini
fa
Department BIOSystem Engineering - Gembloux Agro-Bio Tech, University of Liege, Avenue Maréchal Juin 27, B-5030 Gembloux, Belgium
b
Dipartimento di Scienze Agrarie, Università degli Studi di Bologna, V.le Fanin 40, 40127 Bologna, Italy
c
wildFIRE Lab, Hatherly Laboratories, University of Exeter, Exeter EX4 4PS, UK
dCNRS; Institute of Ecology and Environment Paris (IEES, UMR UPMC-UPEC-INRA -CNRS - IRD), Campus AgraParisTech, Thiverval–Grignon, France eGeography Department, Swansea University, Singleton Park, Swansea SA28PP, UK
f
Dipartimento di Scienze delle Produzioni Agroalimentari e dell'Ambiente (DISPAA), Università degli Studi di Firenze, Piazzale delle Cascine 28, 50144 Firenze, Italy
H I G H L I G H T S
• Combustion products from two forest wildfires with different severity were analysed.
• Collected material was divided into four size fractions (N2, 2–1, 1–0.5, b0.5 mm). • Size fractionation allowed isolating
charred material with distinct proper-ties.
• Specific source fuels were preferentially sorted into specific size fractions. • Mineral ash content is a reliable
indica-tor for selecting the best fractions to isolate. G R A P H I C A L A B S T R A C T
a b s t r a c t
a r t i c l e i n f o
Article history: Received 4 November 2016Received in revised form 30 March 2017 Accepted 31 March 2017
Editor: Ajit Sarmah
Charcoal is a heterogeneous material exhibiting a diverse range of properties. This variability represents a serious challenge in studies that use the properties of natural charcoal for reconstructing wildfires history in terrestrial ecosystems. In this study, we tested the hypothesis that particle size is a sufficiently robust indicator for separat-ing forest wildfire combustion products into fractions with distinct properties. For this purpose, we examined two different forest environments affected by contrasting wildfires in terms of severity: an eucalypt forest in Australia, which experienced an extremely severe wildfire, and a Mediterranean pine forest in Italy, which burned to moderate severity. We fractionated the ash/charcoal layers collected on the ground into four size frac-tions (N2, 2–1, 1–0.5, b0.5 mm) and analysed them for mineral ash content, elemental composition, chemical structure (by IR spectroscopy), fuel source and charcoal reflectance (by reflected-light microscopy), and chemi-cal/thermal recalcitrance (by chemical and thermal oxidation).
At both sites, thefinest fraction (b0.5 mm) had, by far, the greatest mass. The C concentration and C/N ratio de-creased with decreasing size fraction, while pH and the mineral ash content followed the opposite trend. The coarser fractions showed higher contribution of amorphous carbon and stronger recalcitrance. We also observed that certain fuel types were preferentially represented by particular size fractions. We conclude that the differ-ences between ash/charcoal size fractions were most likely primarily imposed by fuel source and secondarily
Keywords: Forestfire
Pyrogenic organic carbon Biochar
Black carbon
Thermal recalcitrance index Charcoal reflectance
⁎ Corresponding author at: Department BIOSystem Engineering - Gembloux Agro-Bio Tech, University of Liege, Avenue Maréchal Juin 27, B-5030 Gembloux, Belgium. E-mail address:giovanni.mastrolonardo@ulg.ac.be(G. Mastrolonardo).
http://dx.doi.org/10.1016/j.scitotenv.2017.03.295
0048-9697/© 2017 Elsevier B.V. All rights reserved.
Contents lists available atScienceDirect
Science of the Total Environment
j o u r n a l h o m e p a g e :w w w . e l s e v i e r . c o m / l o c a t e / s c i t o t e n vby burning conditions. Size fractionation can therefore serve as a valuable tool to characterise the forest wildfire combustion products, as each fraction displays a narrower range of properties than the whole sample. We pro-pose the mineral ash content of the fractions as criterion for selecting the appropriate number of fractions to analyse.
© 2017 Elsevier B.V. All rights reserved.
1. Introduction
Every year wildfires affect over 3% of Earth's vegetated land surface (Randerson et al., 2012), which has large direct consequences for the global carbon (C) cycle because of the transformation of a large amounts of organic matter (OM) to CO2(Alexis et al., 2007). However, wildfires
do not imply complete combustion of OM (González-Pérez et al., 2004; Certini et al., 2011), and the incomplete combustion residue pro-duced is a carbon-rich heterogeneous black material, typically characterised by a condensed aromatic structure. This material can ac-cumulate on the ground in large quantities across the burned area, and is referred to as pyrogenic organic matter (PyOM) or pyrogenic car-bon (PyC) (Santín et al., 2016a). PyOM represents a continuum of mate-rials showing a different degree of carbonization, which ranges from slightly charred biomass to highly condensed soot (Masiello, 2004).
Within this continuum, charcoal comprises coarse particles (mm-cm) that retain the physical and chemical properties allowing to identi-fy its biomass source (Bird and Ascough, 2012; Knicker et al., 2008; Scott, 2010). The aromatic structure gives charcoal an inherent in-creased resistance to biotic and abiotic degradation (Eckmeier et al., 2007; Wiechmann et al., 2015), which is further increased once the charcoal is buried in soil, due to enhanced physical protection, to an ex-tent that charcoal is a common source of paleoenvironmetal and archae-ological proxy data (Ascough et al., 2008).
However, charcoal is a heterogeneous material (Bird and Ascough, 2012; Pyle et al., 2015), whose variability is mostly due to differences in burning conditions (in terms of temperature, duration,flaming or smouldering conditions, oxygen availability et cetera) and source mate-rials (e.g. woody or grass vegetation, leaves or branches, conifers or broadleaves) (Bodí et al., 2014; Knicker et al., 2008; Merino et al., 2015; Santín et al., 2012; Wiechmann et al., 2015) and their interactive effect (Hatton et al., 2016). Therefore, charcoal heterogeneity is particu-larly high infire affected natural forest ecosystems, due to an often wide diversity of species, fuel types, structure and density, combined with a high spatial and temporal variability infire behaviour (temperature, flame residence time, oxygen availability) in a given fire (Pyle et al., 2015; Santín et al., 2016b).
The variability of charcoal composition and structure has obvious implications for charcoal fate in the environment (McBeath et al., 2013; Santín et al., 2016b) and, hence, on its role in the global carbon cycle (Bird et al., 2015; Santín et al., 2016a). Therefore, an important re-search need is to disentangle the complex nature of charcoal. In context, some authors have previously reported size fractionation as a means to separate charcoal pools with contrasting composition (i.e.Nocentini et al., 2010; Rumpel et al., 2007; Francioso et al., 2011). In spite of its simplicity, however, this technique is not yet extensively used to char-acterise wildfire combustion products. As highlighted byMichelotti and Miesel (2015), the current knowledge on charcoal composition and fate is primarily based on studies dealing with charcoal produced under experimental conditions in the laboratory, which it is not fully representative of charcoal from wildfires (Alexis et al., 2010; Belcher and Hudspith, 2016). More research on natural charcoal is therefore needed.
This study focuses on the ash/charcoal layer from two forests burned at different severities. This material was fractionated into four different size fractions (N2, 2–1, 1–0.5, b0.5 mm) with the aim to ascertain to which extent particle size fractionation is a reliable method to obtain
specimens with distinct composition. The size and number of fractions were those chosen byNocentini et al. (2010), in order to have a direct basis of comparison with the results of their work. Of these fractions we also evaluated the thermal recalcitrance using the thermal recalci-trance index (R50) developed byHarvey et al. (2012)for biochar, i.e.
charcoal produced under controlled standard conditions. Here, for the first time, we tested to see if this index could also be applicable to wild-fire charcoal.
2. Materials and methods 2.1. Study sites
The study sites were Orentano (hereafter called OR), 30 km east of Pisa, Central Italy, and Mount Gordon (hereafter called MG), near Mar-ysville, in the State of Victoria, south-east Australia.
OR (coordinates WGS84: 43°47′22.82″N, 10°39′52.30″E) has an ele-vation of 20 m a.s.l., a mean annual precipitation of 893 mm and a mean annual temperature of 14.3 °C. The vegetation cover was a mixed forest of Downy oak (Quercus pubescentis Willd) and Maritime pine (Pinus pinaster Aiton) with a thick understory of common fern (Pteridium aquilinum L.) and Rubus spp. In July 2011, an area of 3.3 ha underwent a wildfire considered ‘moderately to highly severe’ using the visual scales of litter and vegetation consumption proposed byChafer et al. (2004). Most of the tree stems were still standing after thefire, partly or totally scorched, while the soil was covered by an ash/charcoal layer with very little or no uncharred litter remaining. This layer was sampled three days after thefire, prior to any rain. Additional informa-tion about the site, including a picture of the burned area, is reported in
Mastrolonardo et al. (2015a).
The climate at MG, is characterised by a mean annual precipitation of 670 mm and mean annual temperature of 13 °C. The site was chosen be-cause it represented an end-member in terms offire severity. It was af-fected by the so-called‘Black Saturday fire’ in early February 2009. Fire-line intensity was estimated to have exceeded 70,000–80,000 kW m−1,
which is one of the highest reported in Australia (2009 Victorian Bush-fires Royal Commission, 2010). The sampling site (37°31′56.30″S, 145°43′17.14″E) is 3 km SW of Marysville, on the road to Narbethong, 530 m a.s.l. in elevation. It was a Eucalyptus spp. forest and the wildfire removed the entire litter layer, green vegetation, and woody stems b 10 mm in diameter. Accordingly, fire severity was classified as ‘ex-treme’, based on the classification ofChafer et al. (2004). Sampling was performed in April 2009, two months after thefire and following some light rainfall, but before the more intense precipitations of winter had caused any significant mixing or removal of material from the ash/ charcoal layer could occur via erosion. Additional information about the site, including pictures of the burned area, is reported inMastrolonardo et al. (2015a)andSantín et al. (2012).
In addition, we used published data from another study site, Migliarino (hereafter, MI), described byNocentini et al. (2010), for a di-rect comparison to our study site OR given their proximity and similar-ity in terms of vegetation. MI, which is located 30 km west of Pisa, had a Pinus pinea L. forest with a tangled bushy understory of Quercus ilex L., Smilax aspera L. and Erica arborea L. that was affected in July 2007 by a wildfire of ‘high to very high’ severity (Certini et al., 2011), based on the classification ofChafer et al. (2004).
2.2. Sampling and sample preparation
At both study sites, OR and MG, sampling involved the entire ash/ charcoal topsoil layer, which is the particulate residue of the burning, consisting of minerals and charred organic components (Bodí et al., 2014). This material was sampled on four parallel 20 m transects, laid out 5 m apart, choosing a point at 5 m intervals, but sampling just one point out two (ten samples in total each site).
At the OR site, at each sampling point the ash/charcoal layer was carefully removed by a brush within a 40 × 40 cm rigid frame, limiting, as far as possible, contamination from the underlying mineral soil. Sim-ilarly, four samples of litter layer were taken randomly in an adjacent (50 m away) unburned area and were checked for the presence of char-coal, to ensure that the charcoal analysed in this study did not derive also from a previous wildfire.
At MG, a 30 × 30 cm square was sampled at each sampling point. The cohesive nature of the moist ash/charcoal layer contrasted with the dry and highly water repellent underlying mineral soil, allowing selectively sampling the former (Doerr et al., 2010; Santín et al., 2012). Once in the laboratory, the samples were air dried and sieved into four size frac-tions:N2, 2–1, 1–0.5, b0.5 mm. Although no unburned litter remained at MG for sampling, the presence of significant amounts of charred ma-terial in the litter layer is unlikely here because of the long time that had elapsed since the previousfire in 1939 (Santín et al., 2012).
2.3. General chemical properties
The mineral ash content of the size fractions was determined gravi-metrically after dry combustion in a muffle furnace at 550 °C for 6 h. The pH was measured potentiometrically on pulverised sample by adding deionised water to a ratio 1:5. Carbon, nitrogen and hydrogen concen-trations were measured in triplicate on each sample by a Carlo Erba NA1500 elemental analyser, after pre-treatment of samples with 6 M HCl at 80 °C to eliminate carbonates (Pansu and Gautheyrou, 2006). The oxygen (O) content was calculated by difference on a dry ash-free basis. Carbon-thirteen (13C) was measured by an isotope ratio mass
spectrometer (Micromass-Optima) and reported inδ13
C per mil (‰) relative to the international standard Vienna–Pee Dee Belemite (VPDB).
2.4. Chemical recalcitrance (resistance to dichromate oxidation)
The chemical recalcitrance of charcoal in the size fractions was esti-mated on the basis of chemical oxidation resistant carbon, as originally proposed byBird and Gröcke (1997). The oxidation was performed on five replicates per size fraction. Briefly, 200 mg of sample was mixed with 40 mL of a potassium dichromate solution (0.1 M K2Cr2O7/2 M
H2SO4) and maintained at 60 °C for 24 h. Thereafter, the sample was
washed at least four times with 50 mL distilled water and the residue left to oven-dry at 50 °C. Weight loss was measured and the recovered C and N were determined by the elemental analyser. The chemical oxi-dation resistant carbon and nitrogen fraction (called COREC and COREN, respectively) were calculated through mass balance, i.e. subtracting the mass of C and N in the residue from the mass of C and N in the untreated sample.
2.5. Thermal recalcitrance (TG analysis and R50recalcitrance index)
Thermogravimetric/derivative thermogravimetric analysis (TG/ DTG) was carried out in duplicate using a TG-DTA92 instrument (SETARAM, France). Three to 10 mg of pulverised sample was weighed in an alumina crucible, isothermally heated to 30 °C for 10 min and then heated from 30 to 700 °C in a dynamic air atmosphere (airflow 8 L h−1),
at a rate of 10 °C min−1.
The R50recalcitrance index was calculated according to Eq.(1), as in Harvey et al. (2012):
R50;x¼ T50;x=T50;graphite ð1Þ
where T50, xand T50, graphiteare the temperatures corresponding to 50%
oxidation/volatilization of charcoal in sample x and graphite, respec-tively. Values for T50, xwere obtained directly from TG thermograms
that had been corrected for water and ash content. Since the instrument we used in this analysis could not reach temperatures able to complete-ly oxidise graphite (over 1000 °C), we assumed T50, graphitevalue to be
886 °C, as calculated byHarvey et al. (2012)in similar conditions to ours.
2.6. Infrared spectroscopy
Diffuse reflectance infrared Fourier transform spectroscopy (DRIFT) spectra were recorded in triplicate by a Bruker TENSOR series FT-IR Spectrophotometer (Bruker, Ettlingen, Germany) equipped with an ap-paratus for diffuse reflectance (Spectra-Tech. Inc., Stamford, CT, USA). Samples were diluted with KBr (Aldrich Chemical Co. Milwaukee, WI, USA), which was used also as background reference. Spectra were col-lected as Kubelka-Munk units. Curve-fitting analysis was performed to calculate the area under each of the individual bands by using Grams/ 386 spectroscopic software (version 6.00, Galactic Industries Corpora-tion, Salem, NH) as inMastrolonardo et al. (2015b). The integrals of the peaks relative to aromatic rings in amorphous carbon (AC) at 1590–1600 cm−1, carbonate (CO
3
2−) at 1440–1450 cm−1, and carboxyl
group at 1700–1720 cm−1 were used for multivariate statistical
analyses.
2.7. Charcoal reflectance and fuel identification
Two randomly chosen samples per site– hereafter called 1, OR-2, MG-1, and MG-2– were selected for microscopic analysis. A subsam-ple each size fraction was embedded in polyester resin and polished at the University of Exeter, UK. Three polished blocks were produced per size fraction, with the exception of the OR-1b 0.5 and 1–0.5 mm frac-tions, where the sample was plucked from the surface during polishing. The polished blocks were studied under oil with reflectance intensity (RI) 1.514 at 23 °C, using a Zeiss Axio-Scope A1 optical microscope with a TIDAS-MSP 200 microspectrometer and a ×50 objective (with ×32 eyepiece magnification). Manual reflectance measurements were taken and recorded using MSP200 v.3.47 software. Reflectance is a pho-tometric measurement of the amount of incident light that is reflected from the polished surface of a charcoal sample (Ascough et al., 2010). This measurement is compared to the amount of light reflected by a synthetic standard of known reflectance. The system was calibrated with the following standards: strontium titanite (5.41% Ro), gadolinium gallium garnet (1.719% Ro), and spinel (0.42% Ro). Each polished block was traversed in three equally spaced transects, and all encountered particles were measured in quintuplicate. In total, 680 particles were analysed (i.e. 3400 measurements).
Under reflected-light it was also possible to identify the original fuel type; this is particularly important as charcoal reflectance has been shown to vary between the fuel types burned in the same wildfire (e.g.Hudspith et al., 2014). However, fuel type identification using this method can be challenging. In fact, often the key characters required for taxonomic identification are only observed by studying multiple planes of section whereas, once the charcoal sample is embedded in resin, just one randomly orientated plane is sectioned. In this study, fuel type categories were identified only in the sufficiently coarse frac-tions, i.e.N2, 2–1, 1–0.5 mm.
2.8. Statistics
Data of size fractions from the same study site were compared by one-way ANOVA at 95% confidence level (SigmaPlot 12.0). Where data did not pass the normality test (Shapiro-Wilk) or the Equal Vari-ance Test, the Kruskal-Wallis one-way analysis of variVari-ance on ranks was used. The Tukey Test was applied to determine the statistical differ-ence between means.
Multivariate statistical analyses, Pearson correlation and Principal component analysis (PCA) were performed using IBM SPSS statistics 22. The considered variables were: AC (amorphous carbon), Carboxyl and CO3(all three calculated from integration of IR spectra); R50; C; N;
δ13C; pH; Ash. Reflectance values were not considered because of the
lack of data for thefinest fraction (b0.5 mm). 3. Results
3.1. Ash/charcoal mass and C content
At OR, the pine forest in Italy affected by a moderate severityfire, the ash/charcoal layer amounted to 5.03 Mg ha−1, which, given the mean OC concentration of 266 g kg−1, corresponded to 1.34 Mg OC ha·1. At
Mt. Gordon (MG), the eucalypt forest in Australia affected by an ex-tremely severefire, the ash/charcoal load was very high in terms of mass, amounting to 60.53 Mg ha−1(Santín et al., 2012), but its OC con-centration was quite low, 79 g kg−1, corresponding to 7.78 Mg OC ha·1
(Santín et al., 2012).
3.2. Size fractions mass and composition
At OR, theb0.5 mm fraction was the most abundant (36% of total mass), while the two coarsest fractions were quantitatively similar and amounted to 26% and 24% of total mass, respectively (Table 1;
Fig. 1). At MG, thefinest fraction was dominant in terms of mass, representing 66% of the whole, while the coarsest fraction represented just 5% (Table 1;Fig. 1).
At OR, size fractions showed a clear trend of decreasing C concentra-tion with decreasing size, from 510.4 to 168.5 g kg−1, while no trend was apparent for N, which ranged between 9.6 and 16.2 g kg−1. The C to N ratio decreased with decreasing particle size, a trend found also byNocentini et al. (2010)at Migliarino (MI), a Mediterranean pine forest affected by a high severityfire. However, at our study site OR, the C/N ratio was almost half of that measured at MI (Table 1). Mineral ash content increased with decreasing size fraction, with thefinest
fraction containing 70% ash.Nocentini et al. (2010)also observed this trend at MI, although at much lower values (8% of mineral ash in the coarsest fraction, up to 45% in thefinest fraction). Given the alkalinity of ash, also the pH increased at OR with decreasing size fraction, from 7.52 to 9.47 (Table 1).
At MG, the C content of the size fractions, ranging from 442.8 to 63.3 g C kg−1, was lower than that of the corresponding size fractions from OR. However, we found the same trends for C, N and mineral ash content according to size fractions as observed at OR (Table 1). The fin-est fraction still stored more than one third of the total C (38%) due to its high mass proportion, i.e. 66% of the total. The pH, while showing the same increasing trend with decreasing size fraction as found at OR, was considerably lower at MG (from 6.81 to 7.36;Table 1).
The H/C and O/C atomic ratios of charcoal provide an indirect indica-tion of aromaticity because charcoal formaindica-tion processes at high tem-peratures implies H and O depletion in aromatic C rings (Wiedemeier et al., 2015). While the H/C atomic ratio showed a clear trend of increas-ing values with decreasincreas-ing size for both OR and MG charcoal fractions, O/C atomic ratios did not show any trend or significant difference be-tween the fractions (Table 1). By plotting a Van Krevelen diagram of H/C and O/C values, the different size fractions cluster into distinctfields (Fig. 2). In particular, at OR the two coarsest fractions showed a degree of condensation comparable to coal materials, while the twofinest frac-tions revealed much lower condensation. These results follow the same trend found at MI byNocentini et al. (2010), despite the coarsest tion at that site showing much higher condensation than the same frac-tion at OR (Fig. 2). At MG the fractionsb2 mm showed considerably higher H/C and O/C ratios compared to OR.
Theδ13C signature of charcoal depends on both source material and
the charring conditions (Bird and Ascough, 2012; Wiedemeier et al., 2015). At OR, the bulk charcoal showed a slightly differentδ13C
signa-ture (−28.52 ± 0.48‰) with respect to unburned litter (−29.13 ± 0.27‰), because of potential preferential depletion of12C from organic
material, particularly cellulose, during heating (Bird and Ascough, 2012). Finally, no significant difference in the δ13
C signature was found between the size fractions at both sites (Table 1).
3.3. Structural features assessed by IR spectroscopy
Overall, infrared spectra of size fractions from OR showed a gradual shift of major peaks moving from coarse fractions tofiner ones (Fig. 3). All spectra were characterised by a broad signal in the region 4000–2500 cm−1, attributable to strong stretching vibration of OH
groups in Al-OH (3600–3500 cm−1) and hydroxyl linkage at around
Table 1
Mass and carbon distribution between size fractions, C and N contents and ratio, H/C and O/C atomic ratio, mineral ash residue, and pH of fractions (mean and standard deviation of n = 10). Data for MI are fromNocentini et al. (2010). Data about‘bulk charcoal’ from MG are fromSantín et al. (2012). Different superscript letters indicate significant differences (pb 0.05) between fractions from the same site as determined by Tukey post-hoc test.
Site (Code) Fraction mm Mass distribution % of total C distribution % of total C g kg−1 N g kg−1 δ13 C ‰ C/N Ash g kg−1 pH H/C O/C Orentano (OR) litter – – 466.8 ± 93 18.3 ± 2.7 −29.13 ± 0.27 25 – – – – bulk charcoal – – 266.3 ± 86 15.3 ± 0.3 −28.52 ± 0.48 17 – – – – N2 26 ± 12 40 ± 14 510.4 ± 85a 16.2 ± 0.4a −28.47 ± 0.49a 31 180 ± 58a 7.52 ± 0.61a 0.65 ± 0.10a 0.41 ± 0.26a 2–1 24 ± 4 28 ± 7 393.7 ± 42ac 19.4 ± 0.2ac −28.87 ± 0.50a 20 406 ± 69ab 7.95 ± 0.30a 0.77 ± 0.07ab 0.28 ± 0.31a 1–0.5 14 ± 2 13 ± 4 293.8 ± 79bc 16.3 ± 0.3c −28.67 ± 0.49a 18 492 ± 92ab 8.37 ± 0.75ab 0.78 ± 0.09ab 0.49 ± 0.64a b0.5 36 ± 9 19 ± 5 168.5 ± 38b 9.6 ± 0.3bc −28.33 ± 0.52a 17 701 ± 99b 9.47 ± 0.28b 0.9 ± 0.17b 0.45 ± 0.35a Migliarino (MI) N2 na 55 ± 5 660.6 ± 98.4 13.2 ± 0.6 na 50 81 ± 2 na 0.03 ± 0.01 0.25 ± 0.05 2–1 na 16 ± 2 517.4 ± 83.9 13.5 ± 2.2 na 39 111 ± 1 na 0.49 ± 0.01 0.34 ± 0.02 1–0.5 na 4 ± 0 405.2 ± 86.2 13.8 ± 5.3 na 30 111 ± 13 na 0.61 ± 0.00 0.55 ± 0.02 b0.5 na 23 ± 4 260.6 ± 79.3 13.6 ± 6.4 na 20 458 ± 45 na 0.77 ± 0.06 0.55 ± 0.04 Mt. Gordon (MG) bulk charcoal – – 79 ± na na na na – – – – N2 5 ± 3 24 ± 14 442.8 ± 134a 7.8 ± 1.7a −27.53 ± 0.64a 57 244 ± 93a 6.81 ± 0.34a 0.66 ± 0.12a 0.58 ± 0.51a 2–1 14 ± 4 17 ± 10 151.1 ± 128bc 5.2 ± 1.8b −27.44 ± 0.61a 29 744 ± 66ab 6.94 ± 0.15a 1.16 ± 0.27b 1.19 ± 0.36a 1–0.5 15 ± 3 17 ± 4 101.8 ± 24c 5.5 ± 1.3b −27.47 ± 0.44a 19 776 ± 43ab 7.15 ± 0.45a 1.34 ± 0.32bc 0.80 ± 0.30a b0.5 66 ± 8 43 ± 10 63.3 ± 9b 4.4 ± 0.7b −27.51 ± 0.45a 14 861 ± 2b 7.36 ± 0.14a 1.74 ± 27c 0.72 ± 0.21a
3400 cm−1. A shoulder between 3082 and 3066 cm−1could be assigned to CH stretching in alkanes (_CH2and_CHR) and/or aromatic rings.
The asymmetric (2930 cm−1) and symmetric (2840 cm−1)\\CH stretching appeared as a weak shoulder in all spectra, while the peaks in the range 1240–1200 cm−1probably belong to C\\N and phenolic
C\\O stretching. The region 2400–2000 cm−1showed weak peaks to
assign to the CN stretching vibration of isocyanate, nitrile and cyana-mide groups (Francioso et al., 2011; Nocentini et al., 2010).
The coarsest fraction was characterised by a shoulder at 1719 cm−1, due to C_O stretching vibration in benzene-carboxylic acids (González-Pérez et al., 2004), and a couple of partly overlapping peaks at 1350 and 1273 cm−1, due to C\\O stretching motion (Guo and Bustin, 1998). This result matches the one byNocentini et al. (2010), who at MI found carboxyl groups only in the coarsest size fraction.
All fractions showed strong bands at around both 1590 and 1400 cm−1, which decreased with decreasing particles size and might be assigned to aromatic ring vibration in amorphous carbon (Francioso et al., 2011). These groups are not IR-active, but when the C is substituted with N or O in the aromatic bonds, the symmetry of the rings is broken, promoting bond dipoles and an IR-active signal (Kaufman et al., 1989). In the spectrum of the finest fraction (b0.5 mm), these peaks almost disappeared and were overlapped by a peak at 1457 cm−1, which, like the one at 880 cm−1, reveals the pres-ence of carbonates (Tatzber et al., 2007). An increase of the signal at 1080–1035 cm−1with decreasing particle size, as also found at MI by Nocentini et al. (2010), could be attributable to almost uncharred mate-rial, and/or to minerals (Madejová, 2003) from ash, or it could be due to soil impurities present in the ash/charcoal layer sampled.
At MG, there were clear differences between size fractions larger and smaller than 1 mm (Fig. 3). The IR spectra of the 2–1 and N2 mm frac-tions showed common features, such as the presence of oxygenate groups, as displayed by the peaks in the regions 3600–3000 cm−1
(OH groups stretch) and 2600–2400 cm−1(H bonding between OH
groups), as well as at 1700 (stretching of carboxyl group in acids) and 1380 cm−1(stretching of C\\O group). The bands of amorphous carbon, which appeared at around 1600 and 1400 cm−1, were higher in these two fractions than in the smaller ones. The smaller than 1 mm fractions had much higher content in mineral components than the larger than 1 mm ones, as revealed by the more intense signals at 3600 cm−1 (OH groups in Al\\OH), 1050 cm−1(Si\\O\\Si, Si\\O stretching),
920 cm−1(Al\\OH stretching), 797 cm−1(Si\\O stretching; Si\\O\\Al
stretch), and 679 cm−1(Si\\O and Si\\O\\Al stretch). Finally, the two smallest fractions showed a band at around 1600 cm−1that could refer to the OH-bending vibrations of hydratation water molecules. 3.4. Chemical and thermal charcoal recalcitrance
Dichromate oxidation caused high loss of C and N in all size fractions (Table 2), with no clear trend or statistical difference between fractions at both sites, probably because of the large range of standard deviation values. This treatment is just one of the several used to quantify pyro-genic carbon, better expressed as chemical oxidation resistant elemen-tal C (COREC) (Reisser et al., 2016). The COREC and COREN concentrations were similar in the fractions from both study sites,
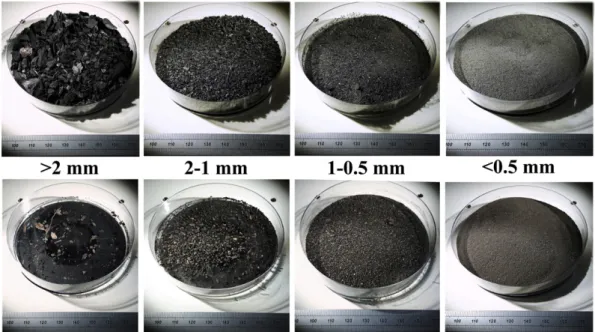
Fig. 1. The four size-fractions separated from the ash/charcoal layer at OR (above) and MG (below). These specimens were used for fuel identification and charcoal reflectance analysis.
Fig. 2. Van Krevelen plot showing the median values of the four charcoal size fractions for OR, MG and MI (data from the MI study sites are fromNocentini et al., 2010).
amounting to about 40% of initial C and 25% of initial N (Table 2). The COREC/COREN (C/N) ratio was much higher in the coarsest fraction than in the others, particularly at MG, therefore highlighting a possible higher recalcitrance of this fraction. Recalcitrance of each charcoal frac-tion was also evaluated using the Recalcitrance index R50that was
de-veloped byHarvey et al. (2012)for biochar. R50values were similar at
OR and MG, the coarsest charcoal fraction showing slightly higher values compared to the other fractions, which did not differ from each other (Table 2).
3.5. Fuel type and charcoal reflectance
In the MG samples, six fuel type categories were observed: 1) two distinct angiosperm‘wood’ types (identified basing on the presence of vessels); 2)‘bark’ (from either wood type); 3) ‘herb’ (or parenchyma/ non woody tissue); 4)‘roots’ (here representing very fine roots, which likely derive from the herbaceous surface cover, whereas potential larg-er trees roots wlarg-ere classified as ‘wood’ as they could not be differentiat-ed at this small charcoal particle size); 5) ‘soil aggregates’ and 6)‘decomposed matter’, which is strongly degraded plant material like-ly from the litter layer (Table 3). The OR samples showed the same
categories of fuel, however, one of the‘wood’ types was gymnosperm wood (based on the occurrence of pycnoxylic wood and repeating rect-angular cells), as well as charred‘needles’ (from pine trees) and ‘humi-fied matter’ (undifferentiated humi‘humi-fied plant tissues).
At OR, wood was the main parent material in the coarsest charcoal fraction (N2 mm), on average amounting to about half of the total (Table 3). In contrast, the medium fractions (2–1 mm and 1–0.5 mm) were mainly composed of herbaceous fuels and degraded plant material from the litter layer, and only to a lesser extent by wood (b28%).
At MG, the coarsest charcoal fraction was almost totally derived from wood (Table 3), whereas the medium fractions contained a wider variety of parent material, principally soil aggregates and second-arily decomposed material and wood. The considerable presence of soil aggregates is the further evidence of a contribution offire-affected min-eral soil material to the ash/charcoal material sampled. Although the fuel source composition of thefinest (b0.5 mm) fraction was not quan-tified, it seemed to be largely composed of burned soil aggregates, with a minor component of decomposed material and wood, similar to the medium fractions.
When the combined reflectance data were plotted according to size fraction and site (Fig. 4), one sample from MG (MG-1) showed a signif-icantly higher median reflectance for the coarsest fraction (N2 mm %Romedian1.79) than all the other fractions (%Romedian0.60–0.91) from
both MG samples. In contrast, at OR, median reflectance was significant-ly higher in thefine fractions than in the N2 mm one (Fig. 4). Finally, the median reflectances of the two finest fractions (b1 mm) were higher at OR than at MG (Fig. 4). As charcoal reflectance is in part governed by the fuel type (c.f.Hudspith et al., 2014), we subsequently divided the re flec-tance data in each fraction according to fuel type (Table 3). As many of the fuel type categories we identified were likely derived from the same plant material (i.e. wood, bark and needles) or source (i.e. ground fuels, including: roots, soil aggregates, humified and decomposed plant material), data were further grouped into aboveground (understory and/or canopy level including: wood, bark, herb, needle) and ground fuel categories (Fig. 5). Overall, the ground fuels typically displayed re-flectance values that were generally lower than aboveground fuels, de-spite the contrasting fuel compositions andfire behaviour between the OR and MG sites (Fig. 5). In both OR samples, in all but the 1–0.5 mm
Fig. 3. DRIFT spectra of the four size fractions from a) OR and b) MG.
Table 2
Chemical oxidation resistant carbon (COREC) and nitrogen (COREN) (mean ± standard deviation of n = 5), COREC/COREN (C/N) ratio and thermal recalcitrance index (R50;
mean ± standard deviation n = 2) of charcoal in the size fractions at both study sites. COREC and COREN values are expressed as % of initial C and N (mass balance).
Site (Code) Fraction mm COREC % COREN % C/N R50 Orentano (OR) N2 43 ± 17 21 ± 8 66 0.50 ± 0.00 2–1 38 ± 13 23 ± 9 34 0.47 ± 0.00 1–0.5 38 ± 10 25 ± 8 28 0.47 ± 0.01 b0.5 36 ± 16 28 ± 18 25 0.47 ± 0.00 Mt. Gordon (MG) N2 44 ± 7 22 ± 9 171 0.48 ± 0.00 2–1 53 ± 14 28 ± 6 49 0.46 ± 0.00 1–0.5 37 ± 5 25 ± 6 29 0.45 ± 0.00 b0.5 33 ± 7 28 ± 5 17 0.45 ± 0.00
fraction, the median reflectance of ground fuels was significantly lower than the aboveground fuels (Fig. 5). A significant difference in median reflectance between the ground and the aboveground fuels was also found in one of the two analysed samples from MG (MG-1) but not the other, where only the 1–0.5 mm fraction was significantly different from the others (Fig. 5).
3.6. Multivariate analysis
Pearson correlation coefficients are shown in supplementary materi-al (S1). Severmateri-al variables at both OR and MG were strongly and signi fi-cantly correlated each other. The mineral ash content was inversely related to R50and to the C content. The latter was directly related to N
Table 3
Fuel source and median charcoal reflectance for two randomly selected samples for each study site. Fuel sources are given as percentage of the total number of identified materials for each fraction. The total number of particles recognised is indicated in brackets. The median charcoal reflectance (Ro) values indicate the percentage of the incident light reflected.
Site Fraction Aboveground fuels Ground fuels
wood 1 wood 2 bark herb needles roots soil aggregates decomposed matter humified matter (Code) mm % (n) Ro % (n) Ro % (n) Ro % (n) Ro % (n) Ro % (n) Ro % (n) Ro % (n) Ro % (n) Ro Orentano (OR-1) N2 40 (115) 0.68 – – – – 21 (60) 1.03 – – 2 (5) 1.03 – – 26 (75) 0.6 12 (35) 0.41 1–0.5 17 (20) 1.16 – – – – 29 (35) 0.85 8 (10) 0.98 13 (15) 0.83 – – 29 (35) 1.03 4 (5) 0.65 Orentano (OR-2) N2 47 (105) 1.07 9 (20) 1.03 4 (10) 0.61 7 (15) 0.56 – – 2 (5) 0.57 – – 18 (40) 0.87 13 (30) 0.47 2–1 27 (105) 1.29 1 (5) 1.3 4 (15) 1.24 10 (40) 1.06 1 (5) 0.8 1 (5) 0.77 4 (15) 0.89 37 (141) 1.15 13 (49) 0.66 1–0.5 16 (36) 1.21 4 (10) 1.12 2 (5) 1.2 13 (30) 1.16 – – 4 (10) 0.89 2 (5) 0.77 54 (124) 1.11 – – Mt. Gordon (MG-1) N2 79 (260) 1.77 11 (35) 2.79 – – – – – – 2 (5) 0.38 – – 9 (30) 1.16 – – 2–1 35 (90) 1.09 4 (10) 1.99 8 (20) 2.09 10 (25) 0.43 – – – – 14 (35) 0.69 29 (75) 0.82 – – 1–0.5 14 (45) 0.85 – – 3 (10) 0.85 6 (20) 0.75 – – 2 (5) 0.35 59 (195) 0.61 15 (50) 0.45 – – Mt. Gordon (MG-2) N2 100 (70) 0.9 – – – – – – – – – – – – – – – – 2–1 14 (50) 1.11 3 (10) 0.82 1 (5) 0.46 1 (5) 0.43 – – – – 61 (225) 0.68 20 (75) 0.81 – – 1–0.5 9 (30) 0.89 3 (10) 1.14 3 (10) 1.01 3 (10) 1.31 – – – – 52 (175) 0.68 28 (95) 0.91 – –
Fig. 4. Boxplots of charcoal reflectance data (two replicates each study site), grouped according to size fraction. No overlaps between boxplot notches indicate significant differences in median reflectance values at a 95% confidence interval.
and R50and inversely related to pH and carboxyl. Carboxyl was directly
related to pH and ash. Carbonates were revealed only by the IR spectra of OR samples. They were directly related to ash and carboxyl and in-versely related to C, AC and R50. Finally, at MG, AC was inversely related
only to carboxyl, while at OR AC was also inversely related to pH, ash and directly related to C and R50.
The PCA outcome for both OR and MG is displayed inTable 4. At OR, two components were extracted by nine variables. Thefirst principal component explained 69.2% of the total variation, the second one 21.2%. PC1 was particularly influenced by C, AC, and R50(negative
con-tribution), pH, ash and carboxyl (positive contribution). For PC2,δ13C
had a high positive effect. At MG two components were extracted by 8 variables. Here the PC1 component explained 68.2% of the total varia-tion, the second one 16.7%. PC1 was particularly influenced by the same factors as at OR (C, AC, and R50negatively, pH and ash positively),
apart from carboxyl, which did not influence much this first component. No variable had a strong (higher than 0.80) influence on PC2. Only the δ13C value was high enough (0.76), the same variable influencing
PC2 at OR.
When a new PCA was performed combining data from OR and MG, the intersection of Factor 1 and Factor 2 highlighted that groups were clustered according to site and size fraction (Fig. 6). Overall, in both the study areas the fractionN2 mm appeared as isolated compared to the other ones, but this effect was more evident at MG than OR.
4. Discussion
4.1. Composition and recalcitrance of charcoal from OR and MG
While our results are derived from two specific forest ecosystems and should not readily extrapolated to other environments, where dif-ferent vegetation andfire characteristics may result in differing charcoal formation (e.g. grassland), our data shows many notably differences to
Fig. 5. Boxplots of reflectance data, two replicates each study site, of charcoal size fractions grouped according to aboveground fuels (gray) and ground fuels (white). No overlaps between boxplot notches indicate significant differences in median reflectance values at a 95% confidence interval.
Table 4
Factor loadings on PC1 and PC2 for both OR and MG. Factors in bold show loadingsN0.80 andb−0.80. OR PC1 PC2 MG PC1 PC2 C −0.97 −0.15 C −0.97 −0.13 N −0.65 −0.71 N −0.79 −0.33 δ13 C 0.13 0.95 δ13 C 0.60 0.76 pH 0.85 −0.05 pH 0.84 0.32 ash 0.99 0.02 ash 0.91 −0.36 AC −0.98 0.09 AC −0.83 0.48 carboxyl 0.95 0.13 carboxyl −0.69 0.38 CO3 0.79 −0.45 R 50 −0.97 −0.13 R50 −0.80 0.49
% of total variance 69.2 21.2 % of total variance 68.2 16.7 Cumulative % – 90.4 Cumulative % – 84.9
previous studies. The C concentration at both OR and MG (Table 1), for instance, were quite low as compared to previously published data for charcoal in wildfire ash from forest ecosystems (e.g.Merino et al., 2015; Nocentini et al., 2010; Wiechmann et al., 2015). Charcoal recalci-trance, as inferred by chemical oxidation treatment, was also relatively low. COREC and COREN values from both OR and MG (Table 2) were al-most half of those reported byRumpel et al. (2007), obtained on char-coal particles larger than 2 mm with an oxidation time equal to ours, for a burned agricultural soil cultivated with Job's tears. Also the thermal recalcitrance index obtained from both OR and MG was relatively low (Table 2) if evaluated on the scale proposed byHarvey et al. (2012). This scale comprises of three classes with decreasing recalcitrance: class A, with R50≥ 0.70, class B, with 0.50 ≤ R50b 0.70, and class C,
with R50b 0.50. According to this scale only the fraction N2 mm from
OR belongs to class B, while all the others fractions from both the sites belong to class C, thus denoting a generally low recalcitrance of our wildfire charcoal. Nonetheless, it is worth highlighting that this scale was designed for biochar, a material produced under very oxygen-limited conditions that can be expected to be more recalcitrant than wildfire charcoal. Moreover, despite the differences in conditions in which biochar and wildfire charcoal form,Harvey et al. (2012)noted that many of the biochar samples also belong to class C. Therefore, it seems that the R50index may be reliably used also on natural charcoal
from forest wildfire. Actually, R50index is related to the thermal stability
of a material, which is a function of bond energy. Thus, the R50index
de-pends only on the molecular arrangement and chemical composition of a material. Furthermore, the effect of different parent materials should be minimal (e.g. hardwood, softwood, grass) because the R50index is
primarily controlled by the formation conditions of char (Harvey et al., 2012). Nonetheless, further studies are needed to confirm the validity of this index on natural charcoal formed from forest ecosystems as well as from other environments.
Overall, the high mineral ash content, low C content and low recalci-trance of the charcoal from OR and MG could plausibly be explained by significant contribution from uncharred material and/or mineral soil. However, R50values of charcoal were substantially higher than those
re-ported for uncharred material (R50b 0.39;Harvey et al., 2012),
suggest-ing that the contribution from the latter was minor in all size fractions. That said, spectroscopy analysis and visual characterisation of fuel type clearly showed that, particularly at MG, the contribution from mineral soil to the ash/charcoal samples was not negligible and increased with decreasing size fraction (Fig. 3;Table 3).
A high mineral ash content would also affect the O concentration data, as these are calculated by difference (Nocentini et al., 2010; Wiedemeier et al., 2015), which does not account for the O contribution from the mineral ash. This would in turn also explain the lack of signif-icant differences of the atomic O/C ratio values between the charcoal
fractions (Table 1). As a result, all charcoal fractions from both OR and MG showed relatively low condensation degree (Fig. 2). In particular, the samples richest in mineral ash, the fractionsb2 mm from MG, showed extremely high H/C and O/C ratios and a position in the Van Krevelen diagram that is not in line with charcoal. The potential impact this type of contamination may have on the overall charcoal properties, particularly in the determination of aromaticity using O/C atomic ratio, should therefore be taken into consideration when studyingfine char-coal fractions from wildfires.
Natural post-fire mixing of mineral soil with the ash/charcoal top layer was unlikely to have occurred at OR, since the short time elapsed between wildfire and sampling. We can also exclude this at MG even so two months passed between the wildfire and sampling. The fragile ash layer was visually fully intact at all sampling locations, clear evi-dence of little or no topsoil mixing induced by wind, water or bioturba-tion. Therefore, the most likely explanation for the patterns discussed above is that the extreme burning conditions at MG led to charring and disintegration of the very top mineral soil layer, and this becoming part of the wettable ash layer, which overlay the lighter colored, struc-tured and water repellent soil layer underneath.
4.2. Relationship between size fractions andfire severity/fuel source The contrasting mass proportion of size fractions from OR and MG could indicate that higher severityfires produce charred materials with smaller sizes and a reduced proportion of organic content (Table 1). Indeed, it has been reported that charcoal particle size be-comesfiner with increasing temperatures (Bodí et al., 2014; Brook and Wittenberg, 2016). However, under the samefire conditions, ent plant species and plant parts can result in charcoal particles of differ-ent size (Bodí et al., 2014) and mineral ash content (Forbes et al., 2006). In this study, at OR and MG, both pre-fire vegetation and fire behaviour differed greatly between sites, resulting in very different charcoal for-mation conditions. Yet, as highlighted by the multivariate analyses (S1;Table 4), some of the most important variables affecting thefirst principal component analysis and explaining much of the total variance (68–69%), were the same at both study areas: pH, C and mineral ash contents, charcoal aromaticity and recalcitrance. In particular, charcoal recalcitrance, C and mineral ash contents were strongly related to each other and showed the same relationships at both sites (S1).
Notwithstanding this, there were some clear differences in the ash/ charcoal particle size composition at the two sites. At MG, the coarsest fraction (N2 mm) was distinct from the others. In fact, it was much richer in OM and the charcoal showed higher charring/condensation degree and, apparently, higher recalcitrance. This result is probably an outcome of the fact that at MG angiosperm wood was almost the only fuel source of this fraction (Table 3). Probably, only the coarsest, highly lignified woody particles were not completely turned to ash or heavily reduced in size by the extremely severefire that occurred at this site. At OR, the differences between the size fractions were consistent with those found at MG, but they were more gradual between the fractions. In particular, theN2 mm fraction was more similar to the 2–1 mm frac-tion than at MG. At OR, the source material in the coarsest fracfrac-tion com-prised wood, but also herbs and litter (Table 3). With decreasing size fraction, the ground fuels became more abundant. Here, as at MG, the gradual change in both composition and fuel types seems to confirm that parent material is a major controlling factor of the nature of size fractions.
At both sites, the charcoal in the coarsest fraction (N2 mm) showed the highest C content, aromaticity (high AC), and condensation (low H/C and O/C), which, along with the slightly higher thermal recalcitrance index (R50), is indicative of longer residence time than
the charcoal in thefiner fractions, as suggested by Ohlson et al. (2009). This is not surprising as the majority of larger charcoal pieces in this study are wood (Table 3), which likely derived from down wood already present at the forestfloor pre-fire, or trees and branches
Fig. 6. Score plot of principal component analysis (PCA), Factors 1 and 2 for the variables examined (amorphous carbon; Carboxyl; CO3; R50; C; N;δ13C; pH; ash), from OR and
fallen during thefire. These fuels can all sustain some combustion after the passage of the mainflaming front, which accounts for their higher charcoal C content and aromaticity. In contrast, thefiner charcoal frac-tions represent a broader range of charred fuel types, including ground fuels (Table 3) and thesefiner fractions may therefore give a better in-dication of the overallfire behaviour than the coarse (largely wood) charcoal alone.
In this regard, reflectance is a measureable property of charcoal that could semi-quantitatively relate to the duration of heating experienced by a given fuel (Belcher and Hudspith, 2016). This plausibly occurs be-cause charcoal reflectance progressively increases during the combus-tion process, reaching a peak value just before the charcoal is converted to mineral ash (Belcher and Hudspith, 2016). As such, fuels of a given size and type that have been heated for longer durations will be more completely combusted, resulting in smaller charcoal parti-cles with higher reflectance values (fractionated into the finer frac-tions). This is in agreement with our results from OR, where the median ground fuel charcoal reflectance in the finer fractions is signifi-cantly higher than the median reflectance of the ground fuels from the coarsest fraction (Fig. 5). This would suggest that relatively more ther-mal energy was delivered to the ground (Belcher and Hudspith, 2016), resulting in higher reflectance values for the ground fuels. Fire conditions in the canopy and in the understory are usually different (Halofsky and Hibbs, 2008; Knox and Clarke, 2016), which may partly explain why at MG charcoal reflectance was higher in aboveground fuels of the coarsest fraction than in the ground fuels (Fig. 5). At MG, during the wildfire the high wind speeds with gusts N90 km h−1
(2009 Victorian Bushfires Royal Commission, 2010) contributed to a fast-movingfire front. The resulting short fire residence time likely meant that post-frontal smouldering combustion of the ground fuels was relatively minor and that comparatively less thermal energy than at OR was delivered to the ground (as revealed by the low reflectance of ground fuels;Fig. 5), despite the high degree of fuel consumption in the understory and ground fuels (resulting in high ash production;
Table 1). Thisfinding is also supported byDoerr et al. (2010)who, at MG, highlighted the noticeable dichotomy between the extremefire in-tensity and the moderate soil burn severity, as determined by the signif-icant seedbed survival and presence of soil water repellency close to the soil surface.
4.3. Implications for future studies on freshly produced charcoal
There is an increasing need to standardize methodologies for analysing the PyOM continuum, including charcoal, and for separating fractions with narrower ranges of characteristics and residence times in soil (Bird et al., 2015). Here we have shown that sieving is a cheap and time-effective procedure to obtain fractions that comprise natural charcoal from forest wildfires with specific properties in terms of parent material, chemical composition, and recalcitrance. Considering all ash/ charcoal as whole samples, in contrast, could lead to biased results or, at best, to loss of information. At OR, for instance, elemental analysis of the whole ash/charcoal material gave a quite similar result to the 1– 0.5 mm fraction, which only represented 14% of the total mass of the whole, hence being the least abundant and representative fraction (Table 1).
The four size-fractions we focused on in this study were chosen a priori, based on the work byNocentini et al. (2010), to enable direct comparison of samples from two Italian pine forest sites, OR in this study, and MI in theirs. The best size thresholds to capture intrinsic dif-ferences of the investigated material could be site-sensitive. To limit the number of time-consuming or expensive analyses, recombination of some similar size fractions could possibly be done based on the“mineral ash content” of the fractions, which is simple to determine and seems to relate well to both elemental composition and recalcitrance (S1). On this basis, for both OR and MG samples we could recombine– or, better, after a preliminary assessment, avoid separating– the 2–1 mm and 1–
0.5 mm fractions. In fact, as well as the ash content, all the other vari-ables that were compared with the post-hoc test (i.e. C; N;δ13C; pH;
H/C; O/C) did not show any statistical difference between the two frac-tions (Table 1). This means that mixing those two fractions to reduce the number of samples to analyse would not significantly affect the quality of thefinal information. However, the IR spectra of MG may sug-gest some major structural differences between the 2–1 mm and 1–0.5 mm fractions. Consequently, determining the number of size frac-tions to be separated based on the mineral ash content alone certainly merits further investigation.
5. Conclusions
This study confirms the high variability of properties for the wild-fires combustion products in general and, in particular, for charcoal. Such variability seems to depend, at least in part, onfire severity, since we found that a higher severityfire (i.e. MG), which implied great-er consumption of fuel, led to production of a highgreat-er proportion of ash and smaller charred particles with lower recalcitrance. However, we found that also the parent fuel was an important controlling factor of charcoal properties, perhaps even more important thanfire conditions. In fact, certain fuels were apparently preferentially sorted into specific charcoal size-fractions, which showed distinct composition and recalci-trance. Size fractionation is thus a simple, fast and cheap tool for partial-ly overcoming the inherent high variability of wildfire combustion products, and enabling obtaining specimens with a narrower range of properties. The most appropriate number of fractions to analyse and their size boundaries are probably site-specific, and thus should be de-fined on a case-by-case basis. We propose for this purpose the mineral ash content of the separated size fractions as a powerful indicator of substantial similarity of two or more fractions and, thus, of the opportu-nity to recombine them for further analyses.
Acknowledgments
Thefirst author, G.M., is a Marie-Curie COFUND postdoctoral fellow, co-founded by the European Commission and the University of Liege (ref. number: 600405). The work of thefirst author, G.M., was support-ed by a mobility fellowship providsupport-ed by the European Science Founda-tion (ref. number: 3690) under the framework of the MOLTER Program (MOLecular structures as drivers and tracers of TERrestrial C fluxes). For the Mount Gordon site, sample collection and analysis were supported by a UK Natural Environment Research Council Urgency Grant (NE/F00131X/1) held by S.H. Doerr. Patrick Lane, Petter Nyman, Richard Shakesby, Gary Sheridan, and Hugh Smith supported sample collection in Australia. S.H. Doerr acknowledges support during manu-script preparation via a Leverhulme Research Fellowship (RF-2016-456\2). All Authors thank two anonymous reviewers for their useful comments on the manuscript.
Appendix A. Supplementary data
Supplementary data associated with this article can be found in the online version, athttp://dx.doi.org/10.1016/j.scitotenv.2017.03.295. These data include the Google map of the most important areas de-scribed in this article.
References
2009 Victorian Bushfires Royal Commission, 2010. Final Report. Government Printer for the State of Victoria, Melbourne, Australiahttp://pandora.nla.gov.au/pan/ 96781/20100923-0223/www.royalcommission.vic.gov.au/Commission-Reports/ Final-Report/Summary.html.
Alexis, M.A., Rasse, D.P., Rumpel, C., Bardoux, G., Péchot, N., Schmalzer, P., Drake, B., Mariotti, A., 2007.Fire impact on C and N losses and charcoal production in a scrub oak ecosystem. Biogeochemistry 82, 201–216.
Alexis, M.A., Rumpel, C., Knicker, H., Leifeld, J., Rasse, D., Péchot, N., Bardoux, G., Mariotti, A., 2010. Thermal alteration of organic matter during a shrublandfire: a field study. Org. Geochem. 41:690–697.http://dx.doi.org/10.1016/j.orggeochem.2010.03.003. Ascough, P., Bird, M., Wormald, P., Snape, C., Apperley, D., 2008.Influence of pyrolysis
var-iables and starting material on charcoal stable isotopic and molecular characteristics. Geochim. Cosmochim. Acta 72, 6090–6102.
Ascough, P.L., Bird, M.I., Scott, A.C., Collinson, M.E., Cohen-Ofri, I., Snape, C.E., Le Manquais, K., 2010. Charcoal reflectance measurements: implications for structural characteri-zation and assessment of diagenetic alteration. J. Archaeol. Sci. 37:1590–1599.
http://dx.doi.org/10.1016/j.jas.2010.01.020.
Belcher, C.M., Hudspith, V.A., 2016. The formation of charcoal reflectance and its potential use in post-fire assessments. Int. J. Wildland Fire 25:775–779.http://dx.doi.org/10. 1071/WF15185.
Bird, M.I., Ascough, P.L., 2012. Isotopes in pyrogenic carbon: a review. Org. Geochem. 42: 1529–1539.http://dx.doi.org/10.1016/j.orggeochem.2010.09.005.
Bird, M.I., Gröcke, D.R., 1997. Determination of the abundance and carbon isotope compo-sition of elemental carbon in sediments. Geochim. Cosmochim. Acta 61:3413–3423.
http://dx.doi.org/10.1016/S0016-7037(97)00157-9.
Bird, M.I., Wynn, J.G., Saiz, G., Wurster, C.M., McBeath, A., 2015. The pyrogenic carbon cycle. Annu. Rev. Earth Planet. Sci. 43:273–298. http://dx.doi.org/10.1146/annurev-earth-060614-105038.
Bodí, M.B., Martin, D.A., Balfour, V.N., Santín, C., Doerr, S.H., Pereira, P., Cerdà, A., Mataix-Solera, J., 2014. Wildland fire ash: production, composition and eco-hydro-geomorphic effects. Earth Sci. Rev.http://dx.doi.org/10.1016/j.earscirev.2013.12.007. Brook, A., Wittenberg, L., 2016. Ash-soil interface: mineralogical composition and physical
structure. Sci. Total Environ. (Ahead of Print).10.1016/j.scitotenv.2016.02.123. Certini, G., Nocentini, C., Knicker, H., Arfaioli, P., Rumpel, C., 2011. Wildfire effects on soil
organic matter quantity and quality in twofire-prone Mediterranean pine forests. Geoderma 167–168:148–155.http://dx.doi.org/10.1016/j.geoderma.2011.09.005. Chafer, C.J., Noonan, M., Macnaught, E., 2004. The post-fire measurement of fire severity
and intensity in the Christmas 2001 Sydney wildfires. Int. J. Wildland Fire 13: 227–240.http://dx.doi.org/10.1071/WF03041.
Doerr, S.H., Shakesby, R.A., Smith, H.G., Sheridan, G.J., Lane, N.J., Bell, T., Blake, W.H., 2010.
The catastrophic Victoriafires of 2009: extreme fire intensity, but only moderate soil burn severity? Reconstructingfire behaviour from soil, ash and seedbank survival data. Proceedings of the 6th International Conference on Forest Fire Research, 15–18th Nov. 2010, Coimbra, Portugal. Paper #279.
Eckmeier, E., Gerlach, R., Skjemstad, J.O., Ehrmann, O., Schmidt, M.W.I., 2007. Minor changes in soil organic carbon and charcoal concentrations detected in a temperate deciduous forest a year after an experimental slash-and-burn. Biogeosciences 4: 377–383.http://dx.doi.org/10.5194/bg-4-377-2007.
Forbes, M.S., Raison, R.J., Skjemstad, J.O., 2006. Formation, transformation and transport of black carbon (charcoal) in terrestrial and aquatic ecosystems. Sci. Total Environ. 370: 190–206.http://dx.doi.org/10.1016/j.scitotenv.2006.06.007.
Francioso, O., Sanchez-Cortes, S., Bonora, S., Roldán, M.L.M.L., Certini, G., 2011. Structural characterization of charcoal size-fractions from a burnt Pinus pinea forest by FT-IR, Raman and surface-enhanced Raman spectroscopies. J. Mol. Struct. 994:155–162.
http://dx.doi.org/10.1016/j.molstruc.2011.03.011.
González-Pérez, J.A., González-Vila, F.J., Almendros, G., Knicker, H., 2004. The effect offire on soil organic matter-a review. Environ. Int. 30:855–870.http://dx.doi.org/10.1016/ j.envint.2004.02.003.
Guo, Y., Bustin, R.M., 1998. FTIR spectroscopy and reflectance of modern charcoals and fungal decayed woods: implications for studies of inertinite in coals. Int. J. Coal Geol. 37:29–53.http://dx.doi.org/10.1016/S0166-5162(98)00019-6.
Halofsky, J.E., Hibbs, D.E., 2008. Determinants of riparianfire severity in two Oregon fires, USA. Can. J. For. Res. 38:1959–1973.http://dx.doi.org/10.1139/X08-048.
Harvey, O.R., Kuo, L.J., Zimmerman, A.R., Louchouarn, P., Amonette, J.E., Herbert, B.E., 2012. An index-based approach to assessing recalcitrance and soil carbon sequestration po-tential of engineered black carbons (biochars). Environ. Sci. Technol. 46:1415–1421.
http://dx.doi.org/10.1021/es2040398.
Hatton, P.-J., Chatterjee, S., Filley, T.R., Dastmalchi, K., Plante, A.F., Abiven, S., Gao, X., Masiello, C.A., Leavitt, S.W., Nadelhoffer, K.J., Stark, R.E., Bird, J.A., 2016. Tree taxa and pyrolysis temperature interact to control the efficacy of pyrogenic organic matter formation. Biogeochemistry 130:103–116. http://dx.doi.org/10.1007/s10533-016-0245-1.
Hudspith, V.A., Belcher, C.M., Yearsley, J.M., 2014. Charring temperatures are driven by the fuel types burned in a peatland wildfire. Front. Plant Sci. 5:714.http://dx.doi.org/10. 3389/fpls.2014.00714.
Kaufman, J.H., Metin, S., Saperstein, D.D., 1989.Symmetry breaking in nitrogen-doped amorphous carbon: infrared observation of the Raman-active G and D bands. Phys. Rev. B 39, 13053.
Knicker, H., Hilscher, A., González-Vila, F.J., Almendros, G., 2008. A new conceptual model for the structural properties of char produced during vegetationfires. Org. Geochem. 39:935–939.http://dx.doi.org/10.1016/j.orggeochem.2008.03.021.
Knox, K.J.E., Clarke, P.J., 2016. Measuringfire severity: are canopy, understorey and below-ground measures coupled in sclerophyll forestfires? Plant Ecol. 217: 607–615.http://dx.doi.org/10.1007/s11258-016-0609-6.
Madejová, J., 2003. FTIR techniques in clay mineral studies. Vib. Spectrosc. 31:1–10.
http://dx.doi.org/10.1016/S0924-2031(02)00065-6.
Masiello, C.A., 2004. New directions in black carbon organic geochemistry. Mar. Chem. 92: 201–213.http://dx.doi.org/10.1016/j.marchem.2004.06.043.
Mastrolonardo, G., Rumpel, C., Forte, C., Doerr, S.H., Certini, G., 2015a. Abundance and composition of free and aggregate-occluded carbohydrates and lignin in two forest soils as affected by wildfires of different severity. Geoderma 245–246:40–51.http:// dx.doi.org/10.1016/j.geoderma.2015.01.006.
Mastrolonardo, G., Francioso, O., Di Foggia, M., Bonora, S., Forte, C., Certini, G., 2015b. Soil pyrogenic organic matter characterisation by spectroscopic analysis: a study on com-bustion and pyrolysis residues. J. Soils Sediments 15:769–780.http://dx.doi.org/10. 1007/s11368-014-1034-x.
McBeath, A.V., Smernik, R.J., Krull, E.S., 2013. A demonstration of the high variability of chars produced from wood in bushfires. Org. Geochem. 55:38–44.http://dx.doi.org/ 10.1016/j.orggeochem.2012.11.006.
Merino, A., Chávez-Vergara, B., Salgado, J., Fonturbel, M.T., García-Oliva, F., Vega, J.A., 2015. Variability in the composition of charred litter generated by wildfire in different eco-systems. Catena 133:52–63.http://dx.doi.org/10.1016/j.catena.2015.04.016. Michelotti, L.A., Miesel, J.R., 2015. Source material and concentration of wildfire-produced
pyrogenic carbon influence post-fire soil nutrient dynamics. Forests 6:1325–1342.
http://dx.doi.org/10.3390/f6041325.
Nocentini, C., Certini, G., Knicker, H., Francioso, O., Rumpel, C., 2010. Nature and reactivity of charcoal produced and added to soil during wildfire are particle-size dependent. Org. Geochem. 41:682–689.http://dx.doi.org/10.1016/j.orggeochem.2010.03.010. Ohlson, M., Dahlberg, B., Økland, T., Brown, K.J., Halvorsen, R., 2009. The charcoal carbon
pool in boreal forest soils. Nat. Geosci. 2:692–695. http://dx.doi.org/10.1038/ ngeo617.
Pansu, M., Gautheyrou, J., 2006.Handbook of Soil Analysis: Mineralogical, Organic and In-organic Methods. Springer, New York.
Pyle, L.A., Hockaday, W.C., Boutton, T., Zygourakis, K., Kinney, T.J., Masiello, C.A., 2015. Chemical and isotopic thresholds in charring: implications for the interpretation of charcoal mass and isotopic data. Environ. Sci. Technol. 49:14057–14064.http://dx. doi.org/10.1021/acs.est.5b03087.
Randerson, J.T., Chen, Y., Van Der Werf, G.R., Rogers, B.M., Morton, D.C., 2012. Global burned area and biomass burning emissions from smallfires. J. Geophys. Res. Biogeosci. 117, G04012.http://dx.doi.org/10.1029/2012JG002128.
Reisser, M., Purves, R.S., Schmidt, M.W.I., Abiven, S., 2016. Pyrogenic carbon in soils: a lit-erature-based inventory and a global estimation of its content in soil organic carbon and stocks. Front. Earth Sci. 4:1–14.http://dx.doi.org/10.3389/feart.2016.00080. Rumpel, C., González-Pérez, J.A., Bardoux, G., Largeau, C., Gonzalez-Vila, F.J., Valentin, C.,
2007. Composition and reactivity of morphologically distinct charred materials left after slash-and-burn practices in agricultural tropical soils. Org. Geochem. 38: 911–920.http://dx.doi.org/10.1016/j.orggeochem.2006.12.014.
Santín, C., Doerr, S.H., Shakesby, R.A., Bryant, R., Sheridan, G.J., Lane, P.N.J., Smith, H.G., Bell, T.L., 2012. Carbon loads, forms and sequestration potential within ash deposits pro-duced by wildfire: new insights from the 2009 “Black Saturday” fires, Australia. Eur. J. For. Res. 131:1245–1253.http://dx.doi.org/10.1007/s10342-012-0595-8. Santín, C., Doerr, S.H., Kane, E., Masiello, C., Ohlson, M., Preston, C., de la Rosa, A., Dittmar,
T., 2016a. Towards a global assessment of pyrogenic carbon from vegetationfires. Glob. Chang. Biol. 22:76–91.http://dx.doi.org/10.1111/gcb.12985.
Santín, C., Doerr, S.H., Merino, A., Bryant, R., Loader, N.J., 2016b. Forestfloor chemical transformations in a boreal forestfire and their correlations with temperature and heating duration. Geoderma 264:71–80.http://dx.doi.org/10.1016/j.geoderma.2015. 09.021.
Scott, A.C., 2010. Charcoal recognition, taphonomy and uses in palaeoenvironmental anal-ysis. Palaeogeogr. Palaeoclimatol. Palaeoecol. 291:11–39.http://dx.doi.org/10.1016/j. palaeo.2009.12.012.
Tatzber, M., Stemmer, M., Spiegel, H., Katzlberger, C., Haberhauer, G., Mentler, A., Gerzabek, M.H., 2007. FTIR-spectroscopic characterization of humic acids and humin fractions obtained by advanced NaOH, Na4P2O7, and Na2CO3 extraction pro-cedures. J. Plant Nutr. Soil Sci. 170:522–529. http://dx.doi.org/10.1002/jpln. 200622082.
Wiechmann, M.L., Hurteau, M.D., Kaye, J.P., Miesel, J.R., 2015. Macro-particle charcoal C content following prescribed burning in a mixed-conifer forest, Sierra Nevada, California. PLoS One 10.http://dx.doi.org/10.1371/journal.pone.0135014. Wiedemeier, D.B., Abiven, S., Hockaday, W.C., Keiluweit, M., Kleber, M., Masiello, C.A.,
McBeath, A.V., Nico, P.S., Pyle, L.A., Schneider, M.P.W., Smernik, R.J., Wiesenberg, G.L.B., Schmidt, M.W.I., 2015. Aromaticity and degree of aromatic condensation of char. Org. Geochem. 78:135–143.http://dx.doi.org/10.1016/j.orggeochem.2014.10. 002.