Science Arts & Métiers (SAM)
is an open access repository that collects the work of Arts et Métiers Institute of
Technology researchers and makes it freely available over the web where possible.
This is an author-deposited version published in:
https://sam.ensam.eu
Handle ID: .
http://hdl.handle.net/10985/17263
To cite this version :
Fabrice VAUDELLE - Light scattering in thin turbid tissue including macroscopic porosities: A
study based on a Monte Carlo model - Optics Communications - Vol. 425, p.91-100 - 2018
Any correspondence concerning this service should be sent to the repository
Administrator :
[email protected]
Light scattering in thin turbid tissue including macroscopic porosities:
A study based on a Monte Carlo model
Fabrice Vaudelle
Laboratoire LAMPA, Univ Bretagne Loire, Arts et Metiers ParisTech, 2 Boulevard du Ronceray, 49035 Angers cedex 01, France
Keywords:
Porous tissue
Monte Carlo and ray tracing Adding-doubling Scattering phase function Bone
Apple
A B S T R A C T
A Monte Carlo code is built taking into account macroscopic spheroid cavities inside a turbid medium, i.e. in mixing Multi-Layer Monte Carlo (MLMC) and Monte Carlo Ray Tracing (MCRT). That simulates a tissue with a strong and heterogeneous porosity, such as flesh tissues of fruit or bone tissues. This kind of tissue, which has two scales of porosity (microscopic and macroscopic), differs notably of the homogeneous and continuous model used in the usual radiative transfer equation. The influence of the presence of spheroids can be observed on the shape of the effective phase function, on the effect related to the time-resolved diffusion solution or also on the scattering coefficient retrieved by means of the Beer–Lambert relationship. For instance, the reduced scattering coefficients retrieved thanks to time-resolved transmittance from MLMC-MCRT models having a lot of intertwined large cavities show variations coherent with those retrieved from bone tissue. Furthermore, the effect of porosity on optical transmission seems to have a real impact when relative refractive index is close to 1.
In this case, the equivalence problem between such porous MLMC-MCRT model and a homogeneous turbid medium, can be discussed at the level of the angular intensity distribution over the plane boundaries. This requires to fit this angular distribution by an Adding-Doubling model using optimized optical depth and scattering phase function. Experimental scattering phase functions obtained from apple tissues are considered in order to test this idea, and then compared with those computed with a MLMC-MCRT model.
1. Introduction
The porosity concerns different kinds of material: porous made-man media [1] such as inorganic solids or pharmaceutical powder, planetary components such as regolith [2] or snow [3], but also biological tissues such as bone [4] or flesh of fruits [5]. The permeability, the fluid impregnation [6] or the transport/stocking of gaseous chemical com-pounds [5,7] depend on the porosity structure. The porosity can also be used in engineering problems, for electromagnetic attenuation materials (for instance a SiC structure obtained from an apple structure [8]), for gas measurement by optical time-resolved method [9], for light trapping in solar cells material [10], or to improve engineering of biological tissues [4]. About this last case, fundamental questions related to the complex light-porous media interaction arose, especially about the light scattering. That is the subject developed below.
When the optical system cannot be studied easily with the help of the Electromagnetic theory, the Radiative Transport theory enables to simulate the photon migration, especially inside pseudo-continuous and pseudo-homogeneous media. Multi-layer Monte Carlo simulations (MLMC) [11] and Adding-Doubling (AD) method [12] are the widely used models, while the solution of diffusion equation is often sufficient
E-mail address:[email protected].
for large distance and moderate absorption. The AD method is limited to a slab geometry without lateral constraint. It is less flexible than MLMC, but is fast (more or less faster than MLMC [13]) and often used to retrieve optical properties of biological tissues. Moreover, when the optical properties are depth dependent, (such as the case of the near-surface human skin layers [14]), the multilayer structure can be considered for all the models, i.e. MLMC, AD and diffusion solution.
These models need parameters such as average optical coefficients (𝜇𝑎absorption and 𝜇𝑠scattering coefficients) and also a scattering phase function [15,16] (eventually replaced by the anisotropy factor g for the diffusion theory). The estimated optical coefficients and the determina-tion of scattering phase funcdetermina-tion are only achieved by the help of exper-imental data, corresponding to reflectance and transmittance of signals recorded over the external boundaries of a sample [17,18]. Particularly, the one-axis transmittance value enables to estimate the scattering coefficient or the reduced scattering coefficient 𝜇′
𝑠 = 𝜇𝑠(1 − 𝑔). How-ever, the macroscopic heterogeneities and 3D interface-discontinuities inside a heterogeneous turbid porous medium have to be taken into account to mimics light interaction in real tissues [19]. The average optical coefficients are more related to microscopic heterogeneities, and
their physical meanings may be questionable in such heterogeneous turbid media with microscopic, mesoscopic and macroscopic hetero-geneities [1,9]. For instance, the sizes of cell organelles (ribosomes, mitochondria, . . . ) in biological tissues are sub-micrometer [20], the estimated bulk scattering coefficients of the constituents being of the order of several tens mm−1 [4,20], whereas the sizes of cavities are
often sub-millimeter [4,5]. The interstitial tissue can be filled with gas or water for fruits [5,7], and with lipids tissue more or less homogeneous for bones [4], meaning different kinds of mismatch on refractive indexes.
An alternative exists to the use of a medium characterized by scattering coefficients and anisotropy factors. Monte Carlo Ray-tracing algorithm (MCRT) [3,4,21–24] was developed to study the geometrical propagation of the light through media characterized by sphere-sized particles, transparent or opaque spheroids [23], by multi-facet struc-tures or by foam strucstruc-tures [4,22]. Consequently, multiple optical rays can be drawn in specific media having strong porosity at a macroscopic or mesoscopic scale. The light scattering laws, corresponding here to the light interaction with the internal structures, are calculated thanks to the reflection–refraction laws [3], approximation of a specular law [21] or diffuse reflection laws [22,24]. The disadvantage of the MCRT is due to the difficulty to mimic the light propagation inside complex tissues such as biological tissues, where the number of components is great. This limits its interest in the assessment of the optical properties in such tissue.
In this paper, a Monte Carlo Ray-tracing code based on large spheroid compounds is combined with an usual Multi-Layer Monte Carlo code in order to study the light propagation in turbid media (meso or microscopic heterogeneities) including several cavities (macroscopic heterogeneities). The cavities are made of spheroids, overlapping or not, whose sizes are larger than the mean free path of the turbid medium surrounding the cavities. This kind of system enables to characterize the light transport inside some biological tissues such as the fruit flesh or the porous bone (osteoporosis). From the transmitted and reflected flux generated by this modified Monte Carlo code, an average efficient scattering phase function and the time-resolved transmittance can be obtained. Several geometries and refractive indexes are tested. For instance, large samples mimicking bone tissue are used to explore the effect of the size of cavities on the retrieval of reduced scattering coefficient using the time-resolved diffusion solution. Moreover, the impact of a thin thickness on the apparent scattering coefficient is discussed. The goal of these simulations is also to consider how to use the reference method AD for such thin structures, this being related to the problem of the equivalence [1,18] between a porous medium and a homogeneous turbid medium. A simple relationship between optical depth and scattering phase function is proposed inside the code of an Adding-Doubling method to find equivalent scattering coefficient and scattering phase function from the data generated by the real porous turbid medium. Finally, experimental scattering phase functions obtained from apple tissues are considered and compared with those coming from a model with cavities.
2. MLMC-MCRT Monte Carlo model
2.1. MLMC-MCRT model description
The Monte Carlo model is based on the transport of particle or photon, for which the absorption, the free path, and the deflection are governed by several probability laws. The Multi-layer Monte Carlo code [11] uses the probability exp[−(𝜇𝑎+ 𝜇𝑠)𝑠]to assess the free path s, while a Ray tracing code can use the same method to plot the trajectory points when a high coefficient 𝜇𝑡0(∼60 up 130) replaces 𝜇𝑡= 𝜇𝑎+𝜇𝑠. The deflection is depending on either a scattering phase function (p (𝜃, 𝜑) or p(𝜃) when azimuthal symmetry exists) and/or Fresnel reflection and refraction laws. Absorption and weight of photons are important topics in stochastic Monte Carlo models [11,25–27], although the absorption
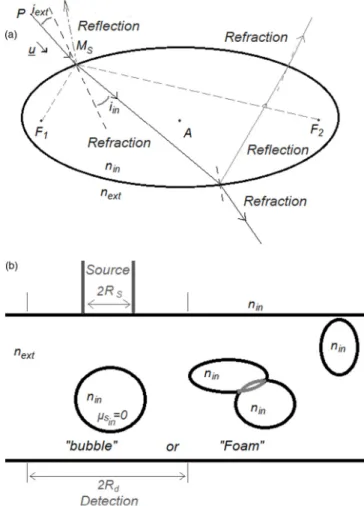
Fig. 1. (a) Scheme of the light propagation with the spheroid cavity according
to the Fresnel laws. (b) General scheme used to the MLMC-MCRT model.
influence may be small when albedo (such those used here) are close to 1. In this study, where the number of packets is mainly equal to 106(or
2–5⋅106) and the weight threshold for the ‘‘Russian roulette’’ test is 50%,
significant curves and trends were observed whatever the presence or not of small fluctuations perceived. Besides, others weight thresholds were tested (as 1%) without noticeable deviation of the results.
The Ray tracing code, used here inside the Monte Carlo algorithm, considers Fresnel reflection and refraction laws on spheroids (seen as empty pores). It searches systematically the intersection point, if it exists during the free path, with one of the spheroids incorporated in the turbid medium. This process can be repeated several times, owing to the fact that spheroids can overlap each other. The maximal number of spheroids considered here was restricted to 24 to limit the computing time, which allows to take a thickness up to few mm. The unit vector of direction 𝑢, which can be modified with respect to the Fresnel laws, and the intersection point 𝑀𝑆enable together to predict the free path inside the pore space up to exit point (Fig. 1(a)). This point is obtained from the initial point P by 𝑀𝑆= 𝑃 + 𝑘𝑢, where k is solution of the spheroidal equation
(𝑃𝑥− 𝐴𝑥+ 𝑘𝑢𝑥)2∕𝑟2𝑥+ (𝑃𝑦− 𝐴𝑦+ 𝑘𝑢𝑦)2∕𝑟2𝑦+ (𝑃𝑧− 𝐴𝑧+ 𝑘𝑢𝑧)2∕𝑟2𝑧= 1 (1) where 𝐴𝑖and 𝑟𝑖(𝑖 = 𝑥, y, z) are the components of the center and the radii of the spheroid, respectively. This gives two values corresponding to the two intersection points with the spheroid,
𝑘=− ∑𝑧 𝑥𝑢𝑖𝐴𝑖𝑃𝑖∕𝑟2𝑖±[( ∑𝑧 𝑥𝑢𝑖𝐴𝑖𝑃𝑖∕𝑟2𝑖)−( ∑𝑧 𝑥𝑢 2 𝑖∕𝑟 2 𝑖)(−1+ ∑𝑧 𝑥𝐴𝑖𝑃𝑖2∕𝑟 2 𝑖)] 1∕2 ∑𝑧 𝑥𝑢2𝑖∕𝑟2𝑖 . (2)
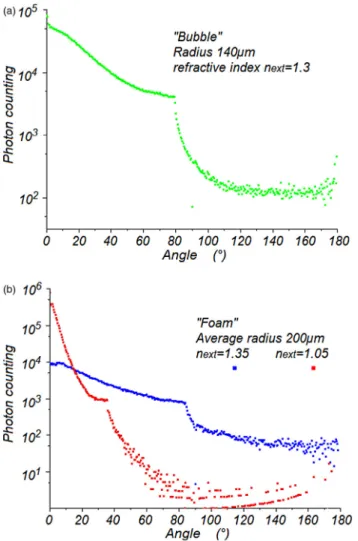
Fig. 2. Angular intensity curves related to a Monte Carlo Ray-tracing code
(simulating geometric optic) obtained (a) for a bubble inside a turbid medium with a refractive index 1.3, and (b) for intertwined spheroids inside turbid media with a refractive index 1.05 or 1.35.
The point 𝑀𝑆 enables to find 𝑢𝐴, the unit vector normal to the spheroid surface, thanks to the spheroidal focus points 𝐹1and 𝐹2(𝑢𝐴= (𝐹1𝑀𝑆∕𝐹1𝑀𝑆+ 𝐹2𝑀𝑆∕𝐹2𝑀𝑆)∕‖𝐹1𝑀𝑆∕𝐹1𝑀𝑆+ 𝐹2𝑀𝑆∕𝐹2𝑀𝑆‖), and so the new directions 𝑢𝑚can be established : 𝑢𝑚= 𝑛𝑖𝑛∕𝑛𝑒𝑥𝑡𝑢𝑚−1+[cos 𝑖𝑒𝑥𝑡− 𝑛𝑖𝑛∕𝑛𝑒𝑥𝑡cos 𝑖𝑖𝑛]𝑢𝐴 or 𝑢𝑚 = 𝑢𝑚−1− 2 cos 𝑖.𝑢𝐴, i.e. refraction or reflection direction, respectively.
The polarization of the light is not considered, so the Fresnel reflectance is computed by the formula 1∕2{sin(𝑖𝑒𝑥𝑡−𝑖𝑖𝑛)2∕ sin(𝑖𝑒𝑥𝑡+𝑖𝑖𝑛)2+ tan(𝑖𝑒𝑥𝑡− 𝑖𝑖𝑛)2∕ tan(𝑖
𝑒𝑥𝑡+ 𝑖𝑖𝑛)2}. The path length between the input and the exit points of the spheroids is also computed with the help of Eq.(1). But when the photon is outside the cavities, the usual rules related to the MLMC code are considered. The combination of this Ray tracing code and the MLMC code yields a simple but modified Monte Carlo code (MLMC-MCRT), which seems sufficient to evaluate light distribution when strong macroscopic porosity exists inside a turbid tissue. 2.2. Simulation on MCRT model
In order to test only the Ray tracing code, simulations on a few cases were performed without the use of any scattering phase function (Fig. 1(b)). That corresponds to simulate the geometrical optic model without interference. While this model does not take into account forward diffraction and interference phenomena, it provides a reason-able description of the mean angular intensity curve. For instance, the incoherent light reflected by a bubble and related only to the
optical geometry is obtained and shown inFig. 2(a), where the angular intensity curve (except the forward peak) seems coherent with the light scattered from bubbles given in literature [28,29]. Particularly, the strong decrease of the curve after a critical scattering angle region ∼80◦ can be observed. The influence of the refractive index on the
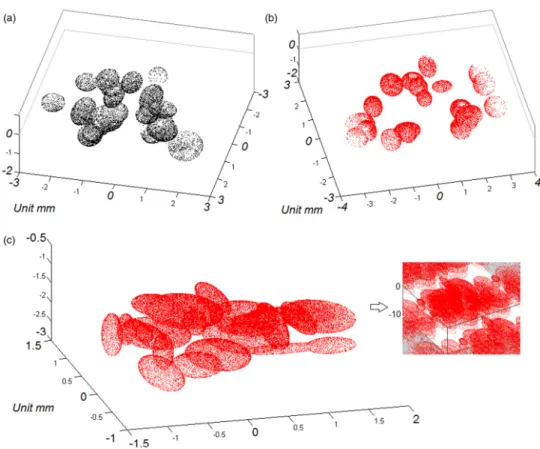
light intensity distribution is visible in another example with spheroids instead of a single spherical bubble (Fig. 2(b)). It can be noted that with Monte Carlo technique, the stochastic noise on the estimation of the mean angular intensity is significantly higher in the backward region (where multiple scattering effects are preponderant). The model related to this figure corresponds to this displayed inFig. 3(a). The three structures illustrated inFig. 3are the ones used in the next sections. The mean diameter of the spheroids is always at least 4 times larger than the mean free path 1/𝜇𝑡, (∼0.8 mm forFig. 3(a–b), ∼0.3 mm forFig. 3(c)). The number of spheroids is limited and so the detection boundary is limited.
If the MCRT models used here can described only some trends of the mean light intensity curve, the combination MLMC-MCRT has the aim to model the radiative transport of photons in turbid media with large cavities. The next sub-section details this system.
2.3. Simulation results on MLMC-MCRT
The spheroids that are linked to cases seen in Fig. 3(b) are in-corporated inside a turbid medium having optical coefficients 𝜇𝑎 = 0.01 mm−1-𝜇
𝑠=15 mm−1(or 10 mm−1) and 𝑔 = 0.95, and where the Henyey–Greenstein function is used as scattering phase function: 𝑝𝐻 𝐺(𝜃) = (1 − 𝑔
2)
4𝜋(1 + 𝑔2− 2g cos𝜃)3∕2 (3)
A flat beam with a radius of 𝑅𝑠 = 1mm illuminates a slab whose the thickness varies between 0.26 and 1.36 mm. The intensity 𝐼𝑑 is detected according to the angle of elevation 𝜃 or according to the time t, while the area of detection is a disk with a radius 𝑟𝑑 = 3mm (Fig. 3(b)) or 0.5 mm (Fig. 3(c)). Note that the average diameter size of the spheroids considered in modelsFig. 3are in the range of magnitude of the trabecular separations in bone tissue [30]. The effective scattering phase functions are obtained by the formula 𝑝𝑒𝑓 𝑓(𝜃) = 𝐼𝑑(𝜃)∕ sin(𝜃)and are displayedFigs. 4and6(a). Besides, the usual probability function of non-absorption (1 − 𝜇𝑎∕𝜇𝑡), which is used to define the decrease of the weight inside a Poissonian Monte Carlo stochastic model [25], can be perturbed by the traveling through macroscopic cavities [26]. Nevertheless, there is no impact observed on the effective scattering phase-function, whatever the fact that this probability function remains always identical or is replaced when the paths cross a pore by a function 1 − 𝜇𝑎𝐿𝑝𝑜𝑟𝑒𝑠, where 𝐿𝑝𝑜𝑟𝑒𝑠is the path length inside the pore.
First, the comparison between the case with and without spheroidal pores are given inFig. 4with different examples. For all the cases, a dis-crepancy is observed for the intensity 𝑝𝑒𝑓 𝑓(𝜃)when 𝜃<10◦. Nevertheless,
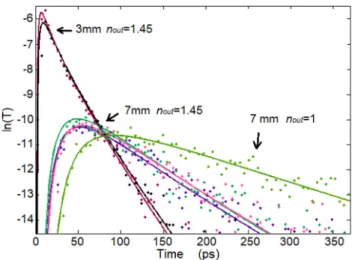
the relative refractive index n between the turbid medium and the pores influences the forward peak, in such manner than the index matching leads to an increase of the forward peak. The trivial fact, shown here, is that a very small mismatch of refractive indexes between the pores and the outside medium decreases the scattering. This idea is used in a recent study [31], where optical detection through a porous matrix is enhanced thanks to an addition of fluid having a good matching refractive index. Second, the case of bone tissue was approached from the model defined inFig. 3(c), where this model was repeated in the space in order to mimic a thick sample of thickness 3 or 7 mm. The optical coefficients (𝜇𝑎= 0.025 mm−1, 𝜇𝑠= 27mm−1and 𝑔 = 0.935) outside the cavities were chosen with respect to the reference found in literature about bone tissues [32]. Different situations were considered: -two thicknesses (3 and 7 mm), -two average sizes for the cavities (relative ratio of 1.5 for all the cavity radii between the two cases), -several choices of refractive indexes such as 𝑛𝑖𝑛𝐶 = 1.45or 1.6 for the cavities media, and 𝑛𝑜𝑢𝑡= 1.45 or 1 for the outside while 𝑛𝑒𝑥𝑡𝐵 for the bone tissue is fixed to 1.6.
Fig. 3. Three examples of structure having spheroid cavities, overlapping or not, used with the Monte Carlo code and with the Ray-tracing code added.
Table 1
Retrieved values of the reduced scattering coefficient with respect to different configurations (n𝑒𝑥𝑡𝐵fixed to 1.6). The last column shows the change of absorption due to macroscopic porosities with respect to a Poissonian model.
𝜇′
𝑠(mm−1) Thickness (mm) 𝑛𝑜𝑢𝑡 𝑛𝑖𝑛𝐶 Average cavity radius Statistical difference related to absorbed ‘‘photons’’
1.40 ± 0.05 3 1.45 1.45 0.26 mm 1.3% 1.15 ± 0.03 3 1.45 1.45 0.40 mm 4.5% 1.39 ± 0.06 7 1.45 1.45 0.26 mm 2.8% 1.44 ± 0.05 7 1.45 1.6 0.26 mm 7.7% 1.18 ± 0.05 7 1.45 1.45 0.40 mm 16.8% 1.70 ± 0.05 7 1 1.45 0.26 mm 4%
The transmitted intensity versus time was recorded in the detector area opposite to the source, and the data were fitted with the solution of diffusion equation for a slab (𝜇𝑎was always fixed to 0.025 mm−1). The absorption perturbation due to the traveling through the macroscopic cavities, cited above, can have an impact on the quantity of photons absorbed according to the average size of the pores (see last column ofTable 1), but have a small impact on the time-resolved distribution. The difference about the retrieval of 𝜇′
𝑠, between the cases where the probability function (1−𝜇𝑎∕𝜇𝑡) remains always identical or is sometimes replaced by a function 1 − 𝜇𝑎𝐿𝑝𝑜𝑟𝑒𝑠, varies between 3 and 8%. These differences are almost the same order of magnitude as those related to numerical fittings (Levenberg–Marquardt optimization method), and consequently do not modify the comments made about them.
Some results are displayed inFig. 5. The corresponding retrieved values of 𝜇′
𝑠obtained with diffusion solution are shown in theTable 1. It is first noted that a strong mismatch of the refractive index between the slab and the outside provides a reduced scattering coefficient almost identical to the one linked to the bone: ∼1.7 versus 1.755 mm−1for the
smaller average size for the cavities (0.26 mm). In the opposite case, the coefficient 𝜇′
𝑠decreases up to ∼1.4 mm
−1. Moreover and as reported
in [33], the mismatch of the refractive index between the bone and the cavities have just a small impact of a few percent on the retrieved values (for example 𝜇′
𝑠∼1.45 versus 1.4 mm
−1with 𝜇
𝑎fixed). The rise of 35% for the average size for the cavities provides a decrease of 15%–20% for
𝜇′
𝑠. This change can be compared to the one related to values retrieved in an experimental study [34] using the time-resolved transmittance on the calcaneus: a difference of ∼15% could be observed between 30 and 82 years-old volunteers. These variations can be considered as minor regarding to the error percent of the estimates.
In these large thicknesses of sample, the study of the reduced scattering coefficient thanks to the diffusion solution shows a limited impact of the heterogeneous structure such as the one build here. When the sample thickness decreases and becomes closer to the cavity size, the optical transport should be more sensitive to the porosity properties. This is the part developed in the next section thanks to the use of MLMC-MCRT method.
3. Optical characterization of a thin porous slab
3.1. Simulation results on MLMC-MCRT about scattering coefficient The scattering transport coefficient 𝜇𝑡is retrieved directly from the measurement of the maximum intensity 𝐼𝑑(𝜃 = 0) thanks to the Beer– Lambert relationship 𝐼𝑑(𝜃 = 0) = 𝐼0exp(−𝜇𝑡⋅ 𝑡ℎ𝑖𝑐𝑘𝑛𝑒𝑠𝑠)available for the thinnest thicknesses. 𝐼0 is here the number of incident photon,
i.e. 𝐼0= 106. The coefficient 𝜇𝑡can be estimated by the formulae:
𝜇𝑡= − ln [𝐼 𝑑(𝜃 = 0) 𝐼0 ] ∕𝑡ℎ𝑖𝑐𝑘𝑛𝑒𝑠𝑠 (4)
Fig. 4. Effective scattering phase functions related to the modified Monte Carlo and to some structures seen inFig. 3with a radius of a flat light source
𝑅𝑠=1 mm. Comparison between the cases with and without the addition of spheroid pores (Fig. 3(b)) in a turbid medium with a radius of the detection area 𝑅𝑑=3 mm, thickness=1.36 mm, 𝜇𝑎 = 0.01 mm−1, 𝑔 = 0.95 (𝑝𝐻 𝐺),
𝜇𝑠=15 mm−1or 10 mm−1, and refractive index 𝑛 = 1 or 1.35.
Fig. 5. Transmitted intensities versus time for different thicknesses, refractive
indexes and average size of cavities. The cavities structure is based on the model (c). or 𝜇𝑡= − ln [𝐼 𝑑(𝜃 = 0, 𝑡ℎ𝑖𝑐𝑘𝑛𝑒𝑠𝑠2) 𝐼𝑑(𝜃 = 0, 𝑡ℎ𝑖𝑐𝑘𝑛𝑒𝑠𝑠1) ] ∕𝛥𝑡ℎ𝑖𝑐𝑘𝑛𝑒𝑠𝑠 (5)
When the turbid medium is without pores, the retrieved coefficient is the true value whatever Eqs.(4)and(5)(Fig. 6(b) and (c) with 𝑛 = 1 and 𝜇𝑡𝑒𝑥𝑡 = 15.01 mm−1 outside the cavities). With the addition of pores, Eqs.(4)and(5)give different results. The Eq.(4)provides values of 𝜇𝑡close but inferior to the one linked to the initial turbid medium (𝜇𝑡∼13 mm−1), while Eq.(5)yields a low value 𝜇
𝑡= 3.1 mm−1. So, the retrieved value of the transport coefficient depends on the process used. Indeed, the meaning of the expression 𝐼𝑑(𝜃 = 0) = 𝐼0exp(−𝜇𝑡⋅
𝑡ℎ𝑖𝑐𝑘𝑛𝑒𝑠𝑠)becomes questionable concerning a heterogeneous porous
medium. Though a turbid tissue, characterized by a pure randomness, leads to a light path distribution exponential [1], accurate value of a thickness measured for a strongly heterogeneous thin slab with no smooth surface is uncertain. However, a porous medium can be seen as equivalent to a homogeneous semi-transparent medium if only its ex-tinction function is approximately modeled as an exponential law [35].
Consequently, an equivalent optical depth 𝜏, that replaces the expression 𝜇𝑡⋅ 𝑡ℎ𝑖𝑐𝑘𝑛𝑒𝑠𝑠, must be estimated to establish a homogeneous medium equivalent to a heterogeneous porous turbid medium such as the ones studied here. The word ‘‘equivalent’’ is relative to the equivalence seen through measurements made at the surface boundaries, because the radiative transport in such random heterogeneous media cannot be reproduced exactly by a classical radiative transfer equation with fixed parameters inside the volume [36].
The equivalence between a homogeneous stochastic Monte Carlo model and a complex porous structure has been achieved, when the porosity fraction is above 50% [35]. However, the MLMC-MCRT model was conceived here to explore a system with two type of porosities, i.e. the one related to bulk random microscopic components and the one related to macroscopic cavities. This kind of turbid medium with sparse empty pores can be treated as a type of pseudo-homogeneous medium inside a transport model. If the optical transport properties corresponding to the microscopic components part are known, what about those linked to the radiative transport model of this pseudo-homogeneous tissue?
3.2. Characterization of MLMC-MCRT models by an Adding-Doubling method
3.2.1. Problematic of constraints related to the Adding-Doubling method The radiative transfer is often studied by means of Monte Carlo meth-ods, but also through analytical or numerical solutions of the transport equation [1,17]. The numerical Adding-Doubling method [17] is limited to multi-layer slab without lateral constraint, but is considered as a fast and reference method to assess the optical coefficients from reflectance and transmittance measurement sets. The effective phase function 𝑝𝑒𝑓 𝑓, described in the previous section and defined independently of the radial coordinate, can be retrieved through the Adding-Doubling solution. As basic components needed to use Adding-Doubling method, an optical depth 𝜏∗, an albedo 𝑎∗and an angular distribution function ℎ∗(defined
from a scattering phase function 𝑝∗ by the relationship ℎ∗(𝜃
𝑖𝑛𝑐, 𝜃) = ∫0𝜋∕2𝑝
∗[(cos 𝜃
𝑖𝑛cos 𝜃 + sin 𝜃𝑖𝑛sin 𝜃 cos 𝜑)]𝑑𝜑) must be chosen. For small absorption and small thickness, the influence of the albedo parameter is weak, especially for the shape of the effective scattering phase function (except for the limit angle 𝜃 of 90◦). In this case, the assessment of 𝑝
𝑒𝑓 𝑓 by the Adding-Doubling method can be related only to an optical depth and a scattering phase function.
The optical depth 𝜏∗and the phase function 𝑝∗considered for the
macroscopic/microscopic porous turbid medium should be dependent on the optical depth 𝜏 and phase function p used to characterize the radiative transfer through the same turbid medium but without macroscopic porosity. A problem related to the choice of 𝜏∗ and 𝑝∗
is that they should be defined for a continuous medium, while the porosity leads to discontinuities. Nevertheless, both components can be also regarded in a statistical way. The relationship between optical depths 𝜏 and 𝜏∗can be seen as 𝜏∗ = 𝐹 𝜏 (𝐹 < 1), where F is a factor
dependent on the average occupied volume fraction, i.e. the opposite of the average porosity. The statement 𝐹 < 1 can be attributed to the fact that, in case of a thin irregular medium with random local optical depths, the average transmitted intensity ∼ exp(−𝜏∗)will always
be larger than the one yielded from a plane-parallel model characterized by an average value of the local optical depths [37]. Moreover, 𝑝∗
should take into account that an average number 𝑁𝑠𝑒of scattering events has vanished when an equivalent continuous turbid medium, who is considered in Adding-Doubling for 𝜏∗ = 𝐹 𝜏, replaces the real turbid
medium with macroscopic pores. Consequently, simple relationships of equivalence can be searched in a such manner that formulas 𝜏∗= 𝐹 𝜏and
𝑝∗=function(p, F,𝑁
𝑠𝑒) can be written. If the convolution ⊗ between two scattering events is introduced, then the last formula can be described in a symbolic manner as 𝑝∗= 𝑚 1(𝐹 )𝑝 +∑ 𝑁𝑠𝑒 𝑘=2𝑚𝑘(𝐹 )𝑝∏ 𝑁𝑠𝑒−1 𝑘=1 ⊗ 𝑝, where
𝑚𝑘(F ) are functions such as∑ 𝑁𝑠𝑒
Fig. 6. Effect of the thickness for the cases described in Fig. 4 with
𝜇𝑠𝑒𝑥𝑡=15 mm−1 and 𝑛 = 1. (a) Effective scattering phase functions obtained
for several thickness (1.36, 1.06, 0.76, 0.56, 0.36 mm). (b) Retrieved scattering transport coefficient 𝜇𝑡 with the use of Eq.(4)related to the thickness. (c) -Logarithm of the transmittance maximum according to the thickness, and retrieval of 𝜇𝑡with Eq.(5)(slope value).
Using an approximated approach with sphere models (see Ap-pendix), the following parameters are considered here: 𝑁𝑠𝑒= 3, 𝑚1(𝐹 ) =
𝐹1∕3, 𝑚2(𝐹 ) = 1 − 𝐹1∕3− (1 − 𝐹1∕3)2 and 𝑚3(𝐹 ) = (1 − 𝐹1∕3)2. The addition is controlled by a parameter 𝑓 = 𝐹1∕3to be estimated, which
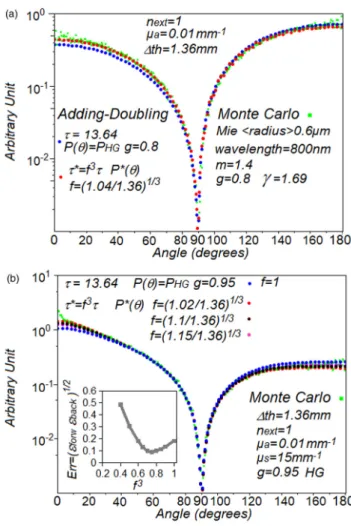
Fig. 7. Fitting, with the help of an Adding-Doubling method modified or not
modified (𝑓 = 1), of effective scattering phase functions obtained with turbid medium (𝑡ℎ𝑖𝑐𝑘𝑛𝑒𝑠𝑠 = 1.36 mm, 𝜇𝑎= 0.01 mm−1, 𝜇𝑠𝑒𝑥𝑡= 15mm−1) containing
spheroid cavities. (a) Structure related toFig. 3(a), 𝑛 = 1 and 𝑔 = 0.8 (𝑝𝑀 𝑖𝑒). (b) Structure related toFig. 3(b), 𝑛 = 1 and 𝑔 = 0.95 (𝑝𝐻 𝐺), and insert of fitting errors with respect to 𝑓3.
is also related to the one used to choose the new optical depth 𝜏∗= 𝐹 𝜏
= 𝑓3𝜏.
3.2.2. Tests on simulation models
These relationships have been set in an Adding-Doubling code writ-ten in a SCILAB software, with a sampling made according to the Radau quadrature (total points number is 96 for the range [0, 180◦]). The
absorption coefficient used to calculate the albedo is the one considered by the Monte Carlo simulation. The tests were applied on different simulation results related to modelsFig. 3(a) and (b), with light source radius 𝑅𝑠= 2.6and 1 mm respectively, Henyey–Greenstein scattering phase function 𝑝𝐻 𝐺, 𝑔 = 0.95, 𝜇𝑎 = 0.01 mm−1, 𝜇𝑠 = 15mm−1 and thickness=1.36 mm. In addition, a case was made with a scattering Mie phase function (radius=0.6±0.09 μm, wavelength 800 nm). The refractive index 𝑛 = 1 is considered below.
For the model (a), a Monte Carlo simulation related to a Mie phase function (𝑝𝑀 𝑖𝑒) was fitted in the Adding-Doubling method with a Henyey–Greenstein function using the optical anisotropy coefficient computed from the Mie phase function,⟨cos 𝜃⟩ = 0.8 (Fig. 7(a)). An efficient fitting was observed for 𝐿∗= 1.04mm (𝜏∗= 15.61).Fig. 7(b),
corresponding to the model (b) but with the phase function 𝑝𝐻 𝐺, illustrates different fittings due to different f values, i.e. thicknesses 𝐿∗going from 1.36 to 1.02 mm (𝜏∗ = 15.31), the last one giving the
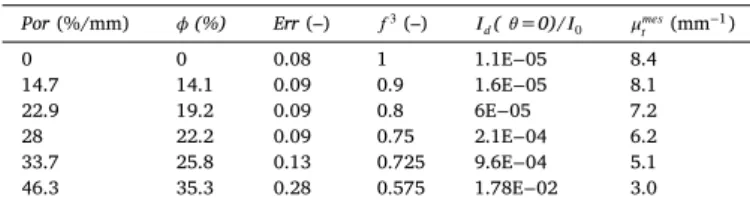
Table 2
Parameters connected to the fitting by the Adding-Doubling method (𝐸𝑟𝑟, 𝑓3)
and those linked to the Monte Carlo simulation (Por, 𝜙, I𝑑( 𝜃=0)/I0, 𝜇𝑡𝑚𝑒𝑠) when the spheroid cavities size is changed inside a slab (thickness = 1.36 mm).
Por(%/mm) 𝜙(%) Err(–) 𝑓3(–) 𝐼 𝑑( 𝜃=0)/𝐼0 𝜇𝑚𝑒𝑠𝑡 (mm −1) 0 0 0.08 1 1.1E−05 8.4 14.7 14.1 0.09 0.9 1.6E−05 8.1 22.9 19.2 0.09 0.8 6E−05 7.2 28 22.2 0.09 0.75 2.1E−04 6.2 33.7 25.8 0.13 0.725 9.6E−04 5.1 46.3 35.3 0.28 0.575 1.78E−02 3.0
related to the comparison |𝛴(𝑝𝑒𝑓 𝑓(𝜃𝑖) − 𝑝𝐴𝑑𝑑−𝐷𝑜𝑢𝑏(𝜃𝑖))∕𝛴𝑝𝑒𝑓 𝑓(𝜃𝑖)| in the forward 𝜀𝑓 𝑜𝑟𝑤 and backward 𝜀𝑏𝑎𝑐𝑘parts, with respect to 𝑓3. It is noticeable that a good fitting efficiency is achieved with 𝐿∗>0.8mm,
i.e. an equivalent thickness larger than the one used for the case of model (a).
From this model (b) the radii of the spheroids are modified in order to increase or decrease the porosity. To define the optical porosity inside the spheroidal pores per length unit, the ratio between the number of photons entering in the pores 𝑁𝑝and the number of photons launched at the surface 𝑁0 is computed, and then divided by the thickness: 𝑃 𝑜𝑟 = 𝑁𝑝∕(𝑁0 ⋅ 𝑡ℎ𝑖𝑐𝑘𝑛𝑒𝑠𝑠). Another factor called ‘‘optical porosity’’
𝜙, which depends on the average path-length measurement instead of photons number and defined in Ref. [9], is also computed. This last factor is estimated as close to the half of the real geometric porosity [9]. InTable 2, the values connected to the modified Adding-Doubling method (𝐸𝑟𝑟, 𝑓3), and the ones connected to only the simulations
(𝑃 𝑜𝑟, 𝜙, 𝐼𝑑(𝜃 = 0)∕𝐼0, 𝜇𝑚𝑒𝑠𝑡 ) are given. The same linear trend of decreas-ing are observed between 1 − 𝑃 𝑜𝑟, 1 − 𝜙 and 𝑓3, while the scattering
coefficient 𝜇𝑚𝑒𝑠
𝑡 (estimated by Eq.(4)) decreases linearly after a porosity threshold (Por ∼25% mm−1). The optimized factor 𝑓3is clearly linked
to the optical porosities, i.e. 𝜙 or Por*thickness ≈ 1.7𝜙. Nevertheless, it is noticed that the fitting error Err in the Adding-Doubling method used here becomes important for the last case Por =46% mm−1. Note that
the behavior of 𝜇𝑚𝑒𝑠
𝑡 with porosity (Por or 𝜙) is close to the one found in the Ref. [38] between an extinction coefficient and a geometrical porosity factor. Moreover, an exponential behavior of the transmittance 𝐼𝑑(𝜃 = 0)∕𝐼0 according to porosity is perceived, which has been also
observed in Ref. [39] with simulations of light propagation in foam structures with respect to different geometrical porosity factors. 3.3. Application on apple tissues
Apple flesh tissue is an example of turbid porous medium probed by Adding-Doubling method [40,41] to obtain optical coefficients, which are related to chemical and physical characteristics such as firmness, tex-ture, crunchiness properties or soluble solid content [5,42]. As reported in Refs. [40] and [41], the optical scattering and anisotropy coefficients of skin and flesh tissues retrieved by this method differ largely for a same apple specie (Braeburn cultivar): 𝜇𝑠 ∼3 mm−1−𝑔 ∼0.7 [40] and 𝜇𝑠 ∼ 12mm−1−𝑔 ∼ 0.93 [41] for the flesh tissue. This discrepancy
may be explained by the range of the sample thicknesses considered in these two studies, i.e. 𝐿 = 0.81–3.30 mm [40] and 𝐿 ∼ 0.5 mm [41]. Note that the reduced scattering coefficient 𝜇𝑠(1-g)remains of the same magnitude. In neglecting both the forward peak (∼0–5◦) and a part
of the backward domain (<140◦), an experimental scattering phase
function related to flesh apple samples has been approximately adjusted with an usual Monte Carlo model using a Henyey–Greenstein function and 𝜇𝑠= 3.33 mm−1-𝑔 = 0.7 [43]. Nevertheless, it would be interesting to estimate more accurately the optical characterization of flesh fruit tissues, which have specific heterogeneous porous microstructure [5] (the equivalent spherical diameters of pores can change from 50 to 500 μ m [5]).
If an apple flesh tissue immersed in water (such as considered in these previous studies [40,41,43]) is strongly porous, apple skin tissue
Fig. 8. Fitting by Adding-Doubling modified (line) of experimental effective
phase functions (symbol) of apple tissues copied from the Ref. [43]. (a) Skin tissue of Granny Smith cultivar. (b) Flesh tissue of Granny Smith cultivar.
can be approximated as a classical multilayer turbid medium [44], whose matter density is higher than the flesh one. In the same manner, the results related toFig. 4has shown that a large sample of flesh tissue probed with respect to the air outside can be considered as very close to a classical multilayer turbid medium. These two cases (peel tissue or probing in air) are used here to retrieve the optical properties of the turbid medium outside the cavities.
First and based on the data of the Ref. [43], the modified Adding-Doubling method can be applied to estimate optical coefficients of skin and flesh tissues. A thin sample (∼100 μm) extracted from a peel of a Granny Smith cultivar can be seen as a homogeneous layer [45] from which a scattering phase function can be evaluated. With a scattering coefficient of 40 mm−1(average value of the apple skins in Ref. [41])
and Henyey–Greenstein (HG) phase function, first moment 𝑔𝐻 𝐺can be retrieved from curve fitting (seeFig. 8(a)) and used as reference moment in Eq. (10) for the apple flesh tissues. A flesh tissue extracted from the same cultivar Granny Smith (thickness 𝐿 ∼ 280 μm) is now considered. The modified Adding-Doubling method is used for searching the best parameter 𝑓 (= 𝐹1∕3)to set in Eq. (10), in order to find an efficient
fitting on the range [0◦–140◦] (the absorption coefficient remains fixed
to 𝜇𝑎= 0.01 mm−1). The findings are depicted inFig. 8(b) for the case
where the wavelength is 784 nm. As a result, the corresponding value of the parameter f (F ) was 0.69 (0.33), the equivalent optical depth 𝜏 ∗ is 3.70, which give a scattering coefficient 𝜇∗𝑡 = 𝜏 ∗ ∕𝐿 = 13.2 mm−1 and an anisotropy coefficient 𝑔∗= 0.897. The order of magnitude of 𝜇∗
𝑡 and 𝑔∗are close to those obtained in the Ref. [41]. To my knowledge, it
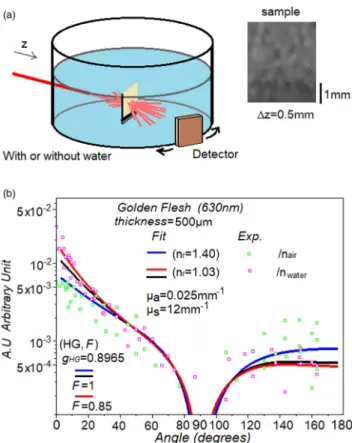
Fig. 9. (a) Scheme of an experiment made on cultivar Golden Delicious (three
samples of thickness ∼500 𝜇m) with and without immersion in water. (b) Fitting by Adding-Doubling modified (line) of experimental effective phase functions (symbol) of Golden Delicious flesh tissues with (/nwater) or without (/nair) merge
in the water.
is the first time that such relationship is proposed between the optical scattering parameters of the skin and those of the cortex of apple tissue. Second, an experiment was made on cultivar Golden Delicious (three samples of thickness ∼500 μm) with and without immersion in water (see Fig. 9(a)). The wavelength of the laser was 630 nm and it was noted that the data fluctuations were high (seeFig. 9(b)). Nevertheless, the same use of the modified Adding-Doubling method was performed with an absorption coefficient fixed at 0.025 mm−1. As a result, scattering
coefficients 12 mm−1 and 10.2 mm−1 were obtained for cases linked
to a probe without and with immersion in water, respectively. The anisotropy coefficients corresponding to these scattering coefficients
were 0.8965 and 0.8914. Contrary to the case above with the skin/flesh comparison, the difference with and without immersion leads to a parameter 𝑓 = 0.95 (𝐹 = 0.85) closer to 1, which can be related to the fact that only the greater pores interfere here and not the microscopic porosity inside the cells.
Simulations were performed with a MLMC-MCRT model (see the model displayed inFig. 10(a) with an average size of cavities radii re-duced to 120 μm) using the parameters 𝜇𝑠= 12mm−1, 𝜇
𝑎= 0.025 mm−1, 𝑔= 0.895, i.e. those found with the above fitting. This random structure has pores size close to the ones observed on the sample shown in Fig. 9(a). InFig. 10(b), the comparison is shown between the effective phase functions provided by the model (with or without cavities) and the averaged points obtained from the experimental data cited above. As seen inFig. 10(b), the effect of the cavities is small, but it can be illustrated by the simulation. However, if an importance refractive index mismatch between the cavities and the tissue exists, the approximation of a homogeneous model build with the usual MLMC model is good.
4. Conclusion
The propagation in turbid media refers to radiative transport through microscopic heterogeneities, such microscopic or mesoscopic pores. Ap-proximate or exact solutions of the radiative transport equation can be used for these pseudo-continuous systems. However, when macroscopic pores or large foam structures are added, the simulations must take into account differently the light propagation. That permits to characterize for instance the optical probing of bone tissues or cortex tissues of apple. A Monte Carlo code is here combined with a code of Ray-tracing (MLMC-MCRT) in order to simulate the photon transport either in a pseudo-continuous tissue or in large spheroid cavities. This method that is emphasized in this paper can be seen as an intermediate way between the pure homogeneous model and the real 3D mesh structure model of complex tissue hard to process.
As a result, it can be seen that the time-resolved transmittance in large sample containing a lot of cavities intertwined can be sensitive to the increase of the cavity size. The limited impact of the osteoporosis through this optical technique can be observed thanks to this kind of Monte Carlo model build here. Moreover, when the refractive index mismatch with the continuous material can be neglected, the effective scattering phase function linked to this turbid medium containing several large pores differs noticeably of the one observed for the case without macroscopic pores. Particularly, the forward peak is strongly increased, and depends on the porosity. Consequently, the measurement of the transport scattering coefficient with a decreasing exponential law becomes disputable and more sensitive to the thickness variation of the sample.
The MLMC-MCRT allows to go further into the optical character-ization in continuous mode of thin turbid sample with macroscopic
Fig. 10. (a) Structure of a MLMC-MCRT model with an average size of cavities radii reduced to 120 𝜇m. (b) Monte Carlo simulation (5 ⋅ 106photon packets and 𝑅
𝑑 is chosen as infinite) with and without cavities versus average point corresponding to the experimental data ofFig. 9(b).
porosities. This model can be used as a tool to search an equivalence between the optical probing of strong heterogeneous porous turbid medium and the one adapted to homogeneous slab. Indeed, a fast solution of the radiative transport equation based on homogeneous slab model, such the Adding-Doubling method, remains useful. This can be notably used in order to assess easily optical properties thanks to integrating-sphere that is currently used in the analysis of turbid biolog-ical tissue. It is proposed here to keep the Adding-Doubling procedure, but to add inside a new parameter related to the weight of macroscopic pores. Tests are performed for several examples build with the help of MLMC-MCRT, with different porosities but limited to media having high anisotropy. When the optical porosity due to the spheroid cavities does not exceed 50%, fitting error seems acceptable. This method is then applied to results of a previous published experiment about apple flesh tissues immersed in water, which are strongly heterogeneous porous tissues. Moreover, the influence of the refractive index mismatch can be considered with an experiment where apple flesh are immersed or not in a water tank. It can be also shown that a MLMC-MCRT simulation containing few cavities allows to reproduce the experimental light angular distributions.
The light is always assumed to be incoherent, which is a limit of this study. An improvement could be made by taking into account polarization influence in case of coherent light source. In addition, turbid media with low anisotropy and high porosities require probably more complex relationships of equivalence. Nevertheless, biological turbid tissue have usually high anisotropy, and so the method developed here can be useful to probe complex porous, such as bone tissues, especially using information of density and size of cavities based on realistic porous tissue architectures.
Acknowledgment
The author thanks Pr J.P. L’Huillier to have aided him in accomplish-ing the work presented.
Appendix
The idea of equivalence can be examined through a simple model (Fig. A.1(a)). Taking into account the model of opaque sphere dis-tributions (radius r, local density 𝜌, efficiency Q, total density 𝜌𝑇), the extinction coefficient 𝜇𝐸 (who is equal to the scattering transport coefficient 𝜇𝑡) is a function of the Mie scattering coefficient 𝜇𝑆= 𝜌𝜋𝑟2𝑄 and of the geometrical porosity fraction 𝛱 = 1 − 𝜌𝑇4𝜋𝑟3∕3 [2]. If a slab with an irregular distribution is replaced by a thinner slab with a homogeneous distribution, such as the total density 𝜌∗
𝑇 is equal to the local density, thus the value of this local density 𝜌∗and the sphere radius
𝑟∗must be changed to keep 𝜇
𝑠, 𝛱, and 𝜇𝐸 constant: 𝜇𝑆= 𝜌∗𝜋𝑟∗2𝑄(𝑟∗) = 𝜌𝜋𝑟2𝑄(𝑟) (A.1) 1 − 𝛱 = 𝜌∗4𝜋 3𝑟 ∗3= 𝜌 𝑇 4𝜋 3𝑟 3 (A.2) which lead to 𝑟∗= 𝑟𝜌𝑇 𝜌 𝑄(𝑟∗) 𝑄(𝑟) (A.3) 𝜌∗= 𝜌 ( 𝜌 𝜌𝑇 )2( 𝑄(𝑟) 𝑄(𝑟∗) )3 (A.4) Consequently, the scattering phase function changes according to the transition between r and 𝑟∗[46,47], and the new thickness of a slab
without lateral limit, 𝐿∗ ∼ 1∕𝜌∗, varies from the initial thickness 𝐿 ∼
1∕𝜌𝑇 as 𝜌𝑇∕𝜌∗= (𝑟∗∕𝑟)3. Note that the scattering phase function of an individual sphere could be more diffusing when a new radius 𝑟∗< 𝑟is
considered, while a thinner thickness 𝐿∗tends to enhance the effective
forward scattering.
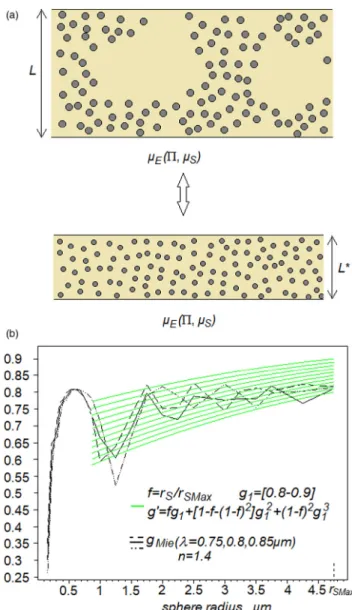
Fig. A.1. Model of spheres in a slab. (a) Scheme of a equivalence between
heterogeneous and homogeneous arrangements with geometric porosity factor and scattering coefficient kept fixed. (b) Anisotropy coefficients computed from Mie theory with respect to sphere radius 𝑟𝑆for 𝑛 = 1.4 and three wavelengths 0.75, 0.8, and 0.85 𝜇m. In addition, 𝑓 𝑔1+ [1 − 𝑓 − (1 − 𝑓 )2]𝑔21+ (1 − 𝑓 )
2𝑔3 1is
plotted for 𝑔1going from 0.8 to 0.9 and with 𝑓 = 𝑟𝑆∕𝑟𝑆𝑀 𝑎𝑥.
Moreover, the idea related to this simple model is that a parameter f used to define an equivalent angular distribution ℎ∗in an
Adding-Doubling algorithm could be in magnitude of power 1/3 the one used for the optical depth 𝜏∗(who can be seen as 𝜇
𝐸𝐿∗or 𝜇∗𝐸𝐿when 𝜏 = 𝜇𝐸L). For instance, an average trend concerning the optical anisotropy coefficient, calculated from the Lorenz–Mie theory [48] for a sphere with a radius 𝑟𝑆higher than the light wavelength, is an increase with a low slope. A similar trend can be obtained with the expression 𝑔∗(f,𝑔
1)=
𝑓 𝑔1+[1−𝑓 −(1−𝑓 )2]𝑔2 1+(1−𝑓 )
2𝑔3
1, where 𝑔1is in the range [0.8–0.9] and
𝑓∼ 𝑟𝑆as shown inFig. A.1(b). In this function 𝑔∗(1, 𝑔
1) = 𝑔1corresponds
to an estimate of the optical asymmetry coefficient when the mean sphere radius is maximum. This approximate similarity concerns the optical anisotropy coefficient, which is also the first moment of the scattering phase function. Thus, a simplified transformation proposed here between h and ℎ∗, i.e. p and 𝑝∗, is the addition of scattering event
orders higher than 1 into the expression ℎ∗(i.e. 𝑝∗):
𝑝∗(𝜃) =
∞
∑
0
= ∞ ∑ 0 (2𝑙 + 1)[𝑓 𝑔𝑙+ (1 − 𝑓 − (1 − 𝑓 )2)𝑔𝑙2+ (1 − 𝑓 ) 2𝑔3 𝑙]𝑃𝑙(cos 𝜃) (A.5) where 𝑃𝑙are the Legendre polynomials, and 𝑔𝑙 - 𝑔∗
𝑙 are the moments of 𝑝(𝜃) − 𝑝∗(𝜃). The forward scattering is reduced by the additional
components 𝑔2
𝑙 and 𝑔
3
𝑙 associated to the scattering events 2 and 3 [49]. As a recall, with the definition 𝜏 ∗= 𝜇𝐸𝐿∗, the expression 𝜏 ∗= 𝜇𝐸𝐿(𝑟∗𝑆∕𝑟𝑆𝑀 𝑎𝑥)3 = 𝜏𝑓3 is obtained. This means that 𝑝∗ = 𝑚1(𝐹 )𝑝 +
∑𝑁𝑠𝑒 𝑘=2𝑚𝑘(𝐹 )𝑝∏ 𝑁𝑠𝑒−1 𝑘=1 ⊗ 𝑝≈ 𝑓 𝑝 + [1 − 𝑓 − (1 − 𝑓 ) 2]𝑝 ⊗ 𝑝 + (1 − 𝑓 )2𝑝 ⊗ 𝑝 ⊗ 𝑝, where 𝐹 = 𝑓3, 𝑁 𝑠𝑒= 3, 𝑚1(𝐹 ) = 𝐹1∕3, 𝑚2(𝐹 ) = 1 − 𝐹1∕3− (1 − 𝐹1∕3)2
and 𝑚3(𝐹 ) = (1 − 𝐹1∕3)2. The addition is controlled by a parameter f to
be estimated, which is also related to the one used to choose the new optical depth 𝜏∗= 𝐹 𝜏 = 𝑓3𝜏.
References
[1] A.V. Malinka, Light scattering in porous materials: Geometrical optics and stereo-logical approach, J. Quant. Spectrosc. Radiat. Transfer 141 (2014) 14–23.
[2] B. Hapke, Bidirectional reflectance spectroscopy 4. The extinction coefficient and the opposition effect, Icarus 67 (1986) 264–280.
[3] T.U. Kaempfer, M.A. Hopkins, D.K. Perovich, A three-dimensional microstructure-based photon-tracking model of radiative transfer in snow, J. Geophys. Res. 112 (2007) D24113.http://dx.doi.org/10.1029/2006JD008239.
[4] E. Margallo-Balbas, P.J. French, Shape based Monte Carlo code for light transport in complex heterogeneous tissues, Opt. Express 15 (21) (2007) 14088.
[5] E. Herremans, P. Verboven, E. Bongaers, P. Estrade, B. Verlinden, M. Wevers, B. Nicolaï, Isolation of single cells and pores for the characterisation of 3D fruit tissue microstructure based on X-ray micro-CT image analysis, in: InsideFood Symposium, Leuven, Belgium, 9–12 April 2013.
[6] B. Carciofi, M. Prat, J. Laurindo, Dynamics of vacuum impregnation of apples: Experimental data and simulation results using a VOF model, J. Food Eng. 113 (2) (2012) 337–343.
[7] A.M. Sereno, M.A. Silva, L. Mayor, Determination of particle density and porosity in foods and porous materials with high moisture content, Int. J. Food Prop. 10 (3) (2007) 455–469.
[8] C. Liu, D. Yu, D.W. Kirk, Y. Xu, Porous silicon carbide derived from apple fruit with high electromagnetic absorption performance, J. Mater. Chem. C 4 (2016) 5349.
[9] T. Svensson, E. Alerstam, J. Johansson, S. Andersson-Engels, Optical porosimetry and investigations of the porosity experienced by light interacting with porous media, Opt. Lett. 35 (11) (2010) 1740–1742.http://dx.doi.org/10.1364/OL.35.001740. [10] R. Mupparapu, K. Vynck, T. Svensson, M. Burresi, D.S. Wiersma, Path length
enhancement in disordered media for increased absorption, Opt. Express 23 (24) (2015) 1472–1484.
[11] L.H. Wang, S.L. Jacques, L.Q. Zheng, MCML-Monte Carlo modeling of light transport in multilayered tissues, Comput. Methods Prog. Biol. 47 (2) (1995) 131–146.
[12] S.A. Prahl, Light Transport in Tissue, Thesis, University of Texas, 1988.
[13] A. Doronin, I. Meglinski, Peer-to-peer Monte Carlo simulation of photon migration in topical applications of biomedical optics, J. Biomed. Opt. 17 (9) (2012) 090504.
[14] I.V. Meglinski, A.N. Bashkatov, E.A. Genina, D.Yu. Churmakov, V.V. Tuchin, Study of the possibility of increasing the probing depth by the method of reflection confocal microscopy upon immersion clearing of near-surface human skin layers, Quantum Electron. 32 (10) (2002) 875–882.
[15] V.V. Tuchin, Tissue Optics: Light Scattering Methods and Instruments for Medical Diagnosis, second ed., Bellingham SPIE, 2007.
[16] T.J. Hendricks, J.R. Howell, Absorption/scattering coefficients and scattering phase function in reticulated porous ceramics, ASME J. Heat Transfer 118 (1996) 79–87.
[17] S.A. Prahl, M.J.C. van Gemert, A.J. Welch, Determining the optical properties of turbid media using the Adding-Doubling method, Appl. Opt. 32 (4) (1993) 559–568.
[18] J. Taine, F. Bellet, V. Leroy, E. Iacona, Generalized radiative transfer equation for porous medium upscaling: Application to the radiative Fourier law, Int. J. Heat Mass Transfer 53 (2010) 4071–4081.
[19] P.S. Coray, Experimental Determination of Spectral Radiative Heat Transfer Proper-ties in Participing Media (thesis for the degree of Doctor of Sciences), ETH Zurich, 2010.
[20] R. Watté, B. Aernouts, R. Van Beers, E. Herremans, Q. Tri Ho, P. Verboven, B. Nicolaï, W. Saeys, Modeling the propagation of light in realistic tissue structures with MMC-fpf: a meshed Monte Carlo method with free phase function, Opt. Express 23 (2015) 17467–17486.
[21] O. Gonzalez, S. Rodrıguez, R. Perez-Jimenez, B.R. Mendoza, A. Ayala, Comparison of Monte Carlo ray-tracing and photon-tracing methods for calculation of the impulse response on indoor wireless optical channels, Opt. Express 19 (3) (2011) 1997–2005.
[22] J. Petrasch, P. Wyss, A. Steinfeld, Tomography-based Monte Carlo determination of radiative properties of reticulate porous ceramics, J. Quant. Spectrosc. Radiat. Transfer 105 (2007) 180–197.
[23] Y. Yi Jia Yuan, Kuan.Fang. Ren, C. Rozé, T. Girasole, Extended geometrical optics approximation and Monte Carlo ray tracing for light scattering by an irregular object, in: 15th Int Symp on Applications of Laser Techniques to Fluid Mechanics Lisbon, Portugal, 05–08 July, 2010.
[24] D. Stankevicha, Yu. Shkuratov, Ye. Grynko, K. Muinonen, Computer simulations for multiple scattering of light rays in systems of opaque particles, J. Quant. Spectrosc. Radiat. Transfer 76 (2003) 1–16.
[25] C.K. Hayakawa1, J. Spanier, V. Venugopalan, Comparative analysis of discrete and continuous absorption weighting estimators used in monte carlo simulations of radiative transport in turbid media, J. Opt. Soc. Amer. A 31 (2) (2014) 301–311.
[26] A.B. Kostinski, On the extinction of radiation by a homogeneous but spatially correlated random medium, J. Opt. Soc. Amer. A 18 (2001) 1929–1933.
[27] J.M. Schmitt, K. Ben-Letaief, Efficient Monte Carlo simulation of confocal mi-croscopy in biological tissue, J. Opt. Soc. Amer. A 13 (1996) 952–961.
[28] M.P.L. Sentis, F. Onofri, L. Méès, S. Radev, Scattering of light by large bubbles: Coupling of geometrical and physical optics approximations, J. Quant. Spectrosc. Radiat. Transf. 170 (2016) 8–18.
[29] X. Zhang, M. Lewis, M. Lee, B. Johnson, G. Korotaev, The volume scattering function of natural bubble populations, Limnol. Oceanogr. 47 (5) (2002) 1273–1282.
[30] M. Georgiadis, M. Guizar-Sicairos, O. Gschwend, P. Hangartner, O. Bunk, R. Müller, P. Schneider, Ultrastructure organization of human trabeculae assessed by 3D sSAXS and relation to bone microarchitecture, PLoS One 11 (8) (2016).http://dx.doi.org/ 10.1371/journal.pone.0159838.
[31] M.S. Wiederoder, L. Peterken, A.X. Lu, O.D. Rahmanian, S.R. Raghavan, D.L. DeVoe, Optical detection enhancement in porous volumetric microfluidic capture elements using refractive index matching fluids, Analyst 140 (16) (2015) 5724–5731.
[32] M. Firbank, M. Hiraoka, M. Essenpreis, D.T. Delpy, Measurement of the optical properties of the skull in the wavelength range 650–950 nm, Phys. Med. Biol. 38 (1993) 503–510.
[33] E. Margallo-Balbas, P. Taroni, A. Pifferi, J.H. Koolstra, L.V. Ruijven, P.J. French, The impact of morphology on light transport in cancellous bone, Phys. Med. Biol. 55 (2010) 4917–4931.
[34] A. Pifferi, A. Torricelli, P. Taroni, A. Bassi, E. Chikoidze, E. Giambattistelli, R. Cubeddu, Optical biopsy of bone tissue: a step toward the diagnosis of bone pathologies, J. Biomed. Opt. 9 (2004) 474–480.
[35] J. Taine, E. Iacona, F. Bellet, Radiation in porous media: an upscaling methodology, G.G.M. Stoffels, T.H. van der Meer and A.A. van Steenhoven, in: 5th European Thermal-Sciences Conference (EUROTHERM), Eindhoven, Netherlands, May 2008. [36] A.B. Davis, M. Mineev-Weinstein, Radiative transport through random media rep-resented as measurable functions: positive versus negative spatial correlations, in: International Conference on Mathematics Computational Methods & Reactor Physics (M&C 2009), Saratoga Springs, New York, 2009.
[37] W.I. Newman, J.K. Lew, G.L. Siscoe, R.G. Fovell, Systematic effects of randomness in radiative transfer, J. Atmos. Sci. 52 (1995) 427–435.
[38] F. Bellet, E. Chalopin, F. Fichot, E. Iacona, J. Taine, RDFI determination of anisotropic and scattering dependent radiative conductivity tensors in porous media: Application to rod bundles, Int. J. Heat Mass Transfer 52 (5–6) (2009) 1544–1551.
[39] S. Guévelou, B. Rousseau, G. Domingues, J. Vicente, A simple expression for the normal spectral emittance of open-cell foams composed of optically thick and smooth struts, J. Quant. Spectrosc. Radiat. Transfer 189 (2017) 329–338.
[40] W. Saeys, M.A. Velazco-Roa, S.N. Thennadil, H. Ramon, B.M. Nicolaï, Optical properties of apple skin and flesh in the wavelength range from 350 to 2200 nm, Appl. Opt. 47 (7) (2008) 908–919.
[41] R. Van Beers, B. Aernouts, R. Watté, A. Schenk, B. Nicolai, W. Saeys, Effects of maturation on the bulk optical properties of apple skin and cortex in the 500-1850 nm wavelength range, J. Food Eng. 214 (2017) 79–89.
[42] D. Hu, X.P. Fu, A.C. Wang, Y.B. Ying, Measurement methods for optical absorption and scattering properties of fruits and vegetables, Trans. ASABE 58 (5) (2015) 1387– 1401.http://dx.doi.org/10.13031/trans.58.11103.
[43] M.L. Askoura, F. Vaudelle, J.-P. L’Huillier, Multispectral measurement of scattering-angular light distribution in apple skin and flesh samples, Appl. Opt. 55 (32) (2016) 9217–9225.
[44] F. Vaudelle, J.P. L’Huillier, M.L. Askoura, Light source distribution and scattering phase function influence light transport in diffuse multi-layered media, Opt. Com-mun. 392 (2017) 268–281.
[45] M.L. Askoura, F. Vaudelle, J.P. L’Huillier, Experimental study of light propagation in apple tissues using a multispectral imaging system, Photonics 3 (50) (2016).
http://dx.doi.org/10.3390/photonics3030050.
[46] A.M.K. Nilsson, C. Sturesson, D.L. Liu, S. Andersson-Engels, Changes in spectral shape of tissue optical properties in conjunction with laser-induced thermotherapy, Appl. Opt. 37 (7) (1998) 1256–1267.
[47] S. Chamot, E. Migacheva, O. Seydoux, P. Marquet, C. Depeursinge, Physical interpre-tation of the phase function related parameter 𝛾 studied with a fractal distribution of spherical scatterers, Opt. Express 18 (23) (2010) 23664–23675.
[48] C.F. Bohren, D.R. Huffman, Absorption and Scattering of Light By Small Particles, Wiley, 1983.
[49] F. Vaudelle, Approximate analytical effective phase function obtained for a thin slab geometry, J. Quant. Spectrosc. Radiat. Transfer 193 (2017) 47–56.