Science Arts & Métiers (SAM)
is an open access repository that collects the work of Arts et Métiers Institute of Technology researchers and makes it freely available over the web where possible.
This is an author-deposited version published in: https://sam.ensam.eu Handle ID: .http://hdl.handle.net/10985/10361
To cite this version :
Muhamad Fatikul ARIF, Fodil MERAGHNI, Nicolas SAINTIER, Yves CHEMISKY, Joseph FITOUSSI, Gilles ROBERT - Fatigue damage investigation of PA66/GF30 by X-Ray microtomography - 2014
Any correspondence concerning this service should be sent to the repository Administrator : archiveouverte@ensam.eu
Science Arts & Métiers (SAM)
is an open access repository that collects the work of Arts et Métiers ParisTech researchers and makes it freely available over the web where possible.
This is an author-deposited version published in: http://sam.ensam.eu Handle ID: .http://hdl.handle.net/null
To cite this version :
Muhamad Fatikul ARIF, Fodil MERAGHNI, Nicolas SAINTIER, Yves CHEMISKY, Joseph FITOUSSI, Gilles ROBERT - Fatigue damage investigation of PA66/GF30 by X-Ray microtomography - 2014
Any correspondence concerning this service should be sent to the repository Administrator : archiveouverte@ensam.eu
FATIGUE DAMAGE INVESTIGATION OF PA66/GF30
BY X-RAY MICROTOMOGRAPHY
M.F. Arif a, F. Meraghnia*, N. Saintier b, Y. Chemiskya, J. Fitoussic, G. Robertd
a
Arts et Métiers ParisTech, LEM3–UMR CNRS 7239, 4 Rue Augustin Fresnel, 57078 Metz, France
b
Arts et Métiers ParisTech, I2M–UMR CNRS 5295, Esplanade des Arts et Métiers, 33405 Talence, France
c
Arts et Métiers ParisTech, PIMM–UMR CNRS 8006, 151 Bd. de l’Hôpital, 75013 Paris, France
d
Solvay Engineering Plastics, Avenue Ramboz BP 64, 69192 Saint-Fons, France *fodil.meraghni@ensam.eu
Keywords: Micro-computed tomography, damage mechanisms, fatigue, injection molding. Abstract
Damage behavior of dry as molded, 30 wt% short glass fiber reinforced polyamide-66 (PA66/GF30) under fatigue loading has been investigated by X-ray micro-computed tomography (µCT). Based on visual observation on µCT images, fiber/matrix interfacial debonding is considered as the main fatigue damage mechanism. Void features in the shell and core layer of the µCT 3D images have been identified. The trend of void volume and void aspect ratio shows marked difference on the damage kinetic between the shell and core layer. Though the damage is mainly developed along fiber interface in both shell and core layer, the interfacial debonding in the shell layer appears earlier than the one in the core layer. While the damage at fiber interface in the shell layer develops in all fatigue loaded specimens, the interfacial debonding in the core layer appears only at the very last stage of the fatigue life.
1. Introduction
Owing to its lightweight properties, short glass fiber reinforced polyamides (PA/GF) has been extensively used for automotive components. However, durability improvement, especially under fatigue loading, is still a major concern. One of issues of using PA/GF is due to the damage that progressively develops during fatigue cycles.
To investigate the damage, many researchers have employed fractography technique by electron microscopy [1,2]. Although the notion of the damage has been successfully identified, the real occurring of damage inside the material is still not fully apprehended. Currently, µCT has become a suitable tool for fatigue damage identification in composites due to reconstruct the investigated material in 3D. Cosmi and Bernasconi [3] presented the potential and critical aspects of using µCT technique for fatigue damage characterization in PA/GF. The authors’ recently published work [4] reported that fatigue damage in dry PA66/GF30 is mainly developed along fiber interface. The damage progressively increases during fatigue loading, with notable increase at the second-half of the fatigue life.
The current work is the continuation of [4] on fatigue damage characterization of dry PA66/GF30 by investigating the effect of microstructure (shell-core formation) on the damage kinetic and anisotropy.
2. Material, specimen and microstructure description
The material employed in this work is Technyl® A218V30, a commercial grade of PA66/GF30 supplied by Solvay Engineering Plastics-France. The material was prepared by compounding the polyamide-66 pellets and 30 wt% of chopped short glass fibers in a twin-screw extruder. Subsequently, PA66/GF30 compound was transferred into an injection molding machine, resulting in 360 × 100 × 3.2 mm3 of rectangular plate.
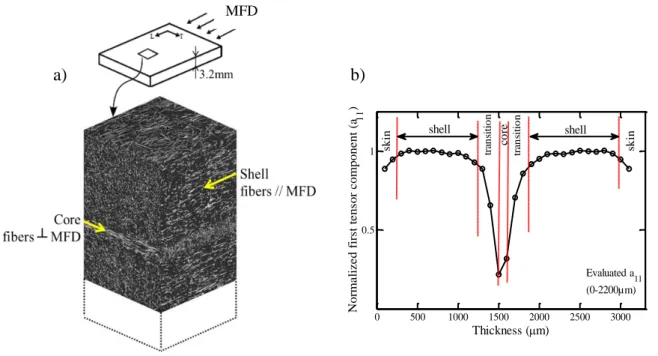
Due to the injection process, PA66/GF30 has a skin-shell-transition-core microstructure as shown in Fig. 1. It can be seen that the shell layers, with preferential fiber orientation parallel to the mold flow direction (MFD), are the most dominant ones. Thin core layer is developed and mostly fibers in this layer are oriented transversely to the MFD. Additionally, thin skin layers at the upper and lower specimen surfaces, and the shell-core transition layers are also developed. For further description of PA66/GF30 microstructure, readers can refer to [4,5]. Specimens for fatigue damage characterization were machined in longitudinal direction with respect to the MFD from the rectangular plate produced by injection molding. This extraction condition results in the average fiber orientation in the shell (and core) layer that is parallel (and perpendicular) to the applied fatigue loading direction.
Figure 1. Microstructure formation of PA66/GF30; a) fiber orientation description by µCT, and b) normalized fiber orientation tensor. (MFD = mold flow direction)
3. Experimental procedures and damage investigation techniques
Fatigue tests were performed on dry as molded PA66/GF30 specimens at room temperature by applying a sinusoidal signal under load controlled mode at constant amplitude. To prevent samples from buckling, the tests were carried out under tension-tension mode with stress ratio (σmin/σmax) of 0.1. The 3 Hz frequency was chosen in order to avoid the specimen’s global
heat reaching the glass transition of dry PA66/GF30 (≈ 65–70 oC) during fatigue loading. a) MFD b) 0 500 1000 1500 2000 2500 3000 0.5 1 Thickness (m) N or m a li z e d fi rs t te ns or c om pone nt ( a 11 ) co re tr an si ti o n tr an si ti o n sk in sk in shell shell Evaluated a 11 (0-2200µm)
The μCT was employed to investigate the damage mechanisms and evolution in dry PA66/GF30 specimens after being subjected to fatigue loading at maximum stress of 60% of the ultimate tensile stress, up to different percentages of total fatigue life. The µCT experiments were carried out at ID19 beam line of the European Synchrotron Radiation Facility (ESRF) Grenoble, France [6]. For this damage investigation, the μCT experimental setup was conditioned to reach a voxel resolution of 0.7 μm.
In this work, µCT post mortem approach was used as the μCT samples were machined from the central gauge-length zone of the fatigue loaded specimens. The dimensions of the μCT samples were 2 × 2 × 3.2 mm3, where 3.2 mm corresponds to the sample’s thickness. For the specimens fatigue loaded up to failure, the location of the μCT sample’s extraction was far from the fracture surface in order to avoid fast crack propagation effect due to the final failure. The μCT test on virgin sample was also carried out as a reference. The μCT scanning was not carried out through all the sample thickness but it always covered more than half of the thickness so that the skin-shell-transition-core microstructure can always be captured. By a strategic segmentation technique with consistent selection of threshold value, voids inside the analyzed μCT volume can be isolated; thereby the void features such as volume, Euler orientation angles and aspect ratio can be quantified. The threshold level was defined and optimized based on visual observation of voids in fatigue loaded specimens. All the specimens, including the virgin, were treated using similar and constant threshold level in order to allow a direct comparison between them.
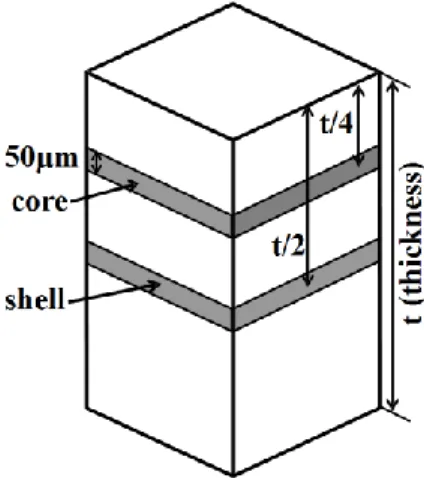
In this work, the void features; the aspect ratio, volume and Euler orientation angle are analyzed. To reduce the number of analyzed voids and to establish a consistent comparison between the void features in the shell and core layer, the evaluation of void characteristics has been performed in a 50 µm volume slice of the shell and core layer of the µCT volume, as described in Fig. 2.
Figure 2. Description of the analyzed µCT volumes in the shell and core layer of the composite.
4. Results and discussion
Based on visual observation of the µCT results in fatigue loaded specimens of PA66/GF30, voids can be detected from the appearance of zones darker than the matrix. These dark zones are notably situated along fiber interface, which correspond to the damage in the form of fiber/matrix interfacial debonding. Voids at fiber ends are also observed though it is not necessarily involved in the fiber/matrix interfacial debonding. In virgin specimen, the
presence of these dark zones is almost absence, though few regions darker than the matrix are still observed, which could be due to the real initial damage or due to the image artifact. The µCT microscopic images of these fatigue damage mechanisms can be seen in our recently published work [4].
To build a more consistent analysis on damage mechanisms of PA66/GF30, segmentation process which involves separation of the composites’ phases (fiber, matrix and damage) has been carried out. Fig. 3 shows the rendered µCT image representing the damage and fibers. One can see that the fiber/matrix interfacial debonding is frequently observed in the fatigue loaded composites. Therefore, this interfacial debonding can be considered as the main fatigue damage mechanisms in dry PA66/GF30.
Figure 3. Rendered µCT image of fatigue loaded specimen which shows damage in the form of fiber/matrix interfacial debonding. The blue (and green) color represents the fiber (and damage).
The evolution of the void volume and void aspect ratio with respect to the void orientation angle and number of cycles in the representative µCT volume of the shell and core layer, as described in Fig. 2, are then analyzed. Examining together the void volume and void aspect ratio is important to comprehend both the size and the anisotropic behavior of the voids in relation to their orientation angle and number of cycles. It should be noted that our segmentation technique may lead to a connection of adjacent voids to be detected as a single object. This could results in an improper analysis of the void orientation angle. To avoid this, a separation algorithm was implemented so that the connected voids can be separated into many individual objects. However, while this technique leads to a reliable analysis of void orientation angle, the separation algorithm also generates small voids to be detected as independent objects, notably the ones with small void volumes and void aspect ratio.
Fig. 4 illustrates the evolution of void volume and void aspect ratio with respect to the void orientation angle and number of cycles at the shell layer of specimens fatigue loaded up to different percentages of fatigue life. The figure clearly demonstrates that the void volume increases as the percentage of fatigue life increases. It is worth noticing that voids with low volumes are also observed in the virgin sample, which could be due to the real initial damage
or due to the image artifact. As the percentage of fatigue life increases, the voids with high volume are oriented mainly at around 0o, longitudinal to the fiber orientation as well as to the applied fatigue load direction. The largest void volume evolution is situated at this orientation angle. By visual verification in the rendered µCT volume, as shown in Fig. 3, it was shown that these high void volumes are all situated along the fiber matrix interface. It can be concluded that the damage is mainly in the form of fiber/matrix interfacial debonding.
Moreover, one can see that the voids with low volumes at orientation angle around ± 45o – 90o are also slightly increases as the percentage of fatigue life increases. In fact, these voids are also mainly situated along fiber matrix interface. However, these small voids do not follow the fiber orientation angle due to the separation algorithm applied during image processing, as discussed above. Many small void volumes are also situated at fiber ends and in the matrix, which could be due to the image artifacts, or due to the real damage in the form of fiber/matrix interfacial debonding at fiber ends and matrix microcracks.
The evolution of void aspect ratio at the shell layer has also been analyzed (Fig. 4). The void aspect ratio can be used to study the anisotropy degree of the voids, as well as to strengthen the analysis on void volume evolution. One can see from Fig. 4 that the void aspect ratio of voids oriented at around 0o increases as the percentage of fatigue life increases. This evolution is the same as the trend of the void volume which means that the voids enlarges and elongates mainly along fiber interface as the percentage of fatigue life increases.
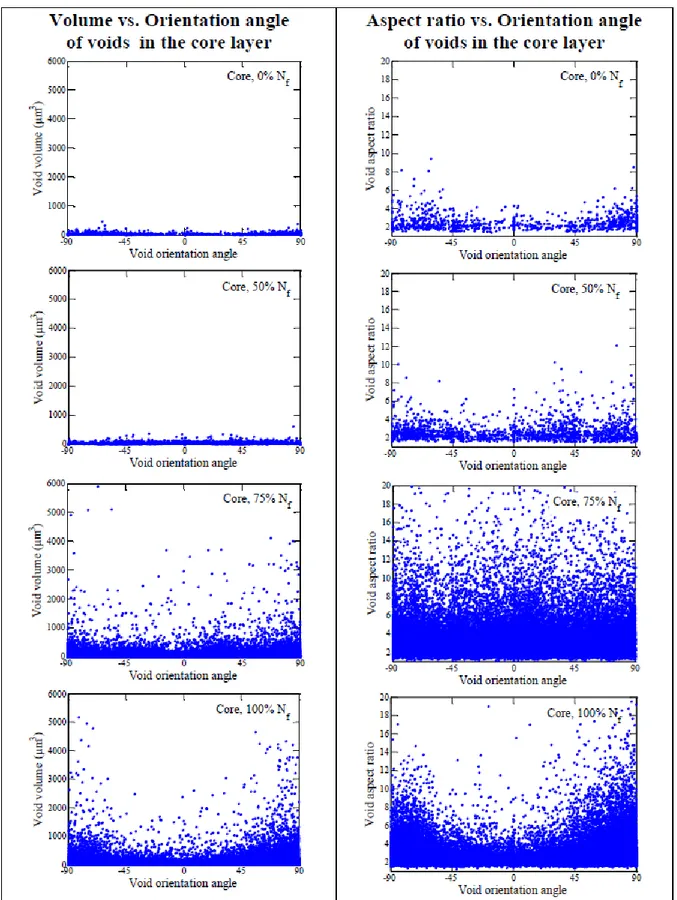
The evolution of void volume and void aspect ratio with respect to the void orientation angle and number of cycles at the core layer is then analyzed. As seen in Fig. 5, obvious increase of void volume is only remarked at 75% and 100% of fatigue life. It should be noted that the thin core layer for the specimens used in the current study doesn’t impart an active role on the load transfer due to its perpendicular configuration with respect to the applied fatigue loading direction. Due to this reason, the voids are only significant at 75% and 100% of fatigue life. At 75% of fatigue life, voids are mainly situated along the fiber interface. However, these voids have no tendency to be oriented into a certain orientation angle. This is affirmed by the trend of void aspect ratio which shows a highly varying aspect ratio without any preferential void orientation. As the number of cycles increases, the void volume increases and elongates along the fiber interface. Therefore, at 100% of fatigue life, voids with high volume and aspect ratio are oriented at around 90o, parallel to the principal fiber orientation of the core layer but perpendicular to the applied fatigue loading direction.
From the current study, it can be summarized that analyzing the trend of void volume and void aspect ratio with respect to the void orientation angle and percentage of fatigue life is important to confirm the visual observation of the damage on the rendered µCT image of PA66/GF30. The trend of void volume and void aspect ratio presented in this work exhibit strongly physical interpretation and thus the effect of image artifacts that may appear is minimized. The trend of void volume and void aspect ratio shows marked difference on the damage kinetic between the shell and core layer. Though the damage is mainly developed along the fiber interface in both shell and core layer, the fiber/matrix interfacial debonding in the shell layer appears earlier than the one in the core layer. This is due to the fiber orientation in the shell layer that actively involves in the load transfer mechanism owing to its parallel orientation to the applied loading direction. While the damage at fiber interface develops in the shell layer in all fatigue loaded specimens, the fiber/matrix interfacial debonding at the core layer only pronounces at 100% of fatigue life. This shows that fiber orientation, in relation to the applied loading, influences the damage kinetic and anisotropy.
Figure 4. Graphs of void volume vs. void orientation angle (left) and void aspect ratio vs. void orientation angle
(right) of the representative µCT volume of the shell layer of the specimens fatigue loaded up to different
percentage of fatigue life (Nf). The 0o void orientation angle represents the orientation parallel to the MFD and
Figure 5. Graphs of void volume vs. void orientation angle (left) and void aspect ratio vs. void orientation angle
(right) of the representative µCT volume of the core layer of the specimens fatigue loaded up to different
percentage of fatigue life (Nf). The 0o void orientation angle represents the orientation parallel to the MFD and
5. Concluding remarks
Damage behavior in PA66/GF30 under fatigue loading has been investigated by X-ray micro-computed tomography (µCT). Based on visual observation on the µCT images of fatigue loaded specimens of PA66/GF30, it has been indicated that the fiber/matrix interfacial debonding can be considered as the main fatigue damage mechanisms in dry PA66/GF30. To confirm the damage mechanisms in PA66/GF30, identification of the void features, i.e. volume, aspect ratio and orientation angle on the µCT reconstructed 3D volumes has been performed. To achieve this purpose, the void features in the representative µCT volume of the shell and core layer of virgin and fatigue loaded PA66/GF30 specimens has been analyzed. It was demonstrated that the trend of void volume and void aspect ratio with respect to the void orientation angle and percentage of fatigue life presented in this work exhibit strongly physical interpretation. The trend of void volume and void aspect ratio shows marked difference on the damage kinetic between the shell and core layer. Though the damage is mainly developed along the fiber interface in both shell and core layer, the fiber/matrix interfacial debonding in the shell layer appears earlier than the one in the core layer. While the damage at fiber interface develops in the shell layer in all fatigue loaded specimens, the fiber/matrix interfacial debonding at the core layer only pronounces at 100% of fatigue life. This shows that fiber orientation, in relation to the applied loading, influences the damage kinetic and anisotropy. The current results are important to build a physically based, microstructure dependent fatigue damage modeling that is currently integrated into a micromechanical model [7].
References
[1] J. J. Horst, J. L. Spoormaker. Fatigue fracture mechanisms and fractography of short-glassfibre-reinforced polyamide 6. J Mater Sci, 32:3641–51, 1997.
[2] V. Bellenger, A. Tcharkhtchi, P. Castaing. Thermal and mechanical fatigue of a PA66/glass fibers composite material. Int J Fatigue, 28:1348–52, 2006.
[3] F. Cosmi, A. Bernasconi. Micro-CT investigation on fatigue damage evolution in short fibre reinforced polymers. Compos Sci Technol, 79:70–6, 2013.
[4] M. F. Arif, N. Saintier, F. Meraghni, J. Fitoussi, Y. Chemisky, G. Robert. Multiscale fatigue damage characterization in short glass fiber reinforced polyamide-66. Compos
Part B: Eng, 61:55–65, 2014.
[5] M. F. Arif, F. Meraghni, Y. Chemisky, N. Despringre, G. Robert. In situ damage mechanisms investigation of PA66/GF30 composite: Effect of relative humidity. Compos
Part B: Eng, 58:487–95, 2014.
[6] ID19 ESRF. www.esrf.eu/UsersAndScience/Experiments/Imaging/ID19.
[7] N. Despringre, Y. Chemisky, M. F. Arif, G. Robert, F. Meraghni. Multi-scale viscoelastic damage model of short glass fiber reinforced polyamide-66 under highcycle fatigue.