4th IAHR International Symposium on Hydraulic Structures, 9-11 February 2012, Porto, Portugal, ISBN: 978-989-8509-01-7
THE TAOUSSA PROJECT (MALI): AN EXAMPLE OF EFFECTIVE
COMPOSITE MODELING
S. Erpicum1, B. J. Dewals1, J.-M. Vuillot2, P. Archambeau1, M. Pirotton1
1
HECE, ArGEnCo Department, University of Liege, Belgium, [email protected] 2
Coyne et Bellier, Tractebel Engineering, France
Abstract: Physical modeling and numerical modeling are two efficient analysis approaches in
hydraulic engineering. The interactive application of both methods is obviously the more effective response to most flow problems analyses. This paper presents the results of a successful application of such a composite numerical – physical study carried out by the Research Group Hydraulics in Environmental and Civil Engineering (former HACH) of the University of Liège on behalf of Coyne et Bellier (Tractebel Engineering). It concerned, at the stage of detailed draft, the hydraulic study of the Taoussa Project on the Niger River in Mali. The studies, performed in less than 6 months, focused on the flow characteristics at the scale of the reservoir and the river, using the numerical approach, as well as on hydrodynamic details in the spillway using a large scale factor physical model with boundary conditions defined on the basis of numerical modeling.
Keywords: hydraulics, composite modeling, gated spillway, large reservoir
INTRODUCTION
Physical modeling has always been widely used in hydraulic engineering for research as well as project design. It consists in building, with a degree of complexity dependent on the goals of the application, a model of the hydraulic systems to be studied (ASCE, 2000). This type of model enables to reproduce, in a controlled environment making a qualitative as well as quantitative analysis possible, the whole complexity of the flows occurring in the studied systems.
The main advantage of the physical models lies in their intrinsic capacity to reproduce, provided that adapted scale factor and similarity laws are applied, the complete flow features, even very complex. Moreover, they easily enable physical interactions with these flows and are useful for promoting and communicating on a project. Indeed, they irrefutably demonstrate to the specialist engineer but also to each individual how a structure or a procedure will work (ASCE, 2000).
The general use of numerical modeling in hydraulic engineering dates from about twenty five years. It has developed following the setup of increasingly representative mathematical models as well as more and more robust and accurate resolution schemes, coupled to a tremendous increase and popularization of the numerical computing potentialities.
Just like the efficiency and the pertinence of a physical model depend on a judicious choice of the scale factor and the similarity laws, carrying out representative and reliable flow numerical
modeling depends on a number of parameters, sometimes still little recognized such as the choice of the mathematical model, of the resolution scheme, of their parameters, the quality and the adequacy of the input data, and in particular the boundary conditions, or the modeler experience.
The main advantages of the numerical models are their low application costs compared to the costs of a scale model building, especially for large study areas, their flexibility, in terms of geometry for example, or also the ease with which the evolution of the unknowns can be followed everywhere in the studied system.
Today, the combined application of physical and numerical modeling, called composite modeling, is obviously the more effective response to most flow problems analyses. Indeed, it enables combining the inherent advantages of both approaches, which are complementary, while being beneficial to the delays as well as the quality of the analysis.
This paper presents the results of a successful application of such a combined numerical – physical study carried out by the research group Hydraulics in Environmental and Civil Engineering (former HACH) of the University of Liège on behalf of Coyne et Bellier (Tractebel Engineering). It concerned, at the stage of detailed draft, the hydraulic study of the Taoussa Project on the Niger River in Mali.
The ability of the numerical models to consider large areas has been used to perform the project general hydraulic analysis and to precisely define the flow conditions near the spillway. This last one, which is a structure with complex hydrodynamics, has then been studied in details using a physical model with a large scale factor as the area to model has been drastically limited thanks to considering the numerical results.
PROJECT FEATURES AND GOALS OF THE STUDY
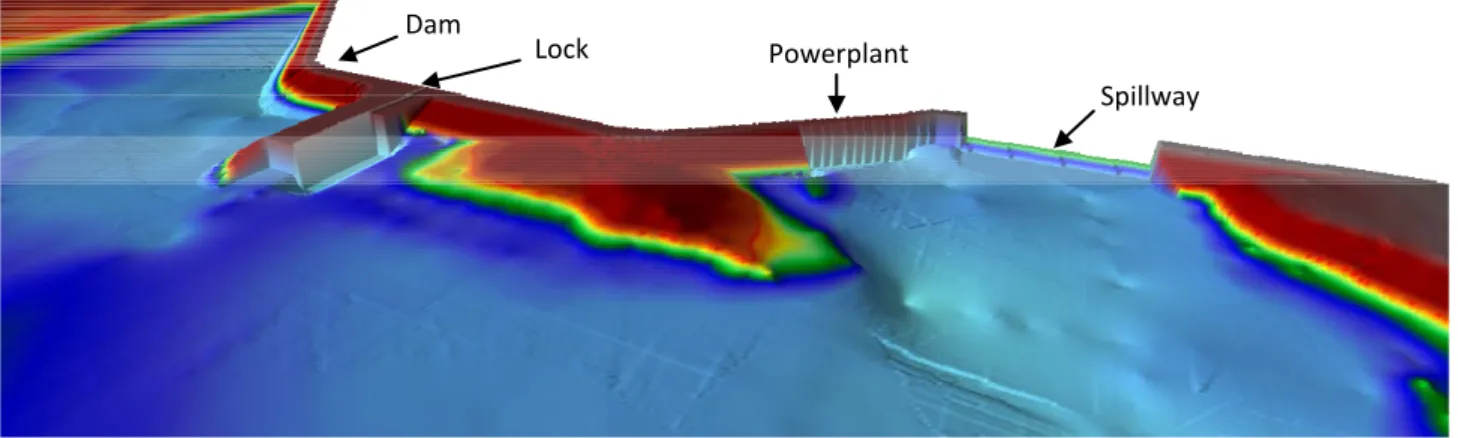
The Taoussa hydraulic project (Fig. 1) is mainly made of an embankment dam around 15 m high and 1,300 m long across the valley of the Niger River, 130 km upstream of the town of Gao in the eastern part of Mali. The dam is equipped with a hydroelectric power plant counting for 5 groups with an equipment discharge of 75 m³/s each, a 12 m wide lock and a spillway with a release capacity of 3,100 m³/s. The spillway is made of a Creager weir at level 252.75 m and divided in 10 gated notches 8.5 m wide, separated by 3.3 m wide piers. A stilling basin 55 m long is located downstream of the weir. Its bottom elevation is at level 244 m and there is a downstream extremity step 2 m high. The stilling basin is divided longitudinally in 5 identical parts by in between walls at level 255 m, extending the weir piers.
The spillway has to control the reservoir level in between levels 254.50 and 258.75 m in annual usual operation and normal conditions. During high flood events, (i.e. discharge higher than 2,500 m³/s / 100-year flood), the reservoir level could rise to a higher level, in particular up to level 260.80 m for the 1000-year flood of 3,100 m³/s with 8 gates opened.
The hydraulic studies of the project have been carried out successively by two complementary approaches: a first step realized on the basis of numerical modeling to study the flows at the scale of the reservoir and the river, and a second experimental investigation, using a physical scale model, to analyze in details the spillway operation conditions.
The numerical study aims at analyzing the large scale flow conditions in the reservoir during the spillway operation and at looking to the hydrodynamic interactions between the dam, the lock and the hydroelectric power plant. It also has to help in defining the limited extension of the physical model of the spillway and, if necessary, in determining the water supply conditions to be reproduced in order to make the model representative of the real flow conditions. In the same framework, it has been used to compute the value of the water depth downstream boundary conditions to be prescribed in the physical model.
On another side, the goal of the experimental investigations was to validate and optimize the hydraulic design and the dimensions of the gated spillway and the stilling basin, to verify the flow and release conditions downstream of the project structures, including the temporary derivation stage, and to analyze the operating scheme of the spillway gates to optimize the river discharges release under varied reservoir levels and for normal operation conditions.
Fig. 1 – 3D numerical view of the Taoussa Project
LARGE SCALE NUMERICAL MODEL
Flow solver
The numerical study has to consider the flow conditions at large scale in the river and the reservoir as well as hydrodynamic details near the dam and the associated structures. The discretization of the numerical model has thus to cover a large area with a locally high accuracy. On another side, the limited water depths in the river reach and the reservoir (in the order of 10 m) in comparison with the surface extension of the flow, coupled to flow velocities essentially horizontal because of the geometry of the projected structures, do not require the use of a full 3D modeling approach.
On the basis of these considerations, the numerical studies have been carried out with the depth averaged flow solver WOLF2D, using a square mesh grid with a cell size varying by blocks. This software, part of the WOLF modeling system, solve by a finite volume method the depth-integrated Navier-Stokes equations, capable in mean values to reliably represent all flow specificities and taking explicitly into account turbulence effects with suited mathematical models (Dewals et al., 2006; Erpicum et al. 2009a, 2009b, 2010).
Data, layout and validation
Two limnimetric stations are located on the river, upstream and downstream of the dam location,
Dam
Lock Powerplant
Spillway
providing water level and discharge data.
On the basis of the topographic data provided by Coyne & Bellier, three digital elevation models (DEM) of the study area have been built. A DEM is indeed the basic data to perform flow numerical modeling. The first DEM was representative of the whole of the actual Niger River bed between the two limnimetric stations. The second one was limited to the future reservoir and the third one to the area downstream of the future structures down to the downstream limnimetric station. In order to build these DEMs, the topography and bathymetry data available have been grouped together in a single file as points defined by x,y and z coordinates. Interpolation using the adequate tool in WOLF2D allows generating a regularly distributed DEM on the whole area of interest. Superimposing the DEM and the digital drawings of the Taoussa project, the geometry of the structures has been accurately added to the topography.
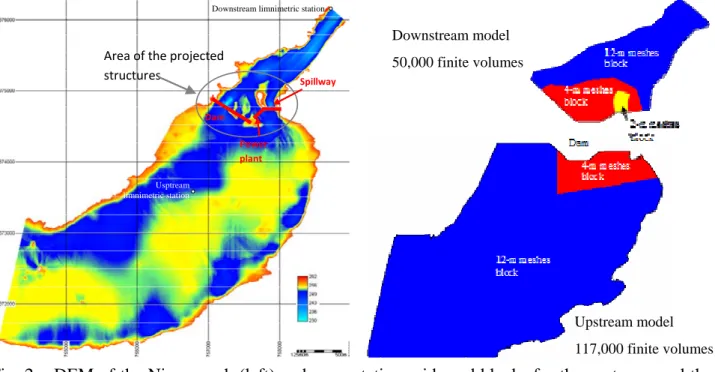
The DEM of the Niger River in its present state covered an almost 7-km long reach upstream of the downstream limnimetric station with more than 2,550,000 meshes (Fig. 2 - left).
In order to model the flow on the different DEMs, a computation grid has been defined in each case with a regular square meshes size varying by blocks depending on the hydrodynamics features to model and of the modeling objective. For example, in the upstream and the downstream models (Fig. 2 - right), meshes sizes of 12, 4 and 2 m have been used with a progressive refinement of the grid close to the spillway, where the flow velocities are the most important.
Fig. 2 – DEM of the Niger reach (left) and computation grids and blocks for the upstream and the downstream models (right)
The discharge is the upstream boundary condition of the numerical models. It is injected in the computation domain directly as a specific discharge at the downstream extremity of the stilling basin (downstream model) or on the whole of the river width using a numerical infiltration area (present river and reservoir models), i.e. without choosing a preferential flow direction. The turbines discharge is removed from or injected in the computation domain using the same numerical infiltration artifice upstream and downstream of the hydroelectric power plant.
Downstream limnimetric station
Usptream limnimetric station Area of the projected structures Dam Power plant Spillway Downstream model 50,000 finite volumes Upstream model 117,000 finite volumes
For each simulation, the free surface level is imposed as a downstream boundary condition, on the spillway crest or in the river cross section close to the downstream limnimetric station. For the reservoir simulations, the free surface level imposed on the spillway crest has been defined in order to reach in the reservoir the theoretical head corresponding to the injected discharge, depending on the predicted head/discharge curve of the weir. This enables to reach water depths and thus flow velocities in the computation domain representative of those which will be created in reality by the spillway. In all other cases, the free surface level imposed as the downstream boundary condition directly comes from the water rating curve of the downstream limnimetric station, provided by Coyne & Bellier.
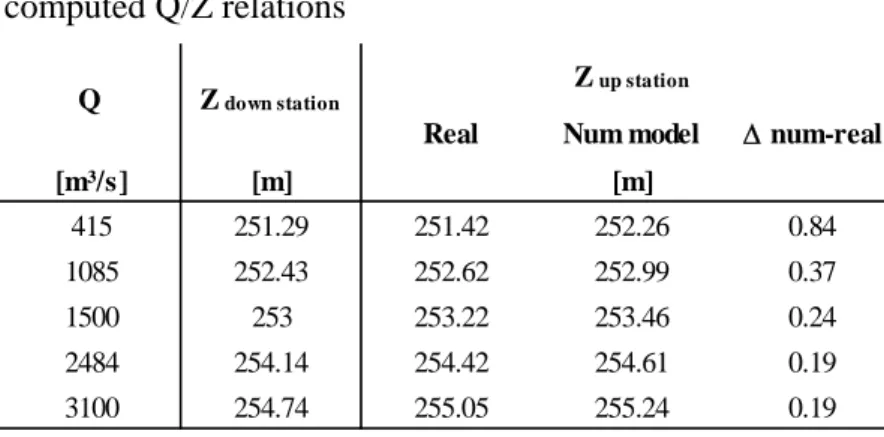
Before the application of the numerical model for the large scale hydraulic study of the Taoussa Project, modeling of the flow in the present river state between the two existing limnimetric stations has been carried out for several discharges. These computations enable to assess the DEM accuracy without considering the project structures and to fit the roughness coefficient value in the river bed. The computed surface elevation Z / discharge Q curve for the upstream limnimetric station is finally the same as the real measured one with an accuracy in the order of 50 cm in the discharge variation range of the river, although the accuracy on the bathymetry can be locally only several meters (Table 1).
Table 1 - Real and computed Q/Z relations
Numerical results
The upstream numerical simulations enable to characterize the flow in the reservoir for various operation conditions of the project structures. They are also at the basis of propositions to modify locally the bathymetry in order to improve the alimentation conditions of the power plant and the spillway and they allow quantifying the amplitude of the water level variations along the dam upstream face, because of head losses and velocity changes.
The downstream numerical simulations enable to determine the water depth / discharge relation at the downstream limit of the physical model (boundary condition). In particular, they showed that the water depth at this specific place cannot be directly interpolated from the data of the two limnimetric stations surrounding the project area for the same discharge. Indeed, at this specific location, clearly identified hydrodynamic situations lead to free surface levels lower than those of both limnimetric stations when the power plant is not in use. Similarly, the water levels at the lock
Real Num model Δ num-real
[m³/s] [m] 415 251.29 251.42 252.26 0.84 1085 252.43 252.62 252.99 0.37 1500 253 253.22 253.46 0.24 2484 254.14 254.42 254.61 0.19 3100 254.74 255.05 255.24 0.19 Q Z down station Z up station [m]
and the power plant toe have been quantified for varied operation conditions of the spillway.
The water levels along the right bank cofferdam during the temporary derivation stage have been computed. They are significantly higher than those observed in the current situation, because of the river cross section reduction as a result of the temporary cofferdam.
Finally, the layout of the physical scale model and the location of the water alimentation wall in the model upstream basin have been defined on the basis of an analysis of the numerical results of the reservoir flow modeling. The flow fields in the reduced surface of the physical model and in the whole of the reservoir have been compared in order to validate the representativeness of the scale model regarding the spillway alimentation conditions.
RESTRICTED PHYSICAL MODEL
Features
A scale model representing the whole spillway and the power plant water intakes, a part of the reservoir (105 m long and 300 m wide) upstream of the gated weir crest and a 160-m long reach of the natural river downstream of the stilling basin has been built with a scale factor of 1/40 considering a Froude similarity (Fig. 3). It has been possible to consider this large scale factor thanks to the considerable restriction of the model area in the reservoir as well as downstream of the stilling basin, using the preliminary numerical modeling results.
The water system is a closed circuit with two regulated pumps, a buried 400 m³ storage tank and pressurized pipes. In order to gain a discharge and velocities repartition at the model entrance complying with the numerical results, the water is discharged in an upstream specific tank and is injected in the physical model through a permeable screen made of perforated bricks and a synthetic fibre screen. Downstream, the water is collected in a specific channel bringing it back to the storage tank. The maximum discharge through the scale model is 350 l/s.
The fixed bathymetry in the reservoir and the river downstream of the stilling basin has been materialized inside a waterproof tank with a 5-cm thick mortar layer on a base of concrete bricks. It has then been painted with latex. It has been reproduced from a series of cross section profiles regularly spaced of 20 cm on the scale model, drawn from the topography files. The spillway and the stilling basin have been built in several parts using PVC and aluminum. The different weirs have been profiled using synthetic resin. All these elements have been assembled on the floor of the waterproof tank delimiting the physical model, prior to the bathymetry realization. Each notch of the spillway is equipped with a mobile gate and can be blocked by a cofferdam. The five pipes of the hydroelectric power plant have been equipped with a valve in order to be able to represent varied operating configurations. All these valves discharge in a downstream concentration tank which is linked to a pipe with a discharge meter and a regulating valve. This enables to accurately regulate the head losses in the system and thus the amplitude of the discharge in the turbines.
The upstream boundary condition is the discharge injected in the scale model. The water level in the reservoir regulates automatically depending on the release capacity of the spillway and the hydro power plant operation conditions. The water level / discharge relation at the downstream
extremity of the model is regulated by a specific weir. This water level is controlled at the river cross section where it has been computed using the numerical model.
Fig. 4 - General view of the scale model (left) and details of the gated weir and stilling basin (right)
Experimental results
The scale model has been tested with discharges ranging from 75 to 3100 m³/s. Except few minor modifications, these tests enable to validate the design of the structures, and in particular the dimensions of the stilling basin.
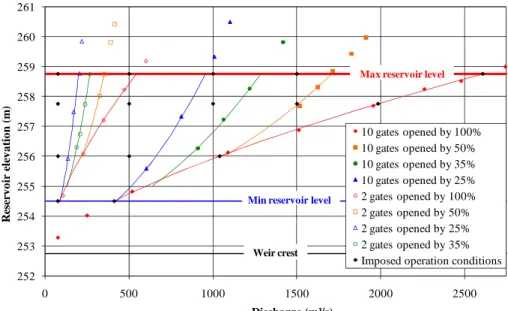
The head H / discharge Q relations of the weir have been measured on the scale model for varied opening configurations of the gates (10 and 2 gates opened, full or partial opening) for gated and free surface operating conditions (Fig. 4). Operation conditions have also been verified for damaged or maintenance configurations (2 gates not available). Using the experimental data, a generic analytical H-Q relation has been defined for each of the 2 operating configurations (free or gated weir) with parameters depending only of the number and opening degree of the gates.
The water levels and the flow velocities have been measured in the stilling basin, on the weir, the piles and along the guiding wall on the left bank, for varied gates opening configurations and reservoir levels.
The power plant influence on the spillway operation has been analyzed through specific tests for varied discharges and opening configurations of the gates. In particular, the study of the downstream water levels variation when the turbines are in use showed no significant change in the flow characteristics in the stilling basin and the spillway. Identically, H-Q relation of the weir is not affected for discharges in the reservoir up to 2500 m³/s. It has been proved from these tests that, except a modification of the water levels in the stilling basin and the downstream river reach, the hydropower plant has no significant influence on the spillway operation.
Using the H-Q analytical relations of the weir and following the observation on the scale model of the best sequence to open the gates, spillway management rules have been set up and secondly validated by specific tests on the scale model. They define the sequence and the opening rate of the gates to enable a safe control of the reservoir elevation.
Finally, the flows during temporary diversion stage have been analyzed in order to characterize the hydraulic efficiency of the spillway with an intermediate crest level.
Fig. 4 - Analytical H-Q relations and measurements
CONCLUSIONS
In hydraulics engineering, physical modeling and numerical modeling are two efficient analysis approaches. Their interactive application is obviously the more effective response to most flow problem analyses. Carried out carefully, this combination enables a global improvement of the quality of the studies thanks to an increase in the considered areas, the objective determination of the critical part of the project and their detailed analysis. These advantages can be accompanied by a decrease in the costs and the delay of scale models building thanks to a preliminary study of variants with numerical modeling.
This paper presents the results of a successful application of such a combined numerical – experimental approach where the whole studies of the hydraulic features of a large project on the Niger River have been carried out in less than 6 months. The studies focused on the flow characteristics at the scale of the reservoir and the river, using the numerical approach, as well as on hydrodynamic details in the spillway using a large scale factor physical model, with boundary conditions defined on the basis of numerical modeling.
REFERENCES
ASCE (2000). – Hydraulic modeling – Concepts and practice. ASCE Manuals and reports on engineering practice No. 97. Reston, Virginia: ASCE.
Dewals B.J., Erpicum S., Archambeau P., Detrembleur S., & Pirotton M. (2006). – Depth-integrated flow modeling taking into account bottom curvature. J. Hydraul. Res. Vol. 44, No. 6, pp. 787-795.
Erpicum S., Meile T., Dewals B.J., Pirotton M., & Schleiss A. (2009a). – 2D numerical flow modeling in a macro-rough channel. Int. J. Numer. Methods Fluids, Vol. 61, No. 11, pp. 1227-1246
Erpicum S., Dewals B.J., Archambeau P., & Pirotton M. (2009b). – Dam-break flow computation based on an efficient flux-vector splitting. J. Comput. Appl. Math., Vol. 234, No. 7, pp. 2143-2151
Erpicum S., Dewals B.J., Archambeau P., Detrembleur S., & Pirotton M. (2010). – Detailed inundation modeling using high resolution DEMs. Engineering Applications of Computational Fluids Mechanics Vol. 4, No. 2, pp. 196-208 252 253 254 255 256 257 258 259 260 261 0 500 1000 1500 2000 2500 R es erv o ir el ev a ti o n ( m ) Discharge (m³/s) 10 gates opened by 100% 10 gates opened by 50% 10 gates opened by 35% 10 gates opened by 25% 2 gates opened by 100% 2 gates opened by 50% 2 gates opened by 25% 2 gates opened by 35% Imposed operation conditions
Weir crest
Min reservoir level