Tree light capture and spatial variability of
understory light increase with species mixing and
tree size heterogeneity
Gauthier Ligot
1*, Aitor Ameztegui
2,4,5, Benoˆıt Courbaud
3, Llu`ıs Coll
2,5,6, Daniel Kneeshaw
4 AbstractMixed and multi-layered forest ecosystems are sometimes more productive than monospecific and single-layered ones. It has been suggested that trees of different species and sizes occupy complementary positions in space which would act as a mechanism to increase canopy light interception and wood production. However, greater canopy light interception reduces the average amount and variability of transmitted radiation offering fewer opportunities for all species to regenerate and to maintain forest heterogeneity in the long run. We investigated whether increasing overstory heterogeneity indeed results in greater canopy light interception and lower variability in transmittance. We modeled the three-dimensional structure of forest stands with three typical forest structures, 10 mixtures of four tree species, and three different basal areas. We used the forest light interception model SAMSARALIGHT and performed three-way analyses of covariance to analyze the effects of the three varied components of forest heterogeneity. We found no evidence that increasing structural heterogeneity increases canopy light interception. However, the light interception by mixed canopies was greater than the weighted average of light interception by the corresponding pure canopies. Variability in transmittance increased in some cases with compositional heterogeneity and, to a lesser extent, with tree size inequalities. The advantage of heterogeneous forests is in opportunities for natural regeneration as well as in opportunities to enhance canopy light interception.
1Univ. de Li `ege, Gembloux Agro-Bio Tech, Unit ´e de Gestion des Ressources foresti `eres, 2, Passage des D ´eport ´es, B-5030 Gembloux,
Belgique
2Forest Sciences Centre of Catalonia (CTFC-CEMFOR), Ctra. Sant Llorenc¸ de Morunys km.2, E-25280 Solsona, Spain
3Universit ´e de Grenoble Alpes, Irstea, Mountain Ecosystems Research Unit, 2 rue de la Papeterie, 38402 Saint Martin d’H `eres, France 4Centre d’ ´etude de la For ˆet, Universit ´e du Qu ´ebec `a Montr ´eal, C.P. 8888, Succ. Centre-Ville, Montr ´eal (Qu ´ebec), Canada H3C 3P8 5CREAF, Cerdanyola del Vall `es, 08193, Spain
5Department of Agriculture and Forest Engineering (EAGROF), University of Lleida, Lleida, 25198, Spain
*Corresponding author: [email protected]
Contents
1 Introduction 1
2 Methods 2
2.1 Study species . . . 2
2.2 Creating virtual stands . . . 2
2.3 Modeling understory light . . . 3
2.4 Statistical analyses . . . 5
3 Results 5 3.1 Mean transmittance. . . 5
3.2 Transmittance variability . . . 5
4 Discussion 7 4.1 Tree light capture . . . 7
4.2 Variability of understory light . . . 9
5 Research perspectives 9
6 Conclusion 10
Appendices 13
1. Introduction
It has been advocated that forests with many tree species and a great heterogeneity in tree sizes are more productive ( Pret-zsch and Sch¨utze,2009;Vallet and P´erot,2011;To¨ıgo et al.,
2015), resistant and resilient (Jactel et al.,2005) to future changes and harbor a greater biodiversity (Huston,1979) than monospecific forests in which all trees have a similar size. Over the last 50 to 100 years, humans have applied forest management systems over much of the northern hemisphere that tended to simplify both the structure and composition of many forests (Bengtsson et al.,2000). This simplification re-sulted in increased production of the targeted product, usually timber of a few species highly valued by the market at the time. However, the advantages of these management systems may have obscured long term negative impacts such as reductions of genetic and species diversity (Ledig,1992;Noss,1999), rigidity in the face of market and climate variations (Pretzsch et al.,2013), a decrease in forest habitat quality (Franklin et al.,2000) and soil fertility (Reich et al.,2012), and a loss in overall productivity. Many researchers and forest managers now promote the development of more heterogeneous forests
(McElhinny et al.,2005;Puettmann et al.,2009), but our un-derstanding of the sharing and use of resources among species and vegetation strata in heterogeneous forests is limited and impedes our ability to predict the long-term dynamics of such forests. Researchers have usually hypothesized that forest pro-ductivity is greater in mixed forests than in the corresponding pure forests, because species mixtures should capture more resources and, in particular, more solar radiation due to the layering of the forest canopy and the complementarity and overlapping of tree crowns (Forrester et al.,2006;Kelty,2006;
Yachi and Loreau,2007;Pretzsch and Sch¨utze,2009;Bauhus and Schmerbeck,2010;Vallet and P´erot,2011). It is also generally assumed that the structural and compositional het-erogeneity of the forest overstory directly affects the amount and variability of light available in the understory for tree regeneration (Kelty,2006). A number of studies have found close relationships between the amount of light transmitted to the understory and canopy density (Vales and Bunnell,1988;
Comeau and Heineman,2003;Sonohat et al.,2004;Lochhead and Comeau,2012), stem spatial distribution (i.e. clumped, random, or dispersed) (Coates et al.,2003;Drever and Lertz-man,2003;Beaudet et al.,2011;Lochhead and Comeau,2012;
Ligot et al.,2014a), vertical canopy structure or distribution of tree sizes (Drever and Lertzman,2003;Lochhead and Comeau,
2012;Ligot et al.,2014a), and species composition (Messier et al.,1998;Lochhead and Comeau,2012). The effects of these factors on understory light have been tested individually and sometimes in pairs, but their combined effects have been particularly difficult to assess.
Moreover, most studies have focused on the average quan-tity of light that reaches the forest floor but few have consid-ered spatial variability in light conditions (Puerta-Pi˜nero et al.,
2007) even though it is also essential for the sustainability of structurally complex forests. Uneven-aged stands harboring trees of different sizes and ages can only persist if sufficient light reaches seedlings at least in scattered patches in the for-est understory. Furthermore, the coexistence of different tree species can only be ensured if the variability in understory light is sufficient for all species to be able to survive, grow and reproduce (Ameztegui and Coll,2011;Ligot et al.,2013). The exact needs in terms of variablity in light availability ultimately depend on the interspecific range of shade toler-ances (Kobe et al.,1995), but the greater the variability in understory light conditions, the greater the opportunities for multiple species to regenerate. However, the variability in un-derstory light is likely positively correlated with the average quantity of light transmitted through the canopy. As canopy openness increases, both the mean and the range of under-story light conditions increase (Canham et al.,1990). Because canopy transmittance is hypothesized to decrease with forest heterogeneity, variability in understory light should also de-crease with forest heterogeneity. Sustainable management of heterogeneous forests should therefore optimize the capture of solar radiation both by overstory trees and by understory seedlings, i.e. it should both minimize mean light
transmit-tance and maximize the variability of light transmittransmit-tance. The main question we address in this paper is how does the structural and compositional heterogeneity of the forest overstory affect light interception and the amount and variabil-ity of understory light. In particular, our specific questions are. (i) How does overstory structural and compositional hetero-geneity affect the total interception of light? and (ii) How does structural and compositional heterogeneity of the overstory affect spatial variability of understory light? We hypothesize that stands composed of trees of multiple species and multiple sizes will intercept more light than uniform stands because canopies would be denser with reduced gap area between crowns. As we expect the variability of light transmittance to be positively correlated with mean light transmittance, we additionally hypothesize that variability in understory light will be reduced with forest heterogeneity.
2. Methods
2.1 Study species
We selected four species for which allometric relationships required to compute canopy light transmittance with three-dimensional radiative transfer models (Ligot et al.,2014b) have been previously calibrated : sessile oak (Quercus pe-traea(Matt.) Liebl.), European beech (Fagus sylvatica L.), mountain pine (Pinus uncinata Ram ex. DC) and silver fir (Abies alba Mill.). In the first study from which species cali-brations were determined,Ligot et al.(2014a) monitored 27 mixed stands of sessile oak and European beech in the Belgian Ardennes (50◦150N, 5◦400E). In a second study,Ameztegui and Coll(2011) monitored 24 mixtures of mountain pine and silver fir in the Spanish Pyrenees (42◦200N, 1◦400E). These study species provided us with a large gradient of species shade tolerance and adult tree crown properties. In particular, the four study species spanned a gradient from shade tolerant species with very dense and deep ellipsoidal crowns (Euro-pean beech) to shade intolerant species with sparse and small parabolic crowns (mountain pine). By increasing order of shade tolerance, the list of the study species is pine, oak, fir and beech (Niinemets,2006).
2.2 Creating virtual stands
To examine how overstory heterogeneity influences the mean and the variability in understory light conditions, we simulated 90 contrasted forest stands including 3 typical forest structures (single layered, multi-layered with two or three vegetation layers and reverse J-shaped distribution), 10 mixtures of forest composition based on combinations of the four species (beech, oak, beech–oak, pine, fir, fir–pine, oak/pine, beech–fir, beech– oak–pine, beech–fir–pine), and 3 levels of basal area (15, 25 and 35 m2ha−1) (Figure1). Each virtual stand was 50 × 50 m, and since the position of the trees was randomly drawn from a uniform distribution, each combination was simulated 100 times. We chose a uniform distribution because we found no general evidence of aggregated or regular distributions of trees in stands of the studied species (the values of the aggregation
index Clark-Evans were generally close to 1, see Table1). The resulting tree spatial distribution of most simulated plots was random (Clark-Evans’ index close to 1; range 0.74–1.41). Tree diameters at breast height (DBHs, 1.3 m) in the virtual stands were drawn from statistical distributions, de-pending on the stand structure. To create single-layered stands, tree DBHs were drawn from a truncated normal dis-tribution with two parameters, N(µ1= 30 cm, σ1= 4.5 cm, min= 6 cm, max = 70 cm), and with all species occupying the same canopy layer. In multi-layered stands composed of two species, tree DBHs were drawn from two truncated normal distributions: N(µ1= 40 cm, σ1= 6 cm, min = 6 cm, max= 70 cm), and N(µ2= 25 cm , σ2= 3.75 cm, min = 6 cm, max = 70 cm). In multi-layered stands composed of three species, tree DBHs were drawn from the two previous dis-tributions and from a third one: N(µ1= 35 cm, σ1= 3.75 cm, min = 6 cm, max = 70 cm). The standard deviation of DBHs was set to correspond to a coefficient of variation of 15%. In mixed multi-layered stands, the less shade-tolerant species occupied the upper vegetation strata. To create a re-verse J-shape structure, tree DBHs of all species were sampled from a single truncated exponential distribution: exp(k) with E(DBH) = 1/k = 25 cm, min = 6 cm, max = 70 cm. Alto-gether these distribution parameters ensured that the quadratic mean diameter of all simulated stands was relatively similar (about 30 cm). In mixed stands composed of two or three species, each species was assigned 50% or 33% of the total basal area, respectively.
This experimental design crossing levels of canopy den-sity, composition, and structure would not have been possible with field experiments. It would be illusory to search for rep-resentative stands of every combination of these three factors without interference with other factors (e.g. canopy gaps, stand edges, site conditions).
The choice of the simulated levels of basal area, shapes and parameters of DBH distributions and species mixtures was critical as a different choice would have led to different results. Even though most of the simulated stands spanned a realistic range of conditions (Table1), some of them are rather theoretical (e.g. mixtures of 3 species). However, the light model we used (see next section) is assumed to synthesize our knowledge of radiative transfer through forest canopies and to be valid for different forest structures and compositions.
Tree height and crown radius were computed using species-specific allometric relationships determined byAmeztegui and Coll(2011) andLigot et al.(2014a) (Fig.2). Leaf area density (LAD) was set according to previous measurements (Ligot et al.,2014a) to 0.71 m2m−3for beech and 0.52 m2m−3for oak. For both pine and fir, LAD was set to 0.6 m2m−3based on the literature (Ligot et al.,2014b). Moreover, small varia-tions in LAD around 0.6 have been shown to have little effect on light interception simulations (Courbaud et al.,2003;Ligot et al.,2014a).
2.3 Modeling understory light
The amount of light available in the forest understory of each simulated stand was computed with SAMSARALIGHT (Courbaud et al.,2003;Ligot et al.,2014a), a three-dimensional radiative transfer model implemented in a library of the CAP-SIS platform (Dufour-Kowalski et al.,2012)1. This model has proven to satisfactorily predict understory light in uneven-aged forests of Norway spruce (Picea abies (L.) Karst) in the Alps (Courbaud et al.,2003), in Belgian mixtures of oak and beech forests (Ligot et al.,2014a) and in Spanish mixtures of fir and pine in the Pyrenees (AppendixA1).
For this experiment, SAMSARALIGHT was set to com-pute light interception using Beer’s law (Eq.1). Beer’s law describes the attenuation of a monochromatic ray within a turbid medium, i.e. a medium made up of small elements ran-domly scattered and presenting a homogeneous transparency (Brunner,1998). Briefly, the probability of beam intercep-tion (1 − τ) by canopy elements is a funcintercep-tion of the canopy element density (leaf area density, LAD, in m2m−3), the path length of a ray through the canopy (l, in m), the extinction coefficient (k) and the clumping factor (Ω). K and Ω depend on canopy element inclination and spatial distribution:
τ (η , γ ) = ex p(−k · Ω · LAD · l(η , γ )) (1) Tree crowns of hardwood and softwood species were mod-eled with three-dimensional ellipsoidal and parabolic shapes, respectively, using the allometric relationships fromLigot et al.(2014a) andAmeztegui and Coll(2011). In SAMSAR-ALIGHT, individual tree crowns were considered as homoge-neous turbid media. For each month of the growing season (from April to October), 130 diffuse and 81 direct light ray directions were sampled. Diffuse ray directions were sam-pled over the sky hemisphere at regular zenith angles above a starting value of 10◦. Similarly, direct ray directions were sampled every hour over the average monthly solar trajec-tory. For every direction, parallel rays were cast at the centers of each 25 m2ground cell. To remove edge effects, SAM-SARALIGHT uses an algorithm that considers plots as being wrapped around a torus (Courbaud et al.,2003). The radiation transmitted to a cell by a light beam depended on the radiation absorption of the succession of crowns that are crossed. The amount of radiation available over a vegetation season for each cell was obtained by cumulating the radiation from light coming from every direction. The amount and angular dis-tribution of incident diffuse and direct lights were computed assuming all sites had latitude of 50◦N (i.e. the latitude of the Belgian sites). Simulating light interception at the lower latitude of the Spanish sites (42◦N) did not alter our conclu-sions (results not shown). Although latitude affects absolute values of irradiance, the transmittance (i.e. the ratio between the irradiances available above and below forest canopy) is not much affected by latitude.
1A version of this software can freely be downloaded athttp://orbi. ulg.ac.be/handle/2268/187361(accessed on the 15th April 2016).
a. Single-layered beech stand b. Multi-layered oak-beech stand c. Reverse j-shaped fir-pine stand
fir
pine
oak
beech
Figure 1. Examples of three virtual stands with basal area of 25 m2ha−1: a single-layered stand of European beech with a mean DBH of 35 cm (a); a multi-layered stand of sessile oak and beech with mean DBHs of 15 cm for beech (green) and 35 cm for oak (purple) (b); and a reverse J-shaped stand of mountain pine (blue) and silver fir (gray) with mean DBHs of 25 cm (c). Understory light was assessed for each cell. Levels of transmittance under the trees are represented by a gradient of color from black (transmittance of 0-10%) to yellow (90-100%).
10 20 30 20 40 60 dbh (cm) height (m) beech oak fir pine 2 4 6 20 40 60 dbh (cm) cro wn r adius (m) beech oak fir pine
2.4 Statistical analyses
In order to determine the relative importance of the three studied factors (stand composition, structure and basal area), two three-way ANCOVAs were carried out. The response variables were the mean and the standard deviation of light transmittance, i.e. the proportion of incident light transmitted to the understory, computed for each simulation run and each cell. The standard deviation of light transmittance was used as an indicator of the variability of light conditions in the understory. Stand composition, structure and basal area were considered as fixed factors with nine, two and one degrees of freedom, respectively. As some interactions among factors were significant, multiple one-way ANCOVAs were carried out to further analyze the effect of each factor. To test the dif-ferences between the means of factor levels, we used Tukey’s “honest significant difference” method (Team, 2013). We graphically examined model residuals to verify that ANCOVA assumptions were fulfilled (i.e. normal distribution of resid-uals, equal variance among groups, homoscedasticity, and linear relationship). All statistical analyses were performed with R software (Team,2013).
3. Results
3.1 Mean transmittance
Mean light transmittance (mT) depended on forest composi-tion (62.5% of the total explained variance) and basal area (33.0%), as indicated by type II sum of squares, whereas the interactions between composition and basal area (2.9%), forest structure (1.4%) and the other interactions among fac-tors (0.2%) had minor effects (Table1). A gradient of mean transmittance was observed in relation to stand composition. Light transmittance was the lowest (i.e. tree light interception was the greatest) in the most shade-tolerant pure beech stands (on average, mT = 4.8% ± 4.3% (mean ± standard devia-tion)) while transmittance in the least shade-tolerant pure pine stands was the greatest (43.0% ± 11.5%). As expected, mean transmittance clearly decreased with basal area. For instance, the mean transmittance in oak stands with basal area of 15 and 35 m2ha−1 were 28.7% ± 2.36% and 7.6% ± 1.31%, respectively.
Mean transmittance of mixed stands was always interme-diate between the transmittance in corresponding pure stands (Fig.3) and always lower than the weighted average of trans-mittance in corresponding pure stands (weighted by species basal area proportion). For example, transmittance in mix-tures of oak–pine (25.9% ± 10.8%) was intermediate between pure stands of oak (lower light transmitted, 16.9% pm 9.0%) and pine (higher light transmitted, 43.0% ± 11.5%) and lower than the weighted average (29.9%). In the case of mixtures of three species, transmittance was intermediate between the transmittance of the corresponding two most shade-tolerant species mixtures and the transmittance of the pure stand of the most shade-intolerant species although the amount of transmitted light was usually closer to that found in mixtures of the two shade-tolerant species. Again as an example, in
beech–fir–pine mixtures, light transmittance (14.1% ± 8.3%) was slightly greater than in beech–fir mixtures (the two more shade-tolerant species in the mix, 9.2% ± 6.5%). The trans-mittance values in mixtures of 2 or 3 species were on average 3.6% and 9.2% lower than the weighted average, respectively.
Although forest structure had a statistically significant effect on the mean of transmittance, its effect was weaker than that of stand composition or basal area (Table1). In pure stands, transmittance increased with the number of tree layers, being the lowest in single-layered stands (18.1% ± 13.9%) and the highest in reverse J-shaped stands (21.0% ± 14.8%). In mixed stands, the mean transmittance of multi-layered stands was in some cases significantly greater than in even-sized stands but in all cases remained lower than in reverse J-shaped stands (Fig.3).
3.2 Transmittance variability
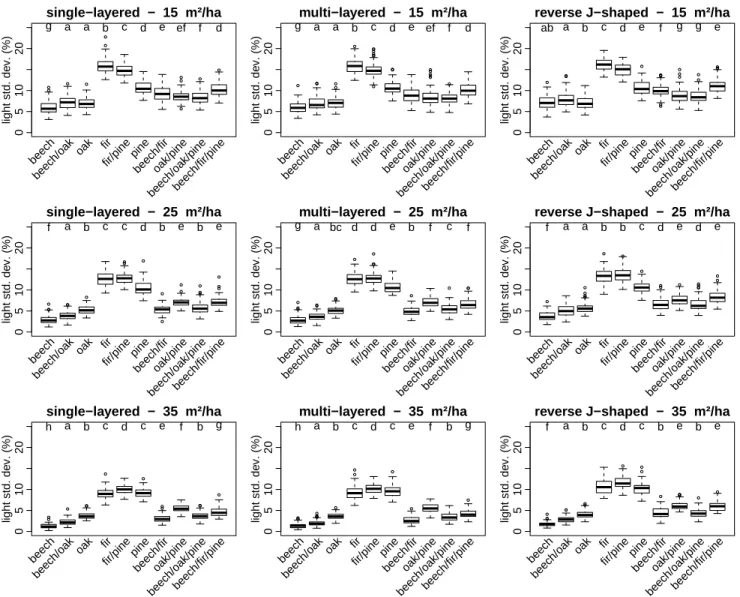
Similar to mean transmittance, the variability in transmittance depended mostly on forest composition (71.5% of total ex-plained variance, Table2) and basal area (23.9%). Forest structure (1.2%) and interactions among factors (3.4%) had little effect. The variability in transmittance was also lowest in beech stands and increased according to species shade tol-erance (beech < fir < oak < pine), with the exception of pine stands, for which the variability in transmittance was lower than in fir stands. The differences between the variability in transmittance of pine and fir stands were significant for basal area values of 15 and 25 m2ha−1. As expected, mean trans-mittance and standard deviation were positively correlated (r = 0.759, p < 2.210−16). Nevertheless, the relationships between these two variables departed from a linear relation-ship with a maximum variability in transmittance observed at about a mean transmittance of 40%.
For some combinations of stand structure, composition and basal area, the variability in transmittance in two-species mixtures was greater than the variability in corresponding pure stands (Fig. 4). This happened, for example, in oak and beech mixtures at low basal areas, as well as in the pine and fir mixtures in high-density stands. These relationships were consistent across the three modelled stand structures. However, no additive effect was observed when softwood species were mixed with hardwood species.
Similar to the results of mean transmittance, the variability in transmittance (σT) slightly increased with the number of tree layers in pure stands, being the lowest in single-layered stands (on average, σT = 7.5% ± 3.9% (mean ± standard deviation)) and the highest in stands with a reverse J-shaped structure (8.2% ± 3.8%). In mixed stands, the variability in transmittance of multi-layered stands was in some cases significantly greater than in even-aged stands, but in all cases, it remained lower than in reverse J-shaped structure stands.
The variability in transmittance generally decreased with stand basal area (Fig.4). Nevertheless, there was a significant interaction between basal area and stand composition (Table
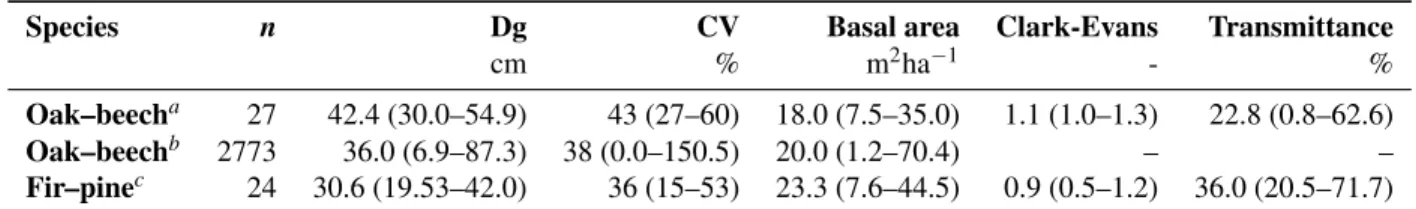
Table 1. A brief description of the plots monitored in oak-beech mixtures by (Ligot et al.,2014a) and in fir-pine mixtures by (Ameztegui and Coll,2011). The table indicates the number of studied plots (n) and, the average (range from minimum to maximum) of the following: measured quadratic mean diameter (Dg), coefficient of variation of tree diameters (CV), stand basal area, Clark-Evans aggregation index and transmittance. Regular distributions of trees have Clark-Evans values greater than 1 whereas aggregated distributions have a Clark-Evans value less than 1 (Clark and Evans,1954).
Species n Dg CV Basal area Clark-Evans Transmittance
cm % m2ha−1 - %
Oak–beecha 27 42.4 (30.0–54.9) 43 (27–60) 18.0 (7.5–35.0) 1.1 (1.0–1.3) 22.8 (0.8–62.6)
Oak–beechb 2773 36.0 (6.9–87.3) 38 (0.0–150.5) 20.0 (1.2–70.4) – –
Fir–pinec 24 30.6 (19.53–42.0) 36 (15–53) 23.3 (7.6–44.5) 0.9 (0.5–1.2) 36.0 (20.5–71.7)
Data from (a)Ligot et al.(2013),(b) the permanent inventory of forest resources in Wallonie (Alderweireld et al.,2015) and (c)Ameztegui and Coll(2011)
0 20 40 60 single−layered − 15 m²/ha mean light (%) beech beech/oak oak fir fir/pinepine beech/firoak/pine beech/oak/pinebeech/fir/pine j a b c d e f g h i 0 20 40 60 single−layered − 25 m²/ha mean light (%) beech beech/oak oak fir fir/pinepine beech/firoak/pine beech/oak/pinebeech/fir/pine j a b c d e f g h i 0 20 40 60 single−layered − 35 m²/ha mean light (%) beech beech/oak oak fir fir/pinepine beech/firoak/pine beech/oak/pinebeech/fir/pine j a b c d e f g h i 0 20 40 60 multi−layered − 15 m²/ha mean light (%) beech beech/oak oak fir fir/pinepine beech/firoak/pine beech/oak/pinebeech/fir/pine j a b c d e f g h i 0 20 40 60 multi−layered − 25 m²/ha mean light (%) beech beech/oak oak fir fir/pinepine beech/firoak/pine beech/oak/pinebeech/fir/pine j a b c d e f g h i 0 20 40 60 multi−layered − 35 m²/ha mean light (%) beech beech/oak oak fir fir/pinepine beech/firoak/pine beech/oak/pinebeech/fir/pine i a b c d e a f g h 0 20 40 60
reverse J−shaped − 15 m²/ha
mean light (%) beech beech/oak oak fir fir/pinepine beech/firoak/pine beech/oak/pinebeech/fir/pine j a b c d e f g h i 0 20 40 60
reverse J−shaped − 25 m²/ha
mean light (%) beech beech/oak oak fir fir/pinepine beech/firoak/pine beech/oak/pinebeech/fir/pine j a b c d e f g h i 0 20 40 60
reverse J−shaped − 35 m²/ha
mean light (%) beech beech/oak oak fir fir/pinepine beech/firoak/pine beech/oak/pinebeech/fir/pine i a b c d e f g h b
Figure 3. Average light transmittance for 90 virtual forest stands as a function of forest composition, forest structure and basal
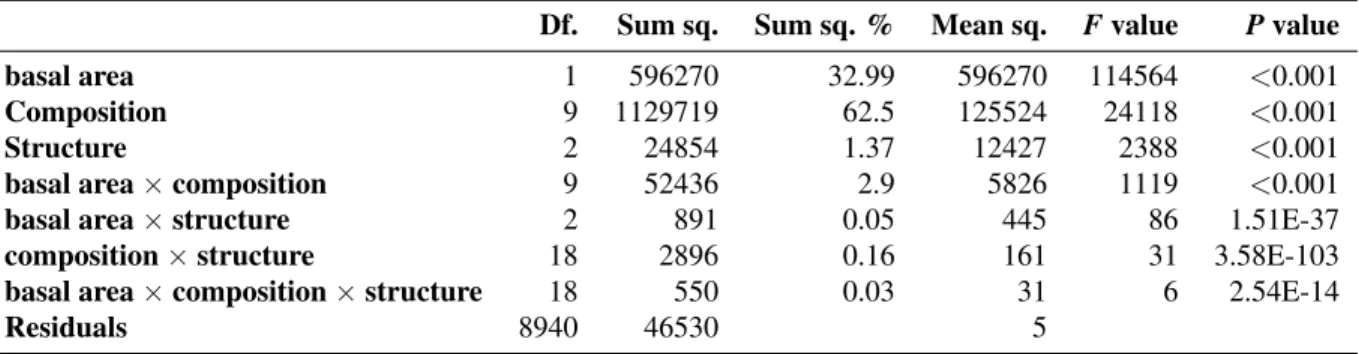
Table 2. ANCOVA table of the mean transmittance (aggregated by simulation run). The table indicates, for each factor and
interactions, the degrees of freedom (Df.), the type II sum of squares (SumSq.), the percentage of total sum of squares (Sum Sq. %), the mean square (Mean Sq.), F and P values. The R2of this model is 97%.
Df. Sum sq. Sum sq. % Mean sq. F value P value
basal area 1 596270 32.99 596270 114564 <0.001
Composition 9 1129719 62.5 125524 24118 <0.001
Structure 2 24854 1.37 12427 2388 <0.001
basal area × composition 9 52436 2.9 5826 1119 <0.001
basal area × structure 2 891 0.05 445 86 1.51E-37
composition × structure 18 2896 0.16 161 31 3.58E-103
basal area × composition × structure 18 550 0.03 31 6 2.54E-14
Residuals 8940 46530 5
was lower in pure stands of shade-intolerant or mid-tolerant species (e.g. pine and oak) than in stands of shade-tolerant species (e.g. beech and fir).
4. Discussion
4.1 Tree light capture and overstory heterogeneity
In contrast to our first hypothesis, we found no evidence that increasing structural heterogeneity reduces forest canopy light transmittance or increases tree light interception. Light transmittance even slightly increased with increasing forest structural heterogeneity. Stands composed of one homoge-neous tree layer transmitted less light than stands with two or more tree layers. These results are in line with the higher pro-ductivity of pure stands with low size heterogeneity (Bourdier et al. 2016).
On the other hand, light transmittance in mixed stands was lower than the weighted average of transmittance in cor-responding pure stands. This result supports the hypothesis that complementarity of light use could be at the origin of the over-yielding that has been observed in some mixed stands (To¨ıgo et al.,2015;Pretzsch and Sch¨utze,2009;Vallet and P´erot,2011). The difference between the observed values of transmittance in mixed stands and weighted averages origi-nates, at least partly, from the non-linearity of the relationship between light transmittance and stand basal area (Comeau and Heineman,2003;Lochhead and Comeau,2012;Sonohat et al.,2004).
However, other factors likely affect forest productivity as our results are insufficient to explain the absence of over-yielding reported for mixtures such as oak–pine and oak— beech mixtures To¨ıgo et al. (2015). In addition to the in-terception of light, light use efficiency (Onoda et al.,2014) and belowground resources also influence forest growth con-ditions (Richards et al.,2010) and the understory (Granhus et al.,2016). Despite receiving less light than taller trees, subordinate trees tend to use intercepted light more efficiently, producing a greater amount of biomass per unit of light in-terception than taller trees (Onoda et al.,2014). In addition,
To¨ıgo et al.(2015) found over-yielding growth in tree
mix-tures to increase when soil fertility is low (To¨ıgo et al.,2015). In a recent review, (Forrester,2014) showed that net comple-mentary effects in mixed-forests depend on the spatial and temporal variability in both aboveground and belowground resources. They stressed the need for further studies to quan-tify both the conditions (e.g. environmental gradients) and the processes driving these patterns (i.e. over-yielding, comple-mentary effects).
A potential limit of our approach is that the optimization of light capture in our simulated forest stands is restricted by limited crown plasticity, constrained by allometries and a random spatial distribution of trees. Allometries only roughly estimate individual crown development as they assume that the lateral growth of a tree crown is isotropic and independent of the past and present surrounding canopy. Yet, anisotropic crown growth and crown plasticity have been mentioned to be important in canopy closure (Purves et al.,2007;Vepakomma et al.,2008,2011). Additionally because in many regions tree growth and survival depend on light transmittance the natu-ral spatial distribution of trees might deviate from a random distribution in order to optimize light capture. Forest man-agement also alters the spatial distribution of trees but often tends to regularize it. Because of our approach to modeling crown dimensions and the spatial distribution of trees, we may thus underestimate the complementarity of light use in heterogeneous forests. Nevertheless, a closed layer of foliage encountered in dense monospecific even-sized stands is suffi-cient to capture most of the available light, as shown by the lack of ground vegetation and seedlings in dense even-sized stands (Bailey and Tappeiner,1998).
Our findings also underline the importance of forest com-position and density on light transmittance. In contrast to the literature (Messier et al.,1998;Lochhead and Comeau,2012), stand composition had the strongest influence on understory light in our simulations. Stand density, as measured by basal area, was the second most important factor, whereas while heterogeneity in tree size affected little (approximatelly 1%) understory light levels in comparison with the two other fac-tors. However, the order of importance of the tested factors may depend on the chosen study species and levels of basal
0 5 10 20 single−layered − 15 m²/ha light std. de v. (%) beech beech/oak oak fir fir/pinepine beech/firoak/pine beech/oak/pinebeech/fir/pine g a a b c d e ef f d 0 5 10 20 single−layered − 25 m²/ha light std. de v. (%) beech beech/oak oak fir fir/pinepine beech/firoak/pine beech/oak/pinebeech/fir/pine f a b c c d b e b e 0 5 10 20 single−layered − 35 m²/ha light std. de v. (%) beech beech/oak oak fir fir/pinepine beech/firoak/pine beech/oak/pinebeech/fir/pine h a b c d c e f b g 0 5 10 20 multi−layered − 15 m²/ha light std. de v. (%) beech beech/oak oak fir fir/pinepine beech/firoak/pine beech/oak/pinebeech/fir/pine g a a b c d e ef f d 0 5 10 20 multi−layered − 25 m²/ha light std. de v. (%) beech beech/oak oak fir fir/pinepine beech/firoak/pine beech/oak/pinebeech/fir/pine g a bc d d e b f c f 0 5 10 20 multi−layered − 35 m²/ha light std. de v. (%) beech beech/oak oak fir fir/pinepine beech/firoak/pine beech/oak/pinebeech/fir/pine h a b c d c e f b g 0 5 10 20
reverse J−shaped − 15 m²/ha
light std. de v. (%) beech beech/oak oak fir fir/pinepine beech/firoak/pine beech/oak/pinebeech/fir/pine ab a b c d e f g g e 0 5 10 20
reverse J−shaped − 25 m²/ha
light std. de v. (%) beech beech/oak oak fir fir/pinepine beech/firoak/pine beech/oak/pinebeech/fir/pine f a a b b c d e d e 0 5 10 20
reverse J−shaped − 35 m²/ha
light std. de v. (%) beech beech/oak oak fir fir/pinepine beech/firoak/pine beech/oak/pinebeech/fir/pine f a b c d c b e b e
Figure 4. Light variability in the forest understory of 90 virtual forest stands as a function of forest composition, forest
structure and basal area. The lowercase letters above the boxplots indicates significantly different groups (α = 0.05).
Table 3. ANCOVA table of the standard deviation of transmittance predictions: degree of freedom (Df.), the type II sum of
squares (Sum Sq.), the percentage of total sum of squares, mean squares (Mean Sq.), F value and P value. The R2 of this model is 88%.
Df. Sum Sq. Sum Sq. % Mean Sq. F value P value
basal area 1 28748 23.91 28748 16042 <0.001
Composition 9 85970 71.51 9552 5330 <0.001
Structure 2 1453 1.21 726 405 3.20E-169
basal area × composition 9 3530 2.94 392 219 <0.001
basal area × structure 2 78 0.07 39 22 3.40E-10
composition × structure 18 312 0.26 17 10 2.86E-27
basal area × composition × structure 18 133 0.11 7 4 8.52E-09
area. We studied species with contrasted crown shapes and sizes. The effect of the overstory composition on understory light availability is usually explained by differences in species morphological traits related to light interception (Coll et al.,
2011). In our case, leaf area density was relatively similar among the studied species (ranged between 0.5 and 0.7 m2 m−3), but crown allometries differed greatly (Fig.2) and these relationships have been shown to critically affect canopy pack-ing (Beaudet et al.,2002;Ligot et al.,2014a). In our study, the largest differences in average transmittance were observed between the simulated softwood and hardwood stands, with softwood species (pine and fir) having narrower and smaller crowns than hardwood species (oak and beech), thus trans-mitting more light (Valladares,2003). However, this result is not generalizable as the studied hardwood and softwood species were species of different shade tolerances (Valladares and Niinemets,2008) with the hardwood species being the most shade-tolerant species. In addition, Individuals of the two studied softwood species grow at higher elevations and in colder sites than those of the two studied hardwood species, with consequences both on allometries and on leaf area den-sity (L´opez-Serrano et al.,2005;Astrup and Larson,2006;
Leuschner et al.,2006;Lefranc¸ois et al.,2008).
4.2 Variability of understory light and overstory het-erogeneity
In contrast to our second hypothesis, we did not find a sys-tematic decrease in the range of understory light conditions with overstory heterogeneity. Instead, increasing tree size heterogeneity and especially species heterogeneity resulted in significantly greater variability of understory light conditions, depending on stand composition and basal area. For example, beech, a very shade tolerant species, maintained a very dark understory (low mean and variability of transmittance) even at moderate basal area (e.g. 25 m2ha−1). Adding beech in mix-tures with oak generally limited the variability of understory light except in stands with very low basal area (15 m2ha−1). In contrast, the variability of understory light in mixtures of pine and fir was greater than in the corresponding pure stands of either pine or fir, when basal area was high (≥ 25 m2ha−1). Forest structure, i.e. the organization of trees in different ver-tical strata, little affected the variability in understory light conditions. In pure stands, the variability in transmittance in-creased with the number of tree strata, but in mixed stands, the lack of difference between single-layered and multi-layered stands was not expected. Although an earlier study in mixed hardwood stands in northeastern North America found little variation in light transmittance with stand age and thus canopy strata complexification (Brown and Parker,1994). However, we acknowledge that this result may be influenced, at least in part, by the approach we used to generate mixed stands: mixed, single-layered stands were composed of two species in one single tree layer, with trees of about the same DBH but varying in height depending on specific allometries. There-fore, the comparable understory light variability observed
between single-layered and multi-layered stands may be due to a lack of sufficient differences in the heterogeneity of tree sizes for these two structures.
The variability in understory light and the mean transmit-tance through the canopy are positively correlated and hence influenced by similar factors. Both the mean and the vari-ability of transmittance increases as the size of canopy gap increases (Canham et al.,1990;Hardy et al.,2004). Never-theless, our results further suggest that the relationship is not linear. As corroborated by the data ofDa Silva et al.(2011), the variability in understory light is presumably maximized for a certain level of canopy openness that corresponds in our study to an approximate mean transmittance of 40%. At low understory light conditions (mT < 40%), the frequency distribution of transmittance is typically skewed to the right as most understory patches are in low light conditions and few are in high light conditions (Beaudet et al.,2011). The variability in transmittance then increases with mean trans-mittance, e.g. increased overstory heterogeneity or decreased overstory density. In contrast, in high light conditions (mT> 40%) a reduction in mean transmittance could lead to an in-crease in transmittance variability, e.g. when a shade-tolerant species was mixed in a stand with less shade-tolerant species.
5. Research perspectives
Our findings were obtained through the simulation of stands with a random spatial distribution of trees, fixed levels of basal area and constant quadratic mean diameters of 30 cm. Even though the studied stands were constructed with relatively arbitrary parameters (DBH distribution, composition, basal area), the characteristics of most simulated stands spanned typ-ical conditions found in managed forests of the study species (Table1) and for these stands the predictions of understory transmittance are well in the range of observed values (Fig.
A2). However, further work remains to be done before gener-alizing our results especially in stands with varying diameters or particular spatial distributions of trees (Ngo Bieng et al.,
2006), e.g. aggregation of tree species or aggregation of under-story trees in overunder-story gaps. The former is presumably a key variable of stand structure on understory light (Bourdier et al.,
2016) as understory light should increase with stand quadratic mean diameter for a given level of basal area (Lochhead and Comeau,2012;Ligot et al.,2014a).
In addition, further modeling efforts are required to ana-lyze the impact of even-aged and uneven-aged silviculture on understory light conditions. Uneven-aged silviculture main-tains relatively constant basal area (e.g. about 30 m2ha−1 in spruce stands with periodic removals of 5-10 m2ha−1) whereas in even-aged silviculture basal area varies greatly (e.g. from 0 to 60 m2ha−1) during a rotation (i.e. the full cycle from small regeneration to mature stand). A comparison of the effect of these two silviculture regimes on resource ac-quisition and use by forest stands therefore requires analyses that consider the change of forest structure during a complete rotation.
An investigation of the influence of individual plasticity of crown geometry such as light induced plagiotropy and leaf area density should also be performed as these traits are known to be affected by openings and stand composition (Mitchell,
1975;Umeki,1996,1997;Piboule,2001;Purves et al.,2007;
Strigul et al.,2008). As we repeated our simulation 100 times, this effect has probably been partly minimized. Nonetheless, the extent to which individual crowns can expand in reaction to the local environment and how this affect understory light needs to be further studied.
6. Conclusion
The advantage of heterogeneous forest stands may lie in op-portunities to naturally regenerate various species in the un-derstory as well as in opportunities to enhance light capture by the overstory. This study has taken a step in the direction of better understanding the effects of forest heterogeneity on light capture and light distribution between the canopy and regeneration layers, which is a necessary step in the current debate on increasing forest heterogeneity as a technique for making forest management more sustainable.
Acknowledgements
We are particularly grateful to Franc¸ois de Coligny (INRA, AMAP) for his help programming the model of forest radia-tive transfer (SAMSARALIGHT) and Adeline Fayolle (ULg, Gembloux Agro-Bio Tech) for her precious comments on the manuscript.
References
Alderweireld, M., Burnay, F., Pitchugin, M., and Lecomte, H., 2015. Inventaire Forestier Wallon. R´esultats 1994 – 2012. SPW, DGO3, DNF, Direction des Ressources foresti`eres, Jambes, Belgique.
Ameztegui, A. and Coll, L., 2011. Tree dynamics and co-existence in the montane-sub-alpine ecotone: the role of different light-induced strategies. J. Veg. Sci., 22(6):1049– 1061.doi: 10.1111/j.1654-1103.2011.01316.x.
Astrup, R. and Larson, B. C., 2006. Regional variability of species-specific crown openness for aspen and spruce in western boreal canada. For. Ecol. Manage., 228(1-3): 241–250.doi: 10.1016/j.foreco.2006.02.048.
Bailey, J. D. and Tappeiner, J. C., 1998. Effects of thin-ning on structural development in 40- to 100-year-old douglas-fir stands in western oregon1. For. Ecol. Manage., 108(1–2):99–113. doi: http://dx.doi.org/10.1016/S0378-1127(98)00216-3.
Bauhus, J. and Schmerbeck, J., 2010. Silvicultural options to enhance and use forest plantation biodiversity. Ecosys-tem goods and services from plantation forests. Earthscan, London.
Beaudet, M., Messier, C., and Canham, C. D., 2002. Predic-tions of understorey light condiPredic-tions in northern hardwood forests following parameterization, sensitivity analysis, and tests of the sortie light model. For. Ecol. Manage., 165(1-3): 235–248.doi: 10.1016/S0378-1127(01)00621-1.
Beaudet, M., Harvey, B. D., Messier, C., Coates, K. D., Poulin, J., Kneeshaw, D. D., Brais, S., and Bergeron, Y., 2011. Man-aging understory light conditions in boreal mixedwoods through variation in the intensity and spatial pattern of har-vest: a modelling approach. For. Ecol. Manage., 261(1): 84–94.doi: 10.1016/j.foreco.2010.09.033.
Bengtsson, J., Nilsson, S. G., Franc, A., and Menozzi, P., 2000. Biodiversity, disturbances, ecosystem function and manage-ment of european forests. For. Ecol. Manage., 132(1):39–50.
doi: http://dx.doi.org/10.1016/S0378-1127(00)00378-9. Bourdier, T., Cordonnier, T., Kunstler, G., Piedallu, C.,
Lagar-rigues, G., and Courbaud, B., 2016. Size inequality reduces forest productivity: An analysis combining inventory data for ten european species and a light competition model. PloS one, 11(3).doi: 10.1371/journal.pone.0151852. Brown, M. and Parker, G., 1994. Canopy light transmittance
in a chronosequence of mixed-species deciduous forests. Canadian Journal of Forest Research-Revue Canadienne De Recherche Forestiere, 24(8):1694–1703.
Brunner, A., 1998. A light model for spatially explicit forest stand models. For. Ecol. Manage., 107(1-3):19–46. doi: 10.1016/S0378-1127(97)00325-3.
Canham, C. D., Denslow, J. S., Platt, W. J., Runkle, J. R., Spies, T. A., and White, P. S., 1990. Light regimes beneath closed canopies and tree-fall gaps in temperate and tropical forests. Can. J. For. Res., 20(5):620–631.doi: 10.1139/x90-084.
Clark, P. J. and Evans, F. C., 1954. Distance to nearest neigh-bor as a measure of spatial relationships in populations. Ecology, 35(4):445–453.doi: 10.2307/1931034.
Coates, K. D., Canham, C. D., Beaudet, M., Sachs, D. L., and Messier, C., 2003. Use of a spatially explicit individual-tree model (sortie/bc) to explore the implications of patchiness in structurally complex forests. For. Ecol. Manage., 186 (1-3):297–310. doi: 10.1016/S0378-1127(03)00301-3. Coll, L., Gonz´alez-Olabarria, J. R., Mola-Yudego, B., Pukkala,
T., and Messier, C., 2011. Predicting understory maximum shrubs cover using altitude and overstory basal area in different mediterranean forests. Eur. J. For. Res., 130(1): 55–65.doi: 10.1007/s10342-010-0395-y.
Comeau, P. G. and Heineman, J. L., 2003. Predicting understory light microclimate from stand parameters in young paper birch (betula papyrifera marsh.) stands. For. Ecol. Manage., 180(1-3):303–315. doi: 10.1016/S0378-1127(02)00581-9.
Courbaud, B., de Coligny, F., and Cordonnier, T., 2003. Sim-ulating radiation distribution in a heterogeneous norway spruce forest on a slope. Agric. For. Meteorol., 116(1-2): 1–18.doi: 10.1016/S0168-1923(02)00254-X.
Da Silva, D., Balandier, P., Boudon, F., Marquier, A., and Godin, C., 2011. Modeling of light transmission under heterogeneous forest canopy: an appraisal of the effect of the precision level of crown description. Ann. For. Sci., 69 (2):191–193.doi: 10.1007/s13595-011-0139-2.
Drever, C. R. and Lertzman, K. P., 2003. Effects of a wide gradient of retained tree structure on understory light in coastal douglas-fir forests. Can. J. For. Res., 33(1):137– 146.doi: 10.1139/x02-167.
Dufour-Kowalski, S., Courbaud, B., Dreyfus, P., Meredieu, C., and De Coligny, F., 2012. Capsis: an open software framework and community for forest growth modelling. Ann. For. Sci., 69(2):221–233. doi: 10.1007/s13595-011-0140-9.
Forrester, D. I., 2014. The spatial and temporal dynamics of species interactions in mixed-species forests: From pat-tern to process. For. Ecol. Manage., 312:282–292. doi: http://dx.doi.org/10.1016/j.foreco.2013.10.003.
Forrester, D. I., Bauhus, J., Cowie, A. L., and Vanclay, J. K., 2006. Mixed-species plantations of eucalyptus with nitrogen-fixing trees: A review. For. Ecol. Manage., 233 (2-3):211–230. doi: 10.1016/j.foreco.2006.05.012. Franklin, J. F., Lindenmayer, D., MacMahon, J. A., McKee,
A., Magnuson, J., Perry, D. A., Waide, R., and Foster, D., 2000. Threads of continuity. Conservation in Practice, 1 (1):8–17. doi: 10.1111/j.1526-4629.2000.tb00155.x. Granhus, A., Metslaid, M., and von L¨upke, N., 2016.
Ef-fects of nutrient supply on understory picea abies seedling growth in partially cut stands in south-east norway. Forestry.
doi: 10.1093/forestry/cpv056.
Hardy, J. P., Melloh, R., Koenig, G., Marks, D., Winstral, A., Pomeroy, J. W., and Link, T., 2004. Solar radiation trans-mission through conifer canopies. Agric. For. Meteorol., 126(3-4):257–270. doi: 10.1016/j.agrformet.2004.06.012. Huston, M., 1979. A general hypothesis of species diversity.
Am. Nat., 113(1):81–101.
Jactel, H., Brockerhoff, E., and Duelli, P., 2005. A test of the biodiversity-stability theory: meta-analysis of tree species diversity effects on insect pest infestations, and re-examination of responsible factors. For. Diversity and Funct., 176:235–262.doi: 10.1007/3-540-26599-6˙12. Kelty, M. J., 2006. The role of species mixtures in
planta-tion forestry. For. Ecol. Manage., 233(2-3):195–204. doi: 10.1016/j.foreco.2006.05.011.
Kobe, R., Pacala, S., Silander Jr, J., and Canham, C., 1995. Ju-venile tree survivorship as a component of shade tolerance. Ecol. Appl., 5(2):517–532.doi: 10.2307/1942040. Ledig, F. T., 1992. Human impacts on genetic
diver-sity in forest ecosystems. Oikos, 63(1):87–108. doi: 10.2307/3545518.
Lefranc¸ois, M.-L., Beaudet, M., and Messier, C., 2008. Crown openness as influenced by tree and site characteristics for yellow birch, sugar maple, and eastern hemlock. Can. J. For. Res., 38(3):488–497.doi: doi:10.1139/X07-177. Leuschner, C., Voss, S., Foetzki, A., and Clases, Y., 2006.
Variation in leaf area index and stand leaf mass of european beech across gradients of soil acidity and precipitation. Plant Ecol., 186(2):247–258. doi: 10.1007/s11258-006-9127-2.
Ligot, G., Balandier, P., Coubraud, B., Jonard, M., Knee-shaw, D., and Claessens, H., 2014a. Managing under-story light to maintain a mixture of species with different shade tolerance. For. Ecol. Manage., 327(1):189–200.doi: 10.1016/j.foreco.2014.05.010.
Ligot, G., Balandier, P., Courbaud, B., and Claessens, H., 2014b. Forest radiative transfer models: which approach for which application? Can. J. For. Res., 44(5):385–397.
doi: 10.1139/cjfr-2013-0494.
Ligot, G., Balandier, P., Fayolle, A., Lejeune, P., and Claessens, H., 2013. Height competition between quercus petraea and fagus sylvatica natural regeneration in mixed and uneven-aged stands. For. Ecol. Manage., 304:391–398.
doi: 10.1016/j.foreco.2013.05.050.
Lochhead, K. D. and Comeau, P. G., 2012. Relationships between forest structure, understorey light and regeneration in complex douglas-fir dominated stands in south-eastern british columbia. For. Ecol. Manage., 284:12–22. doi: 10.1016/j.foreco.2012.07.029.
L´opez-Serrano, F. R., Garc´ıa-Morote, A., Andr´es-Abell´an, M., Tendero, A., and Del Cerro, A., 2005. Site and weather effects in allometries: A simple approach to climate change effect on pines. For. Ecol. Manage., 215(1-3):251–270.doi: 10.1016/j.foreco.2005.05.014.
McElhinny, C., Gibbons, P., Brack, C., and Bauhus, J., 2005. Forest and woodland stand structural complexity: Its defini-tion and measurement. For. Ecol. Manage., 218(1-3):1–24.
doi: 10.1016/j.foreco.2005.08.034.
Messier, C., Parent, S., and Bergeron, Y., 1998. Effects of overstory and understory vegetation on the understory light environment in mixed boreal forests. J. Veg. Sci., 9(4): 511–520.doi: 10.2307/3237266.
Mitchell, K. J., 1975. Dynamics and simulated yieldof douglas-fir. For. Sci., 21(4):1–39.
Ngo Bieng, M. A., Ginisty, C., Goreaud, F., and Perot, T., 2006. First typology of oak and scots pine mixed stands in orl´eans forest (france), based on the canopy spatial structure. N. Z. J. For. Sci., 36:325–346.
Niinemets, ., 2006. The controversy over traits confer-ring shade-tolerance in trees: ontogenetic changes re-visited. J. Ecol., 94(2):464–470. doi: 10.1111/j.1365-2745.2006.01093.x.
Noss, R. F., 1999. Assessing and monitoring forest bio-diversity: A suggested framework and indicators. For. Ecol. Manage., 115(2-3):135–146. doi: 10.1016/S0378-1127(98)00394-6.
Onoda, Y., Salu˜nga, J. B., Akutsu, K., Aiba, S. I., Yahara, T., and Anten, N. P. R., 2014. Trade-off between light inter-ception efficiency and light use efficiency: Implications for species coexistence in one-sided light competition. J. Ecol., 102(1):167–175.doi: 10.1111/1365-2745.12184.
Piboule, A., 2001. Validation et analyse de sensibilit´e d’un mod`ele de transfert radiatif en vue de son application `a la cartographie de l’´eclairement en peuplement forestier. D.e.a.
Pretzsch, H., Sch¨utze, G., and Uhl, E., 2013. Resistance of european tree species to drought stress in mixed versus pure forests: Evidence of stress release by inter-specific facili-tation. Plant Biol., 15(3):483–495. doi: 10.1111/j.1438-8677.2012.00670.x.
Pretzsch, H. and Sch¨utze, G., 2009. Transgressive overyield-ing in mixed compared with pure stands of norway spruce and european beech in central europe: evidence on stand level and explanation on individual tree level. Eur. J. For. Res., 128(2):183–204.doi: 10.1007/s10342-008-0215-9. Puerta-Pi˜nero, C., G´omez, J. M., and Valladares, F., 2007.
Irradiance and oak seedling survival and growth in a hetero-geneous environment. For. Ecol. Manage., 242:462–469.
doi: 10.1016/j.foreco.2007.01.079.
Puettmann, K. J., Coates, K. D., and Messier, C. C., 2009. A critique of silviculture: managing for complexity. Island Press, Washington, USA.
Purves, D. W., Lichstein, J. W., and Pacala, S. W., 2007. Crown plasticity and competition for canopy space: A new spatially implicit model parameterized for 250 north ameri-can tree species. PloS one, 2(9):1–11. doi: 10.1371/jour-nal.pone.0000870.
Reich, P. B., Tilman, D., Isbell, F., Mueller, K., Hobbie, S. E., Flynn, D. F. B., and Eisenhauer, N., 2012. Impacts of biodi-versity loss escalate through time as redundancy fades. Sci-ence, 336(6081):589–592. doi: 10.1126/science.1217909.
Richards, A. E., Forrester, D. I., Bauhus, J., and Scherer-Lorenzen, M., 2010. The influence of mixed tree plantations on the nutrition of individual species: a review. Tree Physiol.
doi: 10.1093/treephys/tpq035.
Sonohat, G., Balandier, P., and Ruchaud, F., 2004. Predicting solar radiation transmittance in the understory of even-aged coniferous stands in temperate forests. Ann. For. Sci., 61 (7):629–641.doi: 10.1051/forest:2004061.
Strigul, N., Pristinski, D., Purves, D., Dushoff, J., and Pacala, S., 2008. Scaling from trees to forests: Tractable macro-scopic equations for forest dynamics. Ecol. Monogr., 78(4): 523–545.doi: 10.1890/08-0082.1.
Team, R. C., 2013. R: A language and environment for statis-tical computing.
To¨ıgo, M., Vallet, P., Perot, T., Bontemps, J., Piedallu, C., and Courbaud, B., 2015. Overyielding in mixed forests decreases with site productivity. J. Ecol., 103(2):502–512.
doi: 10.1111/1365-2745.12353.
Umeki, K., 1996. The effects of plasticity in crown shape on size-structure dynamics of population. Jpn. Ecol., 46: 87–92.
Umeki, K., 1997. Effect of crown asymmetry on size-structure dynamics of plant populations. Ann. Bot., 79(6):631–641.
doi: 10.1006/anbo.1996.0388.
Vales, D. J. and Bunnell, F. L., 1988. Relationships between transmission of solar radiation and coniferous forest stand characteristics. Agric. For. Meteorol., 43(3-4):201–223.doi: 10.1016/0168-1923(88)90049-4.
Valladares, F. and Niinemets, U., 2008. Shade tolerance, a key plant feature of complex nature and consequences. Annual Review of Ecology, Evolution, and Systematics, 39(1):237– 257.doi: 10.1146/annurev.ecolsys.39.110707.173506. Valladares, F., 2003. Light heterogeneity and plants: from
ecophysiology to species coexistence and biodiversity. Vallet, P. and P´erot, T., 2011. Silver fir stand productivity
is enhanced when mixed with norway spruce: Evidence based on large-scale inventory data and a generic modelling approach. J. Veg. Sci., 22(5):932–942.doi: 10.1111/j.1654-1103.2011.01288.x.
Vepakomma, U., St-Onge, B., and Kneeshaw, D., 2011. Re-sponse of a boreal forest to canopy opening: Assessing vertical and lateral tree growth with multi-temporal lidar data. Ecol. Appl., 21(1):99–121.
Vepakomma, U., St-Onge, B., and Kneeshaw, D., 2008. Spa-tially explicit characterization of boreal forest gap dynamics using multi-temporal lidar data. Remote Sens. Environ., 112 (5):2326–2340.doi: 10.1016/j.rse.2007.10.001.
Yachi, S. and Loreau, M., 2007. Does complementary re-source use enhance ecosystem functioning? a model of light competition in plant communities. Ecol. Lett., 10(1): 54–62.doi: 10.1111/j.1461-0248.2006.00994.x.
Figure A1. Comparison of prediction and measures with hemispherical photographs of transmittance in Spanish forests
composed of mountain pine and silver fir (left panel) and Belgian forests of European beech and oak (right panel). Predictions were computed with two radiative transfer models: SORTIE-ND (in red) and SAMSARALIGHT (in grey). The
SAMSARALIGHT model was chosen to perform the simulation of this study and its performance was further described by
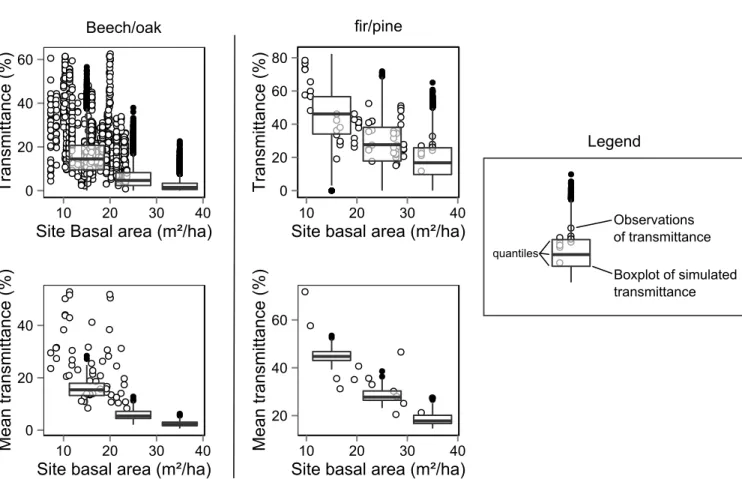
Observations of transmittance Boxplot of simulated transmittance quantiles
Beech/oak
fir/pine
Legend
Figure A2. Comparison of the simulated values of transmittance and values of transmittance recorded in previous studies
along a gradient of stand basal area. The two plots on the left show values for oak–beech mixtures (Ligot et al.,2013) whereas the two plots on the right show values for fir–pine mixtures (Ameztegui and Coll,2011). Simulated values are depicted with boxplots whereas observed values are depicted with empty dots.Ligot et al.(2013) did not sample plots along the whole basal area gradient —- even though such stands exist (Table1) — because their study focused on partially open forests with natural regeneration.