La clarification des vins par procédés membranaires en particulier la microfiltration tangentielle a toujours été limitée par le colmatage, générant des flux de perméation faibles incompatibles avec la rentabilité économique. La compréhension, la maîtrise, ainsi que l’anticipation des phénomènes de colmatage font l’objet de ce travail. Dans un premier temps, la contribution individuelle puis en mélange des composés du vin (tannins, pectines, mannoprotéines et levures) au colmatage d’une membrane céramique multicanaux a été évaluée. Une approche fondamentale a permis de proposer des mécanismes de colmatage : la présence des pectines induit les flux de perméation les plus faibles en formant un gel à la surface de la membrane tandis que les levures semblent au contraire avoir un effet protecteur dans le cas d’un vin brut.
Parce qu’il représente le flux au-delà duquel un colmatage irréversible apparaît à la surface de la membrane, le flux critique pour l’irréversibilité est un paramètre clef pour contrôler le colmatage. Dans le cas de la filtration de vin, aucun flux critique n’a pu être déterminé ce qui a conduit à définir un critère identifiant une zone de travail où le degré de colmatage reste acceptable. La dernière partie de cette thèse est consacrée à l’étude de la filtration dynamique (RVF) pour une éventuelle application dans le secteur vinicole. Cette technique est testée en présence de deux membranes organiques différentes: PES (hydrophile) et PTFE (hydrophobe). Les observations ont permis de mettre en évidence l’efficacité du système contre le colmatage des membranes PES induite par l’action de l’agitateur. Le colmatage des membranes PTFE est énormément affecté par les interactions molécules/membrane rendant la filtration dynamique inefficace pour lutter contre le colmatage de ces membranes.
Mots clés: Microfiltration tangentielle, vin, colmatage, tannins, pectines, mannoprotéines, flux critique, filtration dynamique
Abstract
Wine clarification by membrane processes mainly cross-flow microfiltration has been limited by membrane fouling generating low permeate fluxes with economic efficiency. Understanding, controlling and anticipation of fouling are the main goals of this work. In a first time, the individual contribution of wine compounds (tannins, pectins, mannoproteins and yeasts) to a multichannel ceramic membrane fouling was evaluated. The fouling mechanisms were analyzed using a fundamental approach. The presence of pectins induce the lowest fluxes by a gel-type formation at the membrane surface while yeasts presence tends to reduce fouling in the case of crude wine (case of mixed components).
Because it represents the flux beyond which irreversible fouling appears on the membrane surface, the critical flux for irreversibility is a key parameter to control fouling. No critical flux for irreversibility could be measured, hence a criterion that identifies a range of operating conditions where the degree of fouling remains acceptable was proposed. The last part of this work was devoted to the study of dynamic filtration (RVF) for further application in wine sector. This technique was tested with two different membranes: hydrophilic PES and hydrophobic PTFE. Results have allowed to demonstrate the efficiency of the system to reduce fouling in the case of PES membrane. Fouling of PTFE membrane is greatly influenced by molecules / membrane interaction making dynamic filtration ineffective in reducing of membrane fouling.
Keywords: Cross-flow microfiltration, wine, fouling, tannins, pectins, mannoproteins, critical flux, dynamic filtration.
remercier Joël BERTRAND, Pierre AIMAR et Béatrice BISCANS directeurs du laboratoire, de m’avoir accueilli au cours de ces trois années.
Ces travaux de recherche se sont déroulés dans le cadre d’une collaboration entre le Laboratoire de Génie Chimique et l’équipe procédés de la faculté d’œnologie de Bordeaux en partenariat avec la société PERA. Je remercie Xavier PERA pour le soutien financier de la thèse ainsi que Jean Luc FAVAREL et Aude BESSIERE pour leur soutien technique et scientique pendant les travaux. J’associe à ces remerciements l’ensemble du personnel de PERA pour l’aide apportée tout au long de cette thèse.
La direction de ce travail a été assurée par Claire ALBASI et Audrey DEVATINE que je remercie pour le recul qu’elles ont su apporter ainsi que pour les discussions scientifiques que nous avons eues et qui m’ont beaucoup appris, notamment à avoir un regard critique et à se poser toujours la question de la pertinence de l’objectif fixé. Je tiens également à les remercier aussi pour leurs disponibilités tout au long de ces trois années, en particulier lorsque je me suis confronté aux doutes. Je tiens egalement à souligner la grande confiance qu’elles m’ont accordée ainsi que les opportunités de collaborations avec des partenaires nationaux qu’elles m’ont offertes.
Je tiens à remercier Martine MIETTON-PEUCHOT d’avoir présidé le jury de soutenance ainsi que pour les discussions scientifiques pendant ces trois années de thèse. Je tiens à exprimer ma gratitude à Carme GUELL-SAPERAS et Marie PIERRE-BELLEVILLE d’avoir accepté de lire et juger ce travail en tant que rapporteurs. Je remercie également Patrice BACCHIN, Geneviève GESAN-GUIZIOU et Jean-Luc FAVAREL d’avoir accepté de siéger au jury de cette thèse.
Un grand merci à Patricia TAILLANDIER pour son apport scientifique en ce qui concerne la chimie du vin ; mais aussi pour sa confiance en moi et pour l’opportunité qu’elle m’a offerte pour découvrir le monde de l’enseignement.
J’exprime ma gratitude à Patrice BACCHIN pour son apport scientifique en ce qui concerne la physico-chimie des solutions, la pression osmotique et les flux critiques. Je lui suis très reconnaissant pour son savoir qu’il a su me faire partarger.
Je tiens à remercier aussi Luc FILLAUDEAU d’avoir accpeté de nous prêter gracieusement le pilote de filtration dynamique ainsi de son aide et des ses conseils pour réaliser les filtrations dynamiques.
Je voudrais remercier les responsables et le personnel de la cave coopérative de Rabastens spécialement Jean-Noel BARRAU et Cédric MONVIEL d’avoir pris soin de la cuve du vin stockée à la cave. Je tiens également à remercier Sébastien DURAND de Purpan pour l’analyse des composés phénoliques.
Je tiens à remercier l’ensemble du personnel du laboratoire spécialement le service technique : Jean-louis Nadalin, Christine Rey-Rouch, Marie-Line Pern, Marie Morère et Bernard Gali. Je remercie aussi l’ensemble des permanents et doctorants qui ont rendu ces trois années très conviviales.
Laurence, Julien, Amandine, Raphaël, Diana, Joyce, Anne Laure, Marianne et Aurélie. Je remercie aussi la communauté libanaise de Toulouse : Georges, Joseph, Marlène, Fadi, Nadine, Phélomène, Hikmat, Micheline, Jack, Fares, Serge, Maha, William, Wissam, Rana, Rania et Nancy pour leur amitié.
Pour finir, un merci dans égal à mes parents et mes sœurs pour votre soutien inconditionnel : sans vous rien n’était possible….
Table des matières
Nomenclature ... i
Liste des figures ... iii
Liste des tableaux ... ix
Introduction générale ... 1
Chapitre I: Synthèse bibliographique ... 5
Préambule ... 6 1. Introduction ... 9 2. Wine’s composition ... 11 2.1. Wine colloids ... 12 2.1.1. Phenolic compounds ... 12 2.1.2. Polysaccharides ... 13 2.1.3. Proteins ... 14 2.2. Wine particles ... 15 2.2.1. Yeasts ... 15 2.2.2. Bacteria ... 15 2.2.3. Tartrate crystals ... 16 2.2.4. Colloidal aggregates ... 16
3. CFMF principle and its applications in oenology ... 17
3.1. Wine final filtration ... 18
3.2. Other applications ... 19
4. CFMF fouling mechanisms in oenology ... 20
4.1. Mathematical description of fouling ... 23
4.2. Fouling by wine components ... 24
4.2.1. Fouling by wine colloids ... 25
4.2.1.1. Fouling by wine’s polysaccharides... 27
4.2.1.2. Fouling by wine polyphenols ... 28
4.2.1.3. Fouling by wine proteins ... 30
4.2.2. Fouling by wine particles ... 31
4.3. Parameters influencing membrane fouling ... 33
4.3.1. Operating conditions ... 33
4.3.1.3. Cross-flow velocity ... 35
4.3.1.4. Temperature ... 36
4.3.2. Membrane characteristics ... 37
4.3.3. Fluid characteristics ... 40
5. Membrane cleaning ... 42
5.1. Hydraulic and mechanical techniques ... 42
5.2. Chemical techniques ... 43
6. Innovations and commercial proposal ... 44
7. Conclusion ... 47
References ... 48
Conclusion du chapitre ... 54
Chapitre II: Matériel et Méthodes ... 56
1. Matériel et procédure de filtration tangentielle ... 57
1.1. Pilote de filtration tangentielle ... 57
1.2. Membrane de microfiltration tangentielle ... 60
2. Les vins expérimentaux ... 61
3. Protocoles et conditions de filtrations ... 62
3.1. Les filtrations tangentielles à pression constante ... 62
3.2. Détermination du flux critique ... 65
3.3. Les filtrations frontales ... 67
3.4. Filtrations dynamiques ... 68
4. Méthodes d’analyses des vins ... 68
4.1. Mesure de la turbidité ... 68
4.2. Indice des polyphénols totaux ... 68
4.3. Les caractéristiques chromatiques du vin ... 69
4.4. Dosage des anthocyanes totaux ... 69
4.5. Dosage des tanins totaux ... 70
4.6. Dosage des tanins par UHPLC ... 71
4.7. Dosage des polysaccharides totaux ... 72
4.8. Granulométrie laser ... 73
4.9. Mesure de viscosité dynamique ... 73
5. Culture de levures ... 73
Références ... 75
Partie III.1 ... 79
1. Introduction ... 81
2. Theory ... 83
3. Materials and methods ... 87
3.1. Red wine ... 87
3.2. Chemicals and yeast culture ... 87
3.3. Wine analytical ... 88
3.4. Cross-flow microfiltration pilot ... 88
3.5. Microfiltration experiments procedure ... 90
3.5.1. Cross-flow filtrations ... 90
3.5.2. Dead-end filtrations ... 90
3.5.3. Chemical cleaning ... 91
4. Results and discussion ... 92
4.1. Impact of wine molecules ... 92
4.1.1. Filtered Wine ... 92
4.1.2. Impact of added tannins... 93
4.1.3. Impact of added pectins ... 95
4.1.4. Impact of added mannoproteins ... 98
4.1.5. Impact of yeasts ... 100
4.1.6. Analysis of the initial fluxes ... 102
4.2. Fouling analysis ... 103
4.2.1. Fouling by tannins molecules ... 103
4.2.2. Fouling with wine polysaccharides ... 106
4.3. Influence of CFMF on chemical composition of wines ... 110
4.4. Initial turbidity: a factor for predicting microfiltration performance? ... 114
5. Conclusion ... 115
References ... 116
Partie III.2 ... 119
1. Introduction ... 120
2. Résultats et discussion ... 121
2.1. Incidence des lies de levures ... 121
2.2. Impact du vin brut ... 123
3. Conclusion ... 129
Chapitre IV: Conditions critiques de colmatage ... 132
Préambule ... 133
1. Introduction ... 135
2. Background ... 137
3. Materials and Methods ... 140
3.1. Red wine ... 140
3.2. Chemicals ... 140
3.3. Wine components analysis ... 140
3.4. Experimental apparatus ... 142
3.5. Critical flux determination: the method of SWB ... 144
3.6. Calculation method of the irreversible and reversible resistance ... 145
4. Results ... 145
4.1. Determination of the critical flux for filtered wine (FW) ... 145
4.2. Effect of the added molecules ... 147
4.2.1. Impact of tannins on the evolution of the critical flux... 147
4.2.2 Impact of polysaccharides on the evolution of the critical flux ... 149
5. Discussion ... 152
6. Conclusion ... 157
References ... 157
Conclusion du chapitre ... 160
Chapitre V: Filtration Dynamique ... 161
1. Introduction ... 162
2. Matériel et Méthodes ... 164
2.1. Pilote de filtration dynamique ... 164
2.2. Module de filtration dynamique RVF et membranes ... 167
2.3. Fluides filtrés et protocoles expérimentaux ... 168
3. Résultats et discussion ... 169
3.1. Pertes de charge linéiques et pressions transmembranaires imposée, locale et moyenne .... 169
3.2. Perméabilités à l’eau ... 171
3.3. Vin filtré ... 173
3.4. Vin brut (VF + Mél. A) ... 176
4. Conclusion ... 182
Références ... 183
ANNEXE I : Compression osmotique et filtration ... 203
III. Résultats ... 207
ANNEXE II: Chromatogrammes de Thiolyse ... 209
ANNEXE III : Résultats de la Granulométrie ... 212
i
A Surface de la membrane colmatée à un temps t m²
A0 Surface de la membrane m²
D Diamètre du canal m
f Facteur de friction
FCV Facteur de concentration volumique
J Flux de perméat m3/m²/s ou m/s
J0 Flux initial de la membrane m/s
Jci Flux critique pour l’irréversibilité m/s
Kc Coefficient de résistance du modèle de blocage complet des
pores
KS Coefficient de résistance du modèle de blocage standard des
pores
Ki Coefficient de résistance du modèle de colmatage intermédiaire
des pores
Kg Coefficient de résistance du modèle de filtration sur gâteau
KA Surface bloquée de la membrane par unité de volume total filtré m²/m3
KB Surface bloquée de la section transversale par unité de volume
total filtré
m²/m3
KD Surface occupée par le gâteau formé par unité de volume total
filtré m²/m3 L Longueur de la membrane m Lp Perméabilité l/h.m².bar N Fréquence de rotation Hz n Blocking index Q Débit volumique l/h
Rm Résistance hydraulique de la membrane neuve m-1
Rads Résistance hydraulique due à l’adsorption m-1
Rht Résistance hydraulique totale m-1
Rf Résistance hydraulique due au colmatage m-1
Rrf Résistance hydraulique réversible m-1
ii Re Nombre de Reynolds
S Section de passage m²
t Temps s
TMPmoy Pression transmembranaire moyenne Pa ou bar
V Volume m3 ou ml
VRR Volumetric reduction ratio
µ Viscosité Pa.s-1
ΔP Pression transmembranaire (chapitre1,3,4) Perte de charge (chapitre 2,5)
Pa ou bar
ΔΠ Pression osmotique Pa ou bar
ΔPag Pression additionnelle due à l’agitation Pa ou bar
ν Vitesse tangentielle m/s
ρ Masse volumique Kg/m3
iii
Liste des figures
Figure I.1: Crude wine compounds classified according to their sizes. ... 9
Table I.1: Correlation between wine turbidity (NTU) and visual aspect of wine ... 10
Table I.2: Average composition of wines ... 11
Figure I.2: Summary of wine’s phenolic compounds. ... 13
Figure I.3: Main wine polysaccharides classified according to their origin. ... 14
Figure I.4: a) Principle of cross-flow microfiltration; b) Representation of the quasi-steady filtrate flow. ... 17
Figure I.5: The processes of red and white wines making and the uses of CFMF as alternative technique. ... 19
Figure I.6: A schematic presentation of red wine filtration at 800 mbar with multichannel ceramic membrane (0.2 µm) (Personal data). ... 20
Figure I.7: Schematic description of fouling mechanisms during filtration of wine. ... 21
Figure I.8: The effects of the driving force (transmembrane pressure) and the colloid size on the fouling mechanisms ... 23
Figure I.9: Schematic representation of the filtration protocol used to determine resistances-in-series adapted to wine filtration from ... 24
Figure I.10: Schematised phase diagram of a colloidal dispersion ... 26
Figure I.11: Influence of protein content on the wine permeate flux during microfiltration using different treatments ... 31
Figure I.12: Proposed mechanisms for microfiltration membrane fouling by colloids with and without particles ... 32
Table I.3: Summary of the parameters influencing membrane fouling ... 33
Figure I.13: Summarizing of membrane fouling state depending on the system forces. ... 35
Table I.4: Variation of dynamic viscosity of 3 different wines with temperature ... 36
Table I.5: Main membranes used in microfiltration of wine ... 38
Figure I.14: Different configurations of ceramic membranes adapted for different types of wine ... 45
Figure I.15: Flavy FX tandem filter ... 46
iv
Tableau II.1: Etalonnage de la vitesse tangentielle ... 58
Figure II.2: Schéma du montage du pilote de microfiltration tangentielle ... 59
Figure II.3: Membrane céramique multicanaux de Novasep ... 60
Tableau II.2: Caractéristique de la membrane céramique utilisée ... 60
Figure II.4: Schéma de vinification et des traitements pour la production de la matrice de base ... 61
Tableau II.3: Les concentrations des composés étudiées en filtration tangentielle... 62
Tableau II.4: La composition des mélanges de molécules du vin étudiés ... 62
Tableau II.5: Procédure du lavage chimique de la membrane. ... 63
Tableau II.6: Caractéristiques hydrodynamiques pour une filtration effectuée à une vitesse tangentielle de 2 m/s ... 64
Figure II.5: Evolution du facteur de friction en fonction du nombre de Reynolds ... 65
Figure II.6: Présentation schématique du principe des échelons de pression ... 65
Figure II.7: L’évolution du flux de perméation en fonction de la pression transmembranaire, technique de SWB ... 66
Tableau II.7: Les composés étudiés en filtration frontale et leurs concentrations ... 68
Figure II.8: Structure du noyau 2-phenyl benzopyrone (structure de base des anthocyanes et des tanins) ... 69
Tableau II.8: Gradient de solvants utilisé lors des analyses de thiolyse ... 72
Tableau II.9: Composition du milieu de culture synthétique ... 74
Figure III.1.1: Illustration of the fouling mechanisms considered by the blocking laws. ... 84
Table III.1.1: The blocking models and their schematic representation ... 86
Figure III.1.2: Vinification scheme used to elaborate the red wine ... 87
Figure III.1.3: a) Scheme of the experimental setup used in this study. b) The configuration of the multi-channel ceramic membrane (P = pressure sensor; T= temperature sensor). ... 89
Figure III.1.4: A summary of cross-flow microfiltration experiments. ... 90
Figure III.1.5: A summary of dead-end microfiltration experiments ... 91
v
Figure III.1.7: Variation of permeate flux during cross-flow microfiltration of wines loaded with different concentration of tannins at different transmembrane pressure ... 94 Figure III.1.8: Effect of tannins concentration and transmembrane pressure on total resistance ... 95 Figure III.1.9: Permeate flux versus permeate volume data obtained during cross-flow
microfiltration of all wines added with pectins. ... 96 Figure III.1.10: Total resistance during wines containing pectins at different concentrations (0.05, 0.25 and 0.5 g/l) and transmembrane pressure (0.5 and 1 bars). ... 97 Figure III.1.11: Impact of adding enzymes on filtration performances ... 98 Figure III.1.12: Permeate fluxes versus permeate volume during filtration wines added with mannoproteins ... 99 Figure III.1.13: Total resistance versus permeate volume during filtration wines added with mannoproteins ... 100 Figure III.1.14: Permeate fluxes versus permeate volume during filtration wines added with yeasts ... 101 Figure III.1.15: Total resistance versus permeate volume during filtration wines added with yeasts ... 101 Table III.1.3: Summary of the initial fluxes obtained with different filtrations ... 102 Table III.1.4: Summary of parameters associated to various blocking models for FW added with tannins ... 104 Figure III.1.16: Linearized plot of permeate flux versus time for different pore blocking models for FW added with tannins: (a) complete pore blocking, (b) intermediate pore
blocking, (c) standard pore blocking and (d) cake filtration. ... 105 Figure III.1.17: A plot of d²t/dV² vs. dt/dV curves for wine added with tannins ... 106 Table III.1.5: Summary of parameters associated to various blocking models for FW added with polysaccharides ... 107 Figure III.1.18: Linearized plot of permeate flux versus time for different pore blocking models for FW added with polysaccharides (0.2 g/l mannoproteins or 0.25 g/l pectins): (a) complete pore blocking, (b) intermediate pore blocking, (c) standard pore blocking and (d) cake filtration. ... 108 Figure III.1.19: A plot of d²t/dV² vs. dt/dV curves for FW added with polysaccharides (0.2 g/l mannoproteins or 0.25 g/l pectins) ... 109 Table III.1.6: Analytical composition of different wines before and after filtration... 112
vi
epicatechin). ... 113
Table III.1.8: The possible relationship between permeate fluxes at 0.5 bar and the initial turbidity (obtained after filtering a volume of 3000 ml) ... 114
Figure III.2.1 : Les effets de la présence des lies sur les flux de perméation ... 122
Figure III.2.2: Evolution des résistances hydrauliques en présence des lies de levures ... 123
Figure III.2.3 : Flux de perméation en fonction du volume lors de la MFT à 0.5 et 1 bar du vin brut ... 124
Figure III.2.4 : Résistances hydrauliques totales obtenues lors de la filtration du vin brut à 0.5 et 1 bar ... 125
Tableau III.2.1 : Analyses des caractéristiques du vin brut avant et après filtration... 126
Figure III.2.5 : Impact des levures sur la filtration des vins bruts ... 127
Figure III.2.6 : Impact de la présence des levures sur les résistances hydrauliques totales obtenues ... 128
Figure III.2.7:Schéma illustrant les mécanismes de colmatage en absence et en présence des levures. ... 129
Figure IV.1: Diagram representing the state of colloidal system at different flux values where Rm = membrane resistance, Rads = resistance due to adsorption, Rrf = reversible resistance and Rif = irreversible resistance. ... 138
Figure IV.2: Schematic representation, as seen by authors, of the critical flux of irreversibility and its relationship with the strong form and weak form of critical flux (Rf = fouling resistance). ... 139
Table IV.1: Analytical composition of wine added with tested molecules. ... 141
Figure IV.3: a) Scheme of the experimental setup for the critical flux determination b) the multi-channel ceramic membrane configuration ... 143
Table IV.2: Chemical cleaning procedure after filtration experiment. ... 143
Figure IV.4: Square wave barovelocimetry method to measure the critical flux ... 144
Table IV.3: Number of steps and the associated pressure. ... 144
Figure IV.5: Permeate flux and ΔP evolution during filtration of FW and their associated steps numbers. ... 146
Figure IV.6: Evolution of reversible Rrf and irreversible Rif fouling resistance during filtration of FW and the associated transmembrane pressure (mbars). ... 147
vii
Figure IV.8: Impact of tannins on reversible Rrf () and irreversible Rif (●) fouling. ... 149 Figure IV. 9: Permeate flux evolution during ΔP stepping performed with FW + 0.1 g/l mannoproteins, FW + 0.2 g/l mannoproteins, FW + 0.25 g/l pectins and FW + 0.5 g/l pectins. ... 150 Figure IV.10: Pectins’s impact on reversible Rrf () and irreversible Rif (●) fouling. ... 151 Figure IV.11: Mannoproteins’ impact on reversible Rrf () and irreversible Rif (●) fouling. ... 152 Figure IV.12. A- Pectic gel layer at membrane surface B- Pectic gel layer compaction C- Unstructured pectic gel layer. ... 155 Figure IV.13. Comparison of critical flux for irreversibility (the bar gives here the lower value of critical flux for FW and the upper value of critical flux for FW with added molecules) and the threshold flux. ... 156 Figure V.1 : Comparaison des principes de filtration frontale, filtration tangentielle et
filtration dynamique ... 163 Figure V.2 : Illustration du dispositif expérimental de filtration dynamique ... 166 Figure V.3: Le module RVF contenant 4 membranes (M1, M2, M3 et M4) et 2 hélices (H1 et H2). ... 167 Tableau V.1 : Déroulement des campagnes de filtration dynamique (TMPmoy. = pression transmembranaire moyenne (cf.V.3.1) et N = fréquence de rotation). ... 169 Figure V.4 : Evolution de la perte de charge (ΔP) en fonction des débits massiques (Q) dans la boucle de circulation. ... 170 Tableau V.2 : Les valeurs de la moyenne des pressions additionnelles en fonction de la
fréquence d’agitation [12] ... 171 Figure V.5 : Perméabilités à l’eau en fonction de la fréquence de rotation : a) campagne PES ; b) campagne PTFE. ... 173 Figure V.6. : Evolution de la perméabilité lors de la filtration du VF sur membranes PES et PTFE. ... 174 Figure V.7 : Evolution de la résistance hydraulique totale en fonction du volume filtré pendant la filtration du VF sur membranes PES et PTFE ... 175 Figure V.8 : Perméabilités à l’eau à 0 Hz après filtration de VF ... 176 Figure V.9 : Performances du système RVF pendant la filtration du VF + Mél. A sans et avec agitation à des fréquences différents : a) campagne PES ; b) campagne PTFE ... 178
viii
Figure V.11 : Représentation graphique de la dérivée de la résistance par rapport à la dérivée du volume filtré en fonction de la fréquence de rotation ... 181 Figure V.12 : Perméabilités obtenues lors de la filtration VF + Mél. A sur membranes PES avec une fréquence de rotation de 40 Hz en diminuant progressivement la pression
transmembranaire. ... 182 Figure V.13 : Facteurs affectant le colmatage des membranes PTFE et PES. ... 183
ix
Table I.1: Correlation between wine turbidity (NTU) and visual aspect of wine ... 10
Table I.2: Average composition of wines ... 11
Table I.3: Summary of the parameters influencing membrane fouling ... 33
Table I.4: Variation of dynamic viscosity of 3 different wines with temperature ... 36
Table I.5: Main membranes used in microfiltration of wine ... 38
Tableau II.1: Etalonnage de la vitesse tangentielle ... 58
Tableau II.2: Caractéristique de la membrane céramique utilisée ... 60
Tableau II.3: Les concentrations des composés étudiées en filtration tangentielle... 62
Tableau II.4: La composition des mélanges de molécules du vin étudiés ... 62
Tableau II.5: Procédure du lavage chimique de la membrane. ... 63
Tableau II.6: Caractéristiques hydrodynamiques pour une filtration effectuée à une vitesse tangentielle de 2 m/s ... 64
Tableau II.7: Les composés étudiés en filtration frontale et leurs concentrations ... 68
Tableau II.8: Gradient de solvants utilisé lors des analyses de thiolyse ... 72
Tableau II.9: Composition du milieu de culture synthétique ... 74
Table III.1.1: The blocking models and their schematic representation ... 86
Table III.1.2: Chemical cleaning procedure after filtration experiment... 91
Table III.1.3: Summary of the initial fluxes obtained with different filtrations ... 102
Table III.1.4: Summary of parameters associated to various blocking models for FW added with tannins ... 104
Table III.1.5: Summary of parameters associated to various blocking models for FW added with polysaccharides ... 107
Table III.1.6: Analytical composition of different wines before and after filtration... 112
Table III.1.7: Tannins subunits (mg/l) profiles before and after filtration of wines added with tannins. ... 113
Table III.1.8: The possible relationship between permeate fluxes at 0.5 bar and the initial turbidity (obtained after filtering a volume of 3000 ml) ... 114
x
Table IV.2: Chemical cleaning procedure after filtration experiment. ... 143 Table IV.3: Number of steps and the associated pressure. ... 144 Tableau V.1 : Déroulement des campagnes de filtration dynamique (TMPmoy. = pression transmembranaire moyenne (cf.V.3.1) et N = fréquence de rotation). ... 169 Tableau V.2 : Les valeurs de la moyenne des pressions additionnelles en fonction de la fréquence d’agitation ... 171
2
En fin de fermentations alcoolique et malolactique le vin brut contient des particules en suspension de différentes origines qui sont responsables de sa turbidité. Ces particules ont tendance à sédimenter, à floculer ou rester en suspension et sont en partie éliminées par décantation et soutirage. Cette phase de clarification spontanée peut être accélérée par des techniques de filtration et décantation. Un vin clarifié et stable a une valeur marchande plus élevée compte tenu de l’exigence du consommateur et du négoce qui peuvent rejeter un vin présentant un aspect trouble. La limpidité est par ailleurs indispensable à l’appréciation organoleptique du vin.
Dans les opérations du processus de vinification, la filtration des vins est une étape importante pour une présentation du vin adaptée au goût du consommateur (respect qualitatif et organoleptique, stabilité microbiologique). Traditionnellement, l’obtention de la limpidité nécessite plusieurs passages sur des filtres à plateaux ou des filtres à plaques, matériels qui consomment des quantités importantes d’adjuvants de filtration. La pression réglementaire en matière d’environnement est croissante depuis quelques années dans le secteur vinicole. Celle-ci concerne tous types de déchets solides (produits issus de la transformation du raisin, médias filtrants, etc) dû à la fermeture des décharges en 2002 ou liquides sous forme d’effluents, obligeant alors les professionnels à réduire le taux des polluants et à favoriser les technologies dites propres.
A ce jour et par rapport à ces opérations technologiques traditionnelles de clarification, la microfiltration tangentielle (MFT) constitue une véritable alternative permettant, en un seul passage, l’obtention d’un vin brillant et microbiologiquement pauvre en germes. En outre, cette technique est automatisable et limite l’utilisation de terres de filtration, plaques et lentilles. Si les principales applications de la MFT sont la clarification et la stabilité microbiologique avant la mise en bouteilles, cette technique peut intervenir à différents stades du schéma de vinification. Elle peut limiter toute déviation microbiologique si elle est utilisée de façon précoce après fermentations ou avant par la clarification des moûts. Cette dernière reste encore un challenge pour la MFT.
Malgré ses avantages, ce procédé a longtemps souffert d’une mauvaise réputation dans le secteur œnologique, ce qui a freiné son développement. En effet, les premiers essais menés sur le vin ont montré une chute rapide et très importante des flux de perméation ainsi que des rétentions excessives des composés du vin malgré le flux tangentiel. Ces observations ont été reliées au colmatage des membranes par les différents constituants du vin retenus lors de cette
3
opération, affectant ainsi la rentabilité économique du procédé et la qualité organoleptique du produit ainsi que des difficultés de régénération des membranes. Ceci était lié à une inadéquation entre les matériaux membranaires utilisés, les seuils de coupure, le choix des conditions opératoires (vitesse tangentielle et pression transmembranaire) et les caractéristiques du vin.
Ces constats ont aussi conduit au développement de travaux de recherche dans le but d’identifier les composés du vin impliqués réellement dans le colmatage, d’identifier des matériaux membranaires adaptés et de mettre en œuvre des techniques de décolmatage adéquates. Les premiers travaux ont été conduits sur des membranes minérales et se sont intéressés au rôle joué par les polysaccharides du vin. Des travaux se sont ensuite enchaînés sur des membranes organiques en prenant en compte les polysaccharides et les composés phénoliques. Puis les chercheurs se sont intéressés au rôle des particules présentes dans le vin (levures, bactéries et agrégats colloïdaux). Enfin, l’impact de la nature du matériau membranaire dans les phénomènes d’adsorption des molécules du vin a été étudié.
Tous ces travaux ont permis de mettre en évidence le développement d’un colmatage irréversible des membranes par les composés du vin. Les analyses effectuées sur les membranes ont permis d’identifier la présence des polysaccharides et des composés phénoliques. Des observations réalisées au MEB ont mis en évidence la présence d’un dépôt de matière organique, hétérogène et adhérent au matériau membranaire. En effet, des interactions physico-chimiques peuvent se développer à l’interface matériaux/vins et entre les molécules elles-mêmes induisant des chutes importantes de flux de perméation. Par ailleurs, les travaux ont souligné l’impact du matériau membranaire et le rôle joué par les propriétés de surface sur la formation et la réversibilité du colmatage.
Malgré les contributions apportées par les travaux de recherche antérieurs, il existe encore peu de connaissances fondamentales du procédé. Même s’il est admis que les macromolécules comme les polysaccharides, les composés phénoliques et les protéines ainsi que les particules sont impliquées dans l’encrassement de la membrane, l’impact et la contribution individuels des composés sont méconnus à ce jour. De même, les mécanismes impliqués dans le colmatage ne sont pas identifiés ; par exemple, la formation d’une seconde membrane par les particules ayant sa propre sélectivité pourrait même protéger partiellement la membrane du blocage interne de ses pores.
4
L’étude présentée dans ce manuscrit est axée sur l’identification et la compréhension des phénomènes de colmatage ainsi que sur la détermination des mécanismes de colmatage impliqués afin d’optimiser et de maîtriser les procédés existants de filtration tangentielle. Cette thèse s’inscrit dans le cadre d’une collaboration entre le Laboratoire de Génie Chimique de Toulouse, l’équipe de génie des procédés de la faculté d’œnologie de l’université de Bordeaux et la société « PERA ». Le travail de recherche développé au cours de cette thèse est organisé autour de 3 objectifs principaux, interdépendants :
- L’étude de l’impact individuel des molécules du vin sur le colmatage d’une membrane céramique mutlicanaux ainsi que l’identification des mécanismes de colmatage impliqués dans ces filtrations.
- La recherche des conditions opératoires critiques de filtration afin de limiter ou contrôler le colmatage.
- L’application d’une technologie novatrice pour la filière œnologique : la filtration dynamique RVF puisque les filtres tangentiels semblent toucher leurs limites de progrès.
Ce manuscrit rapportant l’ensemble de ces résultats est organisé en 5 chapitres. Le premier chapitre expose à travers une synthèse bibliographique, présentée sous forme d’un article scientifique (El RAYESS et al., Cross-flow microfiltration applied to œnology : a review : Journal of Membrane Science 382 2011 1-19), la problématique liée au colmatage des membranes par les molécules du vin ainsi que les différents paramètres influençant les performances de la microfiltration tangentielle. Le deuxième chapitre présente le matériel et les méthodes utilisé au cours de ce travail, détaillant le pilote de filtration, le vin étudié et les molécules modèles utilisées, les conditions de filtration et les analyses effectuées sur le vin. Le chapitre III est consacré aux résultats obtenus lors de la filtration des molécules modèles afin d’étudier leurs impacts individuels et les mécanismes de colmatage ainsi que leurs impacts en mélange de molécules. Le chapitre IV, présenté sous forme d’un article scientifique (resoumis au Journal of Membrane Science après une première évaluation), détaillent les résultats obtenus lors de la recherche des conditions critiques de colmatage spécialement le flux critique d’irréversibilité lors de la filtration du vin. Dans le chapitre V, les performances d’un module de filtration dynamique (RVF) seront évaluées dans le cadre de la filtration du vin en présence de deux matériaux membranaires différents. Enfin, les conclusions de ce travail et les perspectives qui en découlent seront développées.
Chapitre I:
Synthèse bibliographique
6
Préambule
Cette première partie de la thèse a été consacrée à une étude bibliographique sur l’ensemble des travaux de recherche menés sur la microfiltration tangentielle du vin. Cette étude sera présentée sous forme d’une review scientifique publiée dans Journal of Membrane Science (El RAYESS et al., Cross-flow microfiltration applied to œnology : a review : Journal of Membrane Science 382 (2011) 1-19).
La microfiltration tangentielle permet de réaliser simultanément la clarification et la stabilisation microbiologique des vins. Ce procédé présente une alternative aux techniques de filtration traditionnelles utilisées en œnologie, tant en termes de respect de l’environnement que par sa polyvalence.
En dépit de ses avantages, le développement de cette technique dans le secteur est limité par des faibles performances de filtration dues au colmatage des membranes par les composés du vin. Ce colmatage peut avoir plusieurs conséquesces: i) une diminution importante des flux de perméation et des problèmes de régénération des matériaux membranaires, ayant un impact négatif sur la rentabilité économique du procédé, ii) des rétentions importantes en molécules du vin par formation possible d’une seconde membrane ayant sa propre sélectivité.
Ces problèmes ont conduit au développement des travaux de recherche sur l’identification des molécules responsables du colmatage et la compréhension des mécanismes de colmatage mis en jeu. Les premières études ont identifié le rôle colmatant des polysaccharides du vin sur les membranes minérales. Puis, ces mêmes composés associés aux composés phénoliques ont été mis en cause lors d’essais de filtration sur des membranes organiques. Des travaux plus récents ont montré le rôle important joué par les particules du vin (levures, bactéries lactiques et agrégats colloïdaux) sur le colmatage des membranes.
Les travaux de recherche ont aussi souligné le rôle des propriétés physico-chimiques de la membrane et des intéractions entre les molécules du vin et la membrane, sur l’adsorption initiale des constituants du vin et la structuration du colmatage. Compte tenu de la diversité des composés présents dans le vin et de leur comportement physico-chimique différent, il semble que les matériaux polaires présentent moins d’affinité vis-à-vis des polyphénols. Cependant, des travaux plus récents désignent les matériaux apolaires comme étant moins favorables à l’adosprtion des composés du vin sur les membranes.
7
Pour mieux décrire et illustrer toutes les avancées scientifiques faites dans le domaine, ce chapitre a été divisé en 7 sous-chapitres. Après une introduction présentant un aperçu historique de l’introduction de la microfiltration tangentielle dans le secteur œnologique, la composition chimique du vin a été résumée vue l’implication de ces composés dans le colmatage des membranes. Une troisième partie est dédiée aux principes de la microfiltration tangentielle, à sa polyvalence et à ses avantges pour le secteur vinicole. Ensuite, le problème de colmatage des membranes pendant cette opération est évoqué en détaillant le rôle joué par les composés du vin ainsi que les paramètres influençant la formation du colmatage. Le cinquième sous-chapitre est consacré aux techniques chimiques et mécaniques mises en place pour limiter le colmatage et pour régénerer les membranes. Les derniers modèles de filtres tangentiels proposés par les constructeurs ainsi que leurs avancées technologiques sont exposés dans le sixième sous-chapitre. Le dernier sous-chapitre conclut par une vue générale sur les points qui font défaut dans le domaine œnologique pour mieux comprendre le colmatage et pour pouvoir augmenter les performances de la microfiltration tangentielle.
8
Cross-flow Microfiltration applied to oenology: A review
(Article accepté au Journal of Membrane Science 382 (2011) 1-19)Abstract
The cross-flow microfiltration applied to wine filtration has become a legitimate alternative to conventional filtration processes. However, membrane fouling which affects the operating costs and the plant maintenance, limit the widespread application of this technique. The aim of this review is to provide a better understanding of the development of the cross-flow microfiltration in wine industry, as well as the complexity of wine composition and its consequences on membrane fouling. This review covers also the impact of the operating conditions and the membrane characteristics on fouling mechanisms. Strategies to limit fouling as well as the latest innovations and commercial proposal are discussed in this paper.
9
1. Introduction
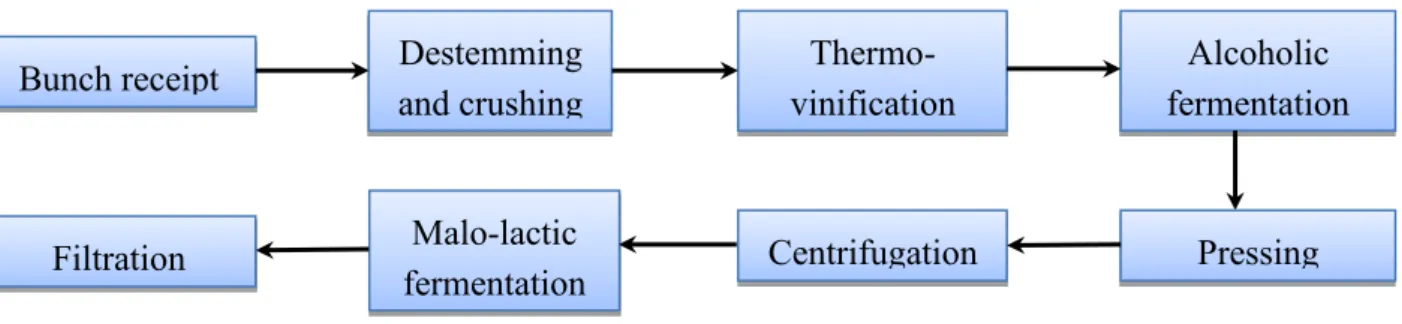
Filtration as a means of wine clarification goes back to ancient times. After alcoholic and malolactic fermentations, the crude wine is a complex medium presenting a turbid aspect. This latter is not well accepted by the consumer and wine needs to be clarified. Three groups of compounds have been identified in a crude wine according to compounds sizes as shown in figure I.1:
Solutes (size less than 1 nm) include ions, salts, organic acids and phenolic compounds.
Colloids (size range between 1 nm and 1 µm) contain polysaccharides, proteins, polymerized phenolic compounds and colloidal aggregates.
Particles (size higher than 1 µm) include microorganisms (yeast and bacteria chains), cell debris, colloidal aggregates and potassium tartrate crystals.
Figure I.1: Crude wine compounds classified according to their sizes.
When wine is cloudy, or when a deposit remains at the bottom of the bottles, it is perceived as a sign of product deterioration. Indeed, limpidity of wine is the first visual quality a consumer expects from wine. It must be a permanent quality during all the storage period (even in tank or bottle) whatever the storage conditions are (aeration, lighting, temperature,etc). The key roles of filtration are to provide limpidity and also microbiological stabilization of wines. Wine limpidity is assessed by measuring turbidity which is expressed by Nephelometric Turbidity Unit (NTU). Table I.1 summarized the wines turbidity and its correlation with the visual aspect of the wines. After filtration, the turbidity of wines must be less than 2 NTU.
10
Table I.1: Correlation between wine turbidity (NTU) and visual aspect of wine [2]
Brilliant Haziness
White wine < 1.1 NTU > 4.4 NTU Rosé wine < 1.4 NTU > 5.8 NTU Red wine < 2.0 NTU > 8.0 NTU
Stabilization could be divided into physico-chemical and microbiological stabilization. Physico-chemical stabilization (not insured by filtration) prevents the formation of organic and inorganic hazes and deposits after packaging. Microbiological stabilization by microfiltration is guaranteed by eliminating yeasts and bacteria that can destroy or modify a wine’s taste. Wine stability is defined as a state or a condition such as the wine will not, for some definite period of time, exhibit undesirable physical, chemical, or organoleptic changes [1]. These undesirable changes that denote wine instability were listed by: browning or other color deterioration, haziness or very slight cloudiness, cloudiness, deposits and undesirable taste or odor [1,2]. Many examples of colloidal instability had been identified in wines, for example the protein and polyphenols instability, iron and copper cloudiness, pectins and yeast polysaccharides haziness… [1,2].
Early, wineries were equipped with diatomaceous earth filters. This technique showed quickly its limits in terms of wine quality, wine loss and its implementation especially in cooperative cellars (non-automated process). In the mean time, cross-flow microfiltration (CFMF) was widespread used in food industry and biotechnology. It appeared as a promising process to replace the traditional filtration methods.
The first wine filtration tests using membrane goes back to 1960 in California and to 1964 in France. The first trials of cross-flow microfiltration have been conducted in oenology at the beginning of the 80’s. The used membranes at the time migrated from other industries and were not specific to wine [3,4]. This resulted in affecting the organoleptic quality of wines and increased temperatures during the process. In the mid-80’s, ultrafiltration (UF) and CFMF of wine have been the focus of large interest and research effort [5,6]. The ultrafiltration technique was unsuitable for wine filtration due to the loss of wine quality [6]. From 1990, large progress on wine CFMF was realized by the constructors especially on organic membrane [7,8]; The development of membrane materials associated with a better understanding of the compounds involved in the membrane fouling led to the selection of membranes suitable for wine filtration [7,8].
11
Nowadays, this technique is well accepted in wine industry and becomes to be widely used in cellars. Despite the progress made, however, the large-scale development of CFMF is still hampered by the technological and economical barriers induced by membrane fouling.
The purpose of this paper is to provide an overview on the CFMF process applied to oenology in order to highlight the application, the problems and the progress of this technique in oenology sector. Given the complexity of wine composition, wine compounds which are susceptible to have an impact on membrane fouling are presented. The implement and the application of the CFMF in oenology are then discussed. This section will be followed by a summary of the fouling mechanisms that hamper the development of this technique in oenology. The review will also deal with the role of wine chemistry in fouling phenomena as well as the impact of the operating parameters. To conclude, strategies to limit fouling are revised as well as the latest progress and propositions to improve CFMF at the industrial scale.
2. Wine’s composition
Wines are alcoholic drinks obtained from the fermentation of grapes. Their composition is determined by the composition of the grape, which depends on genetic characters, on vine growing conditions, on grape ripeness at harvest, and on wine-making practices. These latter involve a series of successive operations, the sequence of which varies considerably depending on the wine type. Wines’ composition depends also on yeast and bacterial strains and their metabolism. The average composition of wines (white and red) is showed in table I.2.
Table I.2: Average composition of wines [2,9]
Concentration (g.l-1) Solut es Water 750 – 900 Ethanol 69 – 121 Glycerol 5 - 20 Organic acids 3 – 20 Minerals 0.6 – 2.5 Nitrogen compounds
(amino acids and proteins) 0.5 – 5
Phenolic compounds White wine 0.1 – 0.3 Red wine 1.5 – 6 Polysaccharides 0.4 – 0.7
C
oll
12
In the following paragraphs, colloids and particles will be only presented due to their implication in the fouling phenomena during CFMF.
2.1. Wine colloids
2.1.1. Phenolic compounds
The phenolic compounds in wine include a diverse group of naturally occurring compounds, known as polyphenols. Phenolic compounds in grapes and wine could be divided into non-flavonoid compounds and non-flavonoid compounds as shown in figure I.2 [2,9]. Flavonoid group contains anthocyanins and tannins which are the most abundant phenolic compounds in the red wines. Contrariwise, little quantities of tannins are found in white wines while anthocyanins are completely absent. Grape flavanols, also called flavan-3-ols (tannins) as they are hydroxylated in the 3rd position, are found as monomers but also as oligomers and
polymers with different degrees of polymerization [10,11]. Non-flavonoid group includes phenolic acids such as benzoic acids and hydroxycinnamic acids and stilbenes such as resveratrol [2,9]. In white wine, the most important phenolic compounds are the hydroxycinnamic acids and of minor quantities, the flavan-3-ol monomers.
Major changes in phenolic compounds occur during wine elaboration and ageing. These changes are mostly related to their chemical reactivity and less to specific enzymes. Phenolic compounds can react with each other as tannin-anthocyanin linkage. Physico-chemical interactions may occur between phenolic compounds themselves as tannin-tannin and anthocyanin-anthocyanin self-association [2,9]. It may occur also between phenolic compounds and other wine compounds such complexes of proteins or tannin-polysaccharides [2,9-13]. These interactions and associations modify the average size of these compounds and no data concerning these latter is available in the literature.
It should be noted, however, that grape phenolic compounds besides their antioxidant properties are very important constituents of wines since they contribute to color, astringency and bitterness, oxidation reactions, interactions with proteins and ageing behaviour of wines [2,10,12,14].
13
Figure I.2: Summary of wine’s phenolic compounds.
2.1.2. Polysaccharides
Polysaccharides constitute one of the main groups of macromolecules found in wine and contribute to increase its viscosity and the stability of the colloidal system [2,9]. Their presence in wines is due to the contribution of the cell walls of either micro-organisms during alcoholic fermentation or grape berries after hydrolysis of pectic chains by pectolytic enzymes during grape maturation or during winemaking [9,15-18]. The polysaccharides may be divided into 3 groups depending on their origin (figure I.3):
Grape polysaccharides: they include pectins, which are chains formed almost exclusively of galacturonic acid (homogalacturonane), and pectic substances such as arabinanes, arabinogalactanes, arabinogalactan-proteins (AGP) and rhamnogalacturonans (RG-I, RG-II) with a molecular weight ranging between 40 and 250 kDa [15-18]; Pectins are rarely found in wines because of the activity of endogenous or commercial enzymes.
Yeast polysaccharides: their concentration increase during fermentation due to the lysis of yeast cell. This group is represented by mannoproteins (10-450 kDa) and less
14
by mannanes [19-20]. Nowadays, mannoproteins can be added to the wine at doses ranging from 15 g/hl to 25 g/hl in order to inhibit potassium bitartrate precipitation. The added mannoproteins are highly glycosylated with molecular masses ranging between 30 and 40 kDa [21];
Fungi polysaccharides: the best-known molecule of this group is beta-glucane deriving from Botrytis cinerea and accidentally from Pediococcus. This molecule has a molecular weight of 1 000 kDa, and is known to be a possible cause of problems in the filtration of wine [9].
Figure I.3: Main wine polysaccharides classified according to their origin.
2.1.3. Proteins
Together with amino acids and peptides, proteins constitute the main components of nitrogenous fraction of musts and wines [22,23]. In this group, proteins will be only presented due to their negative effect on wine filtration. In the literature, some studies show that wine proteins are a mixture of grape proteins and proteins from autolyzed yeast [22]. Others refer that these macromolecules come only from grapes [24]. Red wines hardly contain any free proteins, as they are precipitated by tannins. White and rosé wines, on the other hand, may have variable protein concentrations of up to a few hundred (10-500) mg/l, mainly originating
15
from grapes [2]. Some of these proteins have been identified. They are pathogenesis-related proteins involved in the defense mechanism of plants against fungal attacks [22,24]. Among these proteins, the most abundant are chitinases and thaumatin-like proteins with low molecular masses ranging between 20 and 30 kDa. Instability of proteins in white wines is one of the most common non-microbial defects of commercial wines [21]. Denaturation of proteins in white wines may result from unfavorable storage conditions, leading to their aggregation [22]. The denatured protein can subsequently precipitate to form an amorphous sediment or deposit or flocculate and thus produce a suspended and unattractive haze in the bottled wine that reduces its commercial value, making it unacceptable for sale [22-25].
2.2. Wine particles
Suspended particles in wine play a major role in winemaking and especially in wine clarification. This group includes microorganisms (yeast and bacteria chains), cell debris, colloidal aggregates and tartrate crystals. They are retained by the filters but may be found accidentally in the final wine.
2.2.1. Yeasts
Yeasts are unicellular eukaryotic micro-organisms with an ovoid form and size range between 2 and 10 µm. They carry out the alcoholic fermentation which is the anaerobic transformation of must sugars into alcohol. 16 yeast genera are associated with winemaking. Saccharomyces cerevisiae is the predominant yeast in winemaking [26]. Other yeasts, such as species of Brettanomyces, Kluyveromyces, Schizosaccharomyces, Torulaspora, Zygosaccharomyces and Saccharomycodes, may be present during the fermentation or ageing of the wine [26-28]. Wine alcoholic fermentations can be divided into two types: uninoculated (spontaneous or natural fermentations) with unpredictable results and directly inoculated by adding a selected yeast strain. At the beginning of vinification, the yeast population is 105 – 106 yeasts per
milliliter of must to reach 107 – 108 yeasts per milliliter during alcoholic fermentation [25,
26]. A few weeks after the completion of fermentation, the yeast viable population is less than a few hundred cells per ml. Because of their size, yeasts settle easily and are partially removed by settling and racking operations.
2.2.2. Bacteria
Few species of bacteria are able to grow in wines. This is due to acidic pH (3.0 – 3.8) and ethanol concentration of these wines. Two distinct types of bacteria may play an important
16
role on the final quality of wines. These bacteria are lactic acid bacteria and acetic acid bacteria [25,26].
Lactic acid bacteria belong to the group of Gram-positive microorganisms. They are small cells (size between 0.5 and 1 micron) round shaped or slightly elongated forming pairs or chains. At the beginning of the alcoholic fermentation, there are 103 to 104 bacteria per ml. After the end of the alcoholic fermentation, the number of bacteria may reach 106-108 bacteria
per ml and perform the so-called malolactic fermentation [26]. This latter is the transformation of malic acid into lactic acid leading to a slight deacidification and a possible improvement of the organoleptic quality of wine [9,26]. The main specie of lactic acid bacteria in wine, responsible for carrying out the malolactic fermentation, is Oenococcus oeni. The presence or growth of acetic acid bacteria (Gram-negative) is undesirable since it has generally been related to wine spoilage, mostly by increasing the acetic acid and thus, the volatile acidity. The main specie found in wines is Acetobacter and it may reach 108
bacteria
per ml in contaminated wines.
2.2.3. Tartrate crystals
Tartaric acid and its salts (potassium bitartrate and calcium tartrate) are normal constituents of musts and wines. Musts are usually saturated with potassium bitartrate. The formation of alcohol during fermentation acts to decrease the solubility of potassium bitartrate and calcium tartrate, thus, producing a supersaturated solution in the wine [2]. This may result in crystallization of tartrate salts when the wine is bottled and stored at low temperatures [9,21]. Such crystallization is considered undesirable and generally do not meet with consumer acceptance. Consequently, winemakers employ various treatment methods before bottling a wine to prevent this problem. The most extensively used methods are cold stabilization, ion-exchange process and electro-dialysis.
2.2.4. Colloidal aggregates
Colloidal aggregates are the result of the agglomeration of the macromolecules of wines. This resulted in instability and it is responsible for most physico-chemical disorders and deposits in wines. Phenolic compounds, polysaccharides and proteins are the main constituents of these macromolecules as well as traces of many other compounds. The exact composition of these
17
aggregates, the mechanisms involved and the parameters influencing the aggregations are not completely known yet and lack much information about this topic.
3. CFMF principle and its applications in oenology
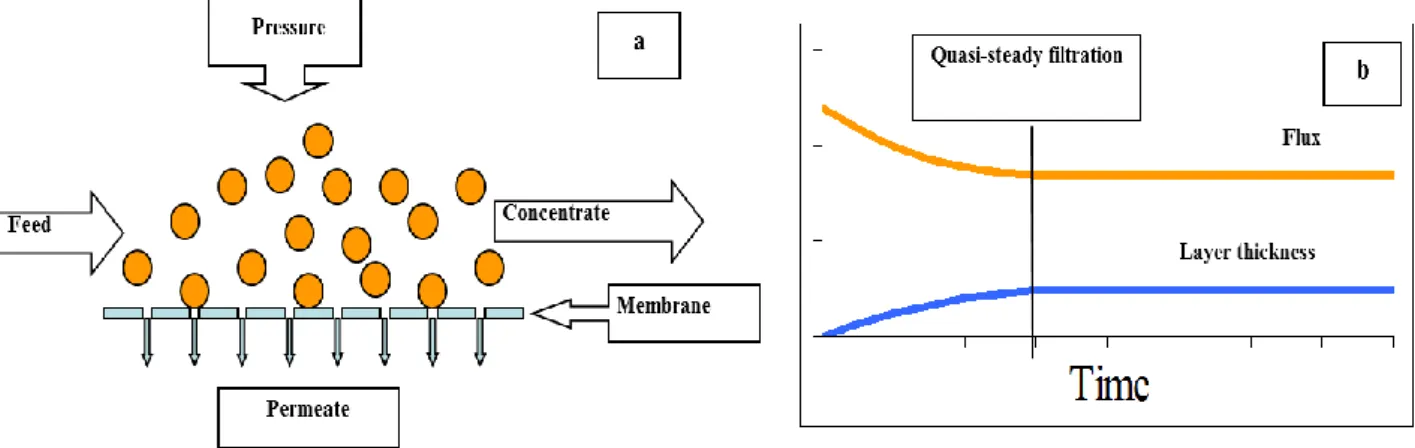
In CFMF, the fluid to be filtered flows parallel to the membrane surface and permeates through the membrane by mean of a pressure drop. The shear exerted by the feed solution flowing parallel to the membrane surface can sweep the deposited particles towards the concentrate or retentate side so that the cake layer remains relatively thin (figure I.4-a). In the case of CFMF, a cake layer will be built up gradually. After some time, a quasi-steady state is reached and a quasi-steady filtrate flow is obtained for a long time as shown in figure I.4-b. This fact is due to the equilibrium between the transport of particles to the cake layer and the back transport of particles into the feed stream.
Figure I.4: a) Principle of cross-flow microfiltration; b) Representation of the quasi-steady filtrate flow.
The liquid amount that passes through the membrane is called permeate while the retained molecules and solvent constitute the retentate which is concentrated progressively during filtration cycles (figure I.4-a). Today this operation mode is a standard operation in many food
industries (milk, cheese, wine, vinegar, beer, juice, vegetable oils, etc)[29]. The permeate flux is governed by the so-called general filtration equation (Darcy’s law) given
as: h R P J .
where J (m3/m²/s) is the permeate flux, ΔP (Pa) the applied pressure, ΔП the
osmotic pressure, µ (Pa.s) the solvent viscosity and Rh (m-1) the hydraulic resistance. In wine
18
and particles while the solutes and salts pass through the membrane. Therefore, ΔП could be considered as negligible (Annexe 1) in this case and Darcy’s law could be given as:
h R P J .
3.1. Wine final filtration
In order to have a limpid wine before bottling, the wine makers implement successive solid-liquid separations using traditional technologies such as centrifugation, filtration on sheets, diatomaceous earth filtration and the use of exogenic additives. Diatomaceous earth filtration is the most used technique to clarify wines. Nowadays, diatomaceous earth is classified as dangerous substances due to the presence of crystalline silica. Massive exposure may cause eye and airways irritations [30]. Diatomaceous earth has also a negative impact on environment. After uses, it cannot be disposed but it must be transported to waste disposal sites to be treated. So, restrictions for environment and health force the oenology sector to search for alternative techniques to traditional filtrations, and cross-flow microfiltration could represent this alternative. Indeed, this technology can substitute in a one step procedure to the conventional processes which imply several filtration steps on diatomaceous earth previous to the final microbial stabilization obtained by dead end filtration on membranes. In addition to a great simplification of the wine processing line, cross-flow microfiltration offers a number of additional advantages such as elimination of earth use and its associated environmental problems as well as the combination of clarification, stabilization and sterile filtration in one single continuous operation.
Besides the technological advantages of cross-flow filtration in winemaking, there are also some economic and operational benefits to consider:
Elimination of labor costs and saving time (cross-flow filters are highly automated);
Elimination of sheets and kieselgur which reduces purchasing and storage costs, improve hygiene and work safety and reduce wastes;
Reduction of wine loss and energy costs by substitution of several treatments in a single operation;
Reduction/elimination of clarifying agents;
19
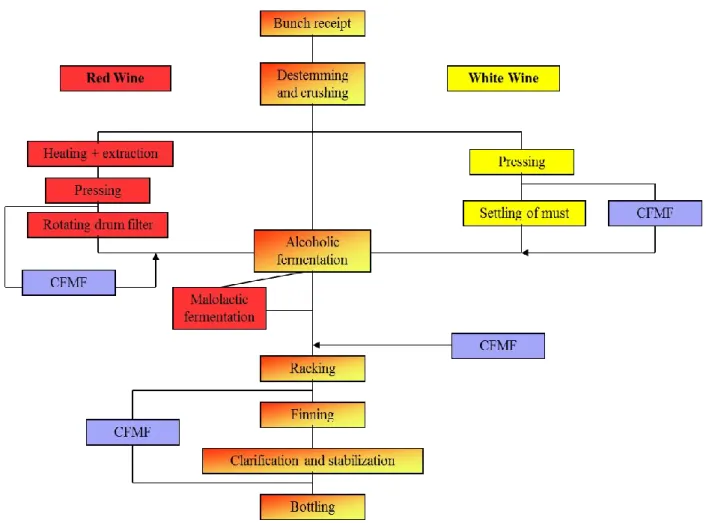
Figure I.5: The processes of red and white wines making and the uses of CFMF as alternative technique.
3.2. Other applications
CFMF, even though it is used as final filtration before bottling, also allows to carry out other processes needed in wine making without compromising the organoleptic wine features. Figure I.5 illustrates the location of CFMF in the scheme of winemaking as an alternative technique for conventional processes. It may be used in white wine making to replace the step of settling of must which consists in separation of suspended materials by decantation but several developments are needed to achieve this purpose. Also, it avoids excessive sulfur dioxide utilization to inactivate wild micro-organisms inside fresh musts in order to carry out a controlled fermentation with selected yeast [31]. It can be used in the red winemaking to substitute the rotating drum filter in order to decrease the turbidity of the red must [32]. CFMF allows also the elimination of suspended material (colloid, particles and micro-organisms) during or after the fining phase. It may be used in sweet wines making to stop alcoholic fermentation without using excessive amount of sulfur dioxide.
20
Note that, the clarification of musts is a quite different problem and remains a challenge in oenology, especially after flash-release, because it is not yet adapted to the industrial scale. Even, the pore sizes used for must clarification should not be the same used for wine clarification before bottling. Indeed, membranes with pore size 0.2 µm decrease hugely the turbidity (< 2 NTU) of the must while conventionally the turbidity of the must should range between 50 and 150 NTU. In other hand, membranes will be quickly and completely fouled while filtering musts because these latter are highly loaded with particles and their turbidity may exceed 2000 NTU.
4. CFMF fouling mechanisms in oenology
Conventionally, the development of cross-flow microfiltration in oenology sector has long been hampered by significant fouling of the membrane despite definite advantages of membrane usage. The consequence of this is a reduction in permeation rates, affecting the economic viability of the process, and a risk of excessive retention of some components, which may affect the product quality.
Figure I.6 shows a curve of typical flux decline in time during wine CFMF process. This typical curve can be divided into three parts. First part (I) is characterized by a rapid initial drop from the flux of pure water filtration. It is followed by a long term gradual flux decrease in part II and ended with a steady-state flux in the third part (III) [33].
Figure I.6: A schematic presentation of red wine filtration at 800 mbar with multichannel
21
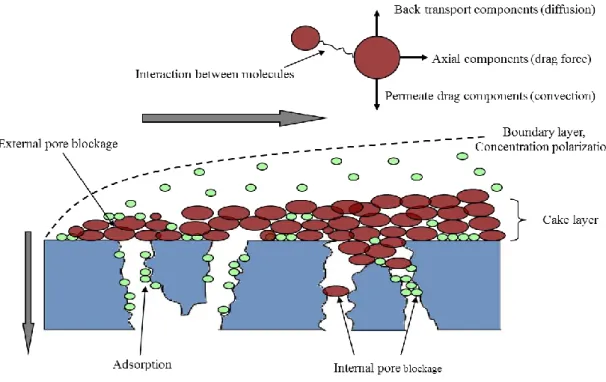
For biological fluids such as wine, membrane fouling can be attributed to three different mechanisms [33-39] illustrated in figure I.7: i) concentration polarization and subsequent cake layer formation, ii) adsorption of solutes on to the membrane surface and pore walls and iii) blockage of pores.
Membrane fouling could be divided according to its localization relative to the membrane structure [40,41]:
Internal fouling is caused by the adsorption and deposition of small particles and macromolecules within the internal structure of the pores;
External fouling is caused by the deposition of large macromolecules and particles on the top surface of the membrane.
In microfiltration of complex fluids as wine, the model of concentration polarization is no longer applicable because the fluid contains macromolecules and particles which have low diffusion coefficient [40]. Therefore, back diffusion of components from the membrane surface into the bulk solution is slow and cannot counterbalance the convective mass transport towards the membrane. This results in the precipitation of the feed solution components at the membrane surface and the formation of a deposit layer on the membrane surface, which adds an additional hydrodynamic resistance to the membrane flux.
22
When the concentration of molecules at the surface increases, the molecules reaches its solubility limit and precipitates on the membrane surface to form solid gel [35,36]. In the field of oenology, the solid gel is well known and identified while filtering wines containing high quantities of pectic substances and where no pectolytic enzyme were added to these wines. The cake layer formation mechanism was also identified during CFMF of wines [42-45]. The retained particles (yeast, bacteria, colloid aggregates, etc) accumulated on the membrane surface in a growing cake layer.
Pore blocking is one of the most frequently used mechanisms in explaining flux decline in membrane filtration. This mechanism was identified during CFMF of red wines and model wine-like solutions of polysaccharides and polyphenols through scanning electron microscopy observation of membrane surfaces [46].
Membrane fouling may be induced also by the adsorption of wine macromolecules and colloids to the membrane surface or within the membrane pores. This mechanism was reported by several studies during CFMF of wines or synthetic solutions imitating wine composition [43,44,46-49]. The implication of wine components in adsorption mechanism will be developed gradually latter in this review. Adsorption mechanism involves several forces which are:
Short range forces: hydrophobic interactions, chemical bonds, dipole-dipole interactions, dipole induced dipole interactions, ion-dipole interactions and H-bridges;
Long range forces: London van der Waals forces, electric double layer attraction/repulsive forces, steric repulsion forces and bridging.
Bacchin et al. [50] displayed in an operating diagram (figure I.8) the links between the driving force (transmembrane pressure), the colloid size and the fouling mechanisms. If the driven force is high enough, it can give rise to an irreversible fouling (gel formation and deposit). They concluded that the transition between reversible and irreversible fouling and its effect on flux is increasingly sharper as the colloid size increases.
23
Figure I.8: The effects of the driving force (transmembrane pressure) and the colloid size on the fouling mechanisms [50].
4.1. Mathematical description of fouling
Modeling the flux during filtration provides better identification of membrane fouling. It provides also predictive tools for successful scale up or scale down of microfiltration systems. Many empirical and theoretical models have been proposed to describe the membrane fouling phenomena. Four filtration models or blocking laws, originally developed for dead-end filtration, have been proposed to describe the initial flux decline: standard blocking model, intermediate blocking model, complete blocking model and cake filtration model [51,52]. For tangential mode, theoretical research has focused on various mechanisms by which the tangential shear stops the cake growth, leading to different models (Brownian diffusion, inertial migration, shear-induced diffusion, and surface transport models) for predicting the permeate flux [36,40]. Resistance-in-series model is the simplest and the most applied for wine filtration [44-46,48,53-56]. The Darcy law, which can be used to estimate the flux decline of CFMF, is the earliest form of a resistance-in-series model,
t R P J . where Rt is
the total resistance including the intrinsic membrane resistance (Rm) and the resistance caused
by fouling (Rf). According to this model, the flux is inversely proportional to the total
resistance, the latter being the sum of individual resistances. Later, it was modified and developed by many researchers, and many different models were obtained. The more used models classified fouling resistance into reversible resistance and irreversible resistance and it is calculated as: Rt = Rm + Rrev + Rirrev where Rt is total resistance, Rm is membrane resistance,
![Figure I.9: Schematic representation of the filtration protocol used to determine resistances-in- resistances-in-series adapted to wine filtration from [57]](https://thumb-eu.123doks.com/thumbv2/123doknet/3665724.108431/44.892.173.723.348.697/schematic-representation-filtration-protocol-determine-resistances-resistances-filtration.webp)
![Figure I.12: Proposed mechanisms for microfiltration membrane fouling by colloids with and without particles [75]](https://thumb-eu.123doks.com/thumbv2/123doknet/3665724.108431/52.892.121.733.864.1050/figure-proposed-mechanisms-microfiltration-membrane-fouling-colloids-particles.webp)
![Table I.4: Variation of dynamic viscosity of 3 different wines with temperature [84]](https://thumb-eu.123doks.com/thumbv2/123doknet/3665724.108431/56.892.154.740.923.1118/table-i-variation-dynamic-viscosity-different-wines-temperature.webp)
![Figure II.7: L’évolution du flux de perméation en fonction de la pression transmembranaire, technique de SWB [4]](https://thumb-eu.123doks.com/thumbv2/123doknet/3665724.108431/86.892.266.620.724.1052/figure-évolution-flux-perméation-fonction-pression-transmembranaire-technique.webp)