HAL Id: hal-00997764
https://hal.archives-ouvertes.fr/hal-00997764
Submitted on 28 May 2014
HAL is a multi-disciplinary open access archive for the deposit and dissemination of sci-entific research documents, whether they are pub-lished or not. The documents may come from teaching and research institutions in France or abroad, or from public or private research centers.
L’archive ouverte pluridisciplinaire HAL, est destinée au dépôt et à la diffusion de documents scientifiques de niveau recherche, publiés ou non, émanant des établissements d’enseignement et de recherche français ou étrangers, des laboratoires publics ou privés.
X-ray photoelectron spectroscopic study of
non-stoichiometric nickel and nickel-copper spinel
manganites
C. Drouet, C. Laberty, J.L.G. Fierro, Pierre Alphonse, Abel Rousset
To cite this version:
C. Drouet, C. Laberty, J.L.G. Fierro, Pierre Alphonse, Abel Rousset. X-ray photoelectron spectro-scopic study of non-stoichiometric nickel and nickel-copper spinel manganites. International Journal of Inorganic Materials, Elsevier, 2000, vol. 2, pp. 419-426. �10.1016/S1466-6049(00)00047-7�. �hal-00997764�
To cite this article :
Drouet, C. and Laberty, C. and Fierro, J.L.G.
and Alphonse, Pierre and Rousset, Abel X-ray photoelectron
spectroscopic study of non-stoichiometric nickel and nickel-copper
spinel manganites.
(2000) International Journal of Inorganic
Materials, vol. 2 (n°5). pp. 419-426. ISSN 1466-6049
O
pen
A
rchive
T
OULOUSE
A
rchive
O
uverte (
OATAO
)
OATAO is an open access repository that collects the work of Toulouse researchers and
makes it freely available over the web where possible.
This is an author-deposited version published in :
http://oatao.univ-toulouse.fr/
Eprints ID :
11650
To link to this article
:
DOI: 10.1016/S1466-6049(00)00047-7
http://dx.doi.org/10.1016/S1466-6049(00)00047-7
Any correspondance concerning this service should be sent to the repository
administrator:
[email protected]
X-ray photoelectron spectroscopic study of non-stoichiometric nickel
and nickel–copper spinel manganites
a a b a ,
*
aC. Drouet , C. Laberty , J.L.G. Fierro , P. Alphonse
, A. Rousset
aLaboratoire de Chimie des Materiaux Inorganiques et Energetiques´ ´ ´
,Universite Paul Sabatier, 118Route de Narbonne, 31062Toulouse Cedex04, France
bInstituto de Catalisis y Petroleoquımica´ ´
,Cantoblanco, 28049Madrid,Spain
Abstract
The surface of non-stoichiometric nickel and nickel–copper spinel manganites has been investigated by X-ray Photoelectron Spectroscopy (XPS). The oxidation states of the nickel, copper and manganese cations present on the surface of the samples were
21 1
determined from the analysis of the M 2p3 / 2 core levels (M5Ni, Cu, Mn). In particular, both Cu and Cu were evidenced in the structure whereas only bivalent nickel was observed. The partial substitution of manganese by copper led to a chemical shift towards
21
lower binding energy in the Ni 2p3 / 2 region, which was explained by the displacement of some Ni cations from tetrahedral to octahedral sites of the spinel structure. Finally, the surface atomic ratios Ni / Mn for nickel manganites, Ni /(Mn1Cu) and Cu /(Mn1Ni) for nickel–copper manganites, determined from XPS data, were compared to the ratios corresponding to the bulk composition. This study shows in all cases a nickel enrichment at the surface which is not affected by the copper content of the oxide. On the contrary, the ratio Cu/(Mn1Ni)! was! found! to! be! lower! than! the! corresponding! bulk! value.
Keywords: A. oxides; A. surfaces; C. photoelectron spectroscopy; D. electronic structure
1. Introduction Photoelectron Spectroscopy (XPS) which provides power-ful and direct analysis of the surface. From the XPS
Many studies have been conducted on the surface results, surface atomic ratios were determined and
com-chemistry and characterization of nickel and nickel–copper pared to bulk ratios to study possible surface deviations
manganites. However, a controversy remains concerning from stoichiometry.
the oxidation states of the cations and their distribution among the tetrahedral and octahedral sites of the spinel
structure. A typical example of discordance concerns the 2. Experimental
31
presence of Ni cations in these samples [1–3].
Recent catalytic experiments [4] have shown the im- 2.1.
Preparation of the samples
portant activity of these non-stoichiometric oxides towards
CO oxidation and NO reduction. Hence, the knowledge of Non-stoichiometric nickel and nickel–copper spinel
the oxidation states of the cations present in these oxides, manganites, corresponding to the general formula
and particularly on their surface, is of great interest for the Ni Cu Mnx y 32x2yh3d / 4O41d (where
y
50 for nickelmanga-understanding of such reactions. nites, and h stands for the cation vacancies) were
syn-The present study aims at determining the oxidation thesized by thermal decomposition of mixed oxalates
states of the nickel, copper and manganese cations present Nix / 3Cuy / 3Mn( 32x2y) / 3C O ,2 4
n
H O at 623 K in air for 6 h2on the surface of non-stoichiometric nickel and nickel– (heating rate: 2 K / min, cooling rate: 5 K / min). These
copper manganites. The technique used was the X-ray oxalate precursors were precipitated at room temperature
by quick introduction of an aqueous solution of nickel, copper and manganese nitrates (0.2 M nitrates) into an
*Corresponding author. Tel.: 285; fax:
temperature under stirring. After 30 min, the precipitate K leads to the corresponding stoichiometric oxides by
was filtered, washed with deionized water and dried at 360 oxygen release, which enables the measure of d. The
K in air. X-ray diffraction only showed pure cubic spinel resulting reduction profiles present several steps,
associ-phases [5]. The nominal composition of the oxides was ated very likely to the reduction of specific cations within
determined by ionic chromatography (Dionex DX100, the structure. In order to determine the oxidation states of
cationic column CS5). The detailed characterization of the metals involved here, the M 2p regions (where M
these oxides is available elsewhere [5]. stands for Ni, Mn or Cu) were analyzed by X-ray
photoelectron spectroscopy (XPS).
2.2.
XPS experiments
Fig. 1 shows the Ni 2p core-level spectra for the nickelmanganite samples Ni Mnx 32xh3d / 4O41d with
x
Ni50.45,X-ray photoelectron spectra were acquired with a VG 0.70, 0.84 and 1.05. For the sake of clarity, only the Ni
ESCALAB 200R spectrometer equipped with a hemis- 2p3 / 2 region is presented as deconvoluted into all its
pherical electron analyzer and Mg Ka (
h
n 51253.6 eV, 1 components. For all these samples, three peaks (referred as219
eV51.6302310 J) 120 W X-ray source. The powder I, II and III in Fig. 1) could be found in the range from 845
samples were heated in the pretreatment chamber of the to 865 eV and their characteristics are given in Table 2.
instrument at 573 K under 500 Torr O (1 Torr5133.3 Pa)2 Peak I, which appears at a binding energy (BE) of 852–
21
for 1 h. The residual pressure in the ion-pumped analysis 853 eV, can be attributed to Ni cations within the spinel
29
chamber was maintained below 5310 Torr during data structure. Indeed, this BE value matches those given in the
acquisition. The intensity of each peak was estimated from literature for nickel-containing compounds [2,6]. Moreover
integration after having smoothed, subtracted an ‘S- peak III, which lies at ca. 7 eV above peak I, is assigned to
21
shaped’ background and fitted the experimental curve to a the well known shake-up satellite line of Ni . On the
combination of Gaussian-Lorentzian lines. The binding contrary, peak II appears at too high BE (ca. 857 eV) to be
21
energies (BE) were referenced to the C 1s peak (atmos- assignable to Ni cations in octahedral or tetrahedral sites
pheric contamination) at 284.6 eV. This reference gives BE values with an accuracy of 60.1 eV.
3. Results and discussion
Non-stoichiometric nickel and nickel–copper spinel manganites are highly divided materials that exhibit large
2
specific areas (Sw.100 m / g). These oxides present a non-stoichiometric level d ranging from 0.2 to 0.7 that depends on the nickel and copper contents as well as on the decomposition temperature of the oxalate precursor [5]. The characteristics (Sw and d ) of the samples studied in this work are reported in Table 1. The non-stoichiometry of these compounds is due to the presence in the spinel structure of cations with higher oxidation states than in stoichiometric counterparts. The presence of cation vac-ancies allows to preserve the overall electrical neutrality of the crystals. Drouet et al. [5] showed using thermal analyses that the heating of such oxides in argon up to 873
Table 1
Specific surface area (Sw) and non-stoichiometry (d ) of the oxides Ni Cu Mnx y 32x2yh3d / 4O41d 2 Oxide composition Sw (m / g) d xNi yCu 0.45 0 165 0.43 0.70 0 180 0.70 0.84 0 250 0.60 1.05 0 250 0.43 0.70 0.65 160 0.27 0.70 0.75 155 0.25
Fig. 1. Ni 2p core-level spectra for Ni Mnx 32xh3d / 4O41d withxNi50.45,
0.70 0.91 140 0.22
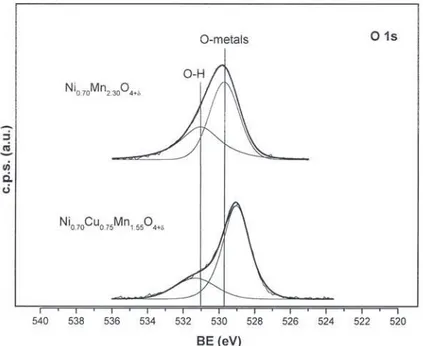
Table 2 from literature results that the main peak at 529.7 eV is
22
XPS characteristics of peaks I, II and III from the Ni 2p3 / 2 region of related to the oxygen anions O bound to the metal nickel manganites Ni 2p3 / 2region of nickel manganites
cations of the structure, while the minor component at 531
Ni 2p3 / 2region eV can be attributed to surface metal hydroxyl groups [6]. x in Ni Mn hNi x 32x 3d / 4O41d Binding energy (eV) The presence of such hydroxide species has already been observed by several authors in the case of oxide samples
Peak I Peak II Peak III
[2,7,8]. These findings tend thus to show that peak II of the
a
1.05 853.1 (6.0) 857.3(5.9) 860.2(7.6)
Ni 2p3 / 2 region can certainly be assigned to nickel
0.84 852.9 (5.8) 857.5(6.6) 860.1(7.3) 31
hydroxide rather than Ni cations. Moreover, such
tri-0.70 852.5 (5.6) 857.3(6.7) 859.5(7.4)
0.45 852.2 (5.8) 857.2(6.5) 858.9(7.5) valent nickel ions are relatively unstable species and would
21
a have certainly been reduced to Ni under ultrahigh
Numbers in parentheses refer to the FWHM in eV.
vacuum.
From the XP spectra of nickel–copper manganites, the
of the spinel structure. This binding energy could rather same conclusions could be drawn concerning the
occur-31
correspond to Ni cations or surface nickel hydroxide rence of three peaks in the Ni 2p3 / 2 region. However, as a
species [2,3,6]. In order to shed some light on this point, general trend, the binding energies of these peaks are
the O 1s region was also investigated. The shape analysis shifted towards lower values when compared to those of
of the corresponding spectra showed the presence of two nickel manganites. Table 3 shows the characteristics of
peaks at 529–530 eV (main component) and ca. 531 eV peaks I, II and III for oxides with constant nickel
com-(minor component). The example of the oxide positionx 50.70 and different copper contents. A chemi-Ni
Ni0.70Mn2.30h0.53O4.70 is reported in Fig. 2. It is obvious cal shift of peaks I and III of ca. 21.5 eV can be observed
Fig. 2. O ls core-level spectra of the O ls region for Ni0.70Mn2.30h0.53O4.70 and Ni0.70Cu0.75Mn1.55h0.19O4.25.
Table 3
XPS characteristics of peaks I, II and III from the Ni 2p3 / 2region of nickel–copper manganites withx 50.70Ni
Ni 2p3 / 2region
y in NiCu 0.70Cu Mny 2.32yh3d / 4O41d Binding energy (eV)
Peak I Peak II Peak III
a 0 852.5 (5.6) 857.3 (6.7) 859.5 (7.4) 0.65 851.2 (6.2) 856.7 (7.2) 858.1 (7.5) 0.75 851.1 (6.6) 857.0 (6.1) 858.1 (6.9) 0.91 851.1 (6.7) 857.1 (7.3) 858.0 (7.0) a
for copper-containing compounds compared to nickel incorporation of copper into the nickel manganite structure
manganites. leads thus to an increasing amount of cations in tetrahedral
21
Several authors have already reported such chemical sublattices, which induces the displacement of some Ni
shifts. Different causes may be at the origin of a decrease cations from tetrahedral to octahedral sites. Such a change
in binding energy and the most currently invoked is a can indeed explain the chemical shift of ca. 21.5 eV
21
reduction of the element. However, the Ni cations could observed in the Ni 2p3 / 2 region between nickel and
not be reduced under the experimental conditions used in nickel–copper manganites. These results remind those of
this study. Moreover, the presence of the satellite line Allen et al. [9] in the case of nickel–iron chromites.
(peak III) with similar intensities in all cases indicates that The analysis of the Cu 2p3 / 2 region for the nickel–
bivalent nickel is still present in the structure. A second copper manganites shows the presence of four peaks in the
possible explanation for this shift could be the weakening range from 925 to 945 eV. Fig. 3 displays the Cu 2p3 / 2
of the Ni–O bonds when copper is incorporated into the core-level spectra for Ni0.70Cu Mny 2.32yh3d / 4O41d with
structure. Indeed, the analysis of the O 1s region corre- y 50.65, 0.75, 0.91. The characteristics of these peaksCu
sponding to a nickel and a nickel–copper manganite with are reported in Table 4. The binding energy found in the
the same nickel content (Fig. 2) shows that there is a slight literature for the main Cu 2p3 / 2 peak of the oxide CuO is
decrease in BE of the corresponding oxygen peak when close to 933.6 eV, whereas its well known shake-up
copper is present in the structure. However, the small shift satellite line generally lies between 940 and 945 eV.
observed in the O 1s region cannot explain totally the However, various studies [14,16,17] showed that the
decrease of ca. 21.5 eV in BE for the Ni 2p3 / 2core level position of these peaks depends on the chemical
com-of copper-containing samples. A third possible cause for position of the sample and particularly on the near
such chemical shifts could be the change of coordination, environment of the copper cations. For example, Brabers
21 21
octahedral (Oh) or tetrahedral (Td), of the Ni cations and Van Setten [19] reported a BE of 932.6 eV for Cu
within the spinel structure. Indeed, several authors have cations in CuMnCoO , that is 1 eV below the value found4
shown that the binding energy obtained for a cation in octahedral sites is generally smaller than in tetrahedral sites [9,10].
Navrostsky and Kleppa [11] have calculated from thermodynamic measurements the site preference energy of several bivalent and trivalent cations within the spinel structure. This study showed in particular the octahedral
31 21 21 31
preference of Mn , Ni and Cu in the order Mn .
21 21
Ni .Cu . It is worthwhile noting that tetravalent
41
manganese cations Mn have also a marked preference
21 1
for octahedral sites. On the contrary, Mn and Cu
present a high tendency for occupying tetrahedral sites. However, in some cases, these energetic considerations have been partly thwarted by experimental results. A
typical example is that of nickel manganite NiMn O2 4
which was shown to exhibit a good electrical conductivity
21 21
whereas its theoretical cation distribution Mn [Ni
41 22
Mn ]O4 would have led to an insulator. In this case, the
measured conductivity can only be explained by the
21
presence of part of the Ni cations in tetrahedral sites.
21
This implies the following cationic distribution: Nil
21 21 31 41 22
Mn12l[Ni12l Mn2l Mn12l]O4 which can explain the
31 41
hopping of electrons between Mn and Mn cations
21
located in octahedral sites. The presence of Ni cations in
tetrahedral sites is now well-adopted in nickel manganites with high nickel contents [3,12,13]. Another controversial
21
point concerns the presence of Cu cations exclusively in
octahedral sites. Several studies [13–17] have indeed pointed out the presence of part of the bivalent copper in a tetrahedral environment. In the case of copper-containing spinels, most authors agree with the presence of
mono-valent copper in tetrahedral sites and bimono-valent copper in Fig. 3. Cu 2p core-level spectra for Ni0.70Cu Mn .y 2 32yh3d / 4O41d with y 50.65, 0.75 and 0.91.
Table 4
XPS data of the Cu 2p3 / 2region of nickel–copper manganites withx 50.70Ni
Cu 2p3 / 2region
y in NiCu 0.70Cu Mny 2.32yh3d / 4O41d Binding energy (eV)
1 21 21 1 b 21 c
Cu Cu Cu hydroxide Cu sat. I(Cu ) I(Cu )
a
0.65 929.3 (4.7) 931.4 (3.9) 938.0 (4.9) 940.6 (4.2) 28% 50%
0.75 928.1 (4.1) 930.7 (3.9) 936.8 (4.0) 939.3 (4.1) 27% 52%
0.91 929.0 (4.0) 931.0 (3.8) 937.4 (4.3) 939.9 (4.2) 22% 58%
a
Numbers in parentheses refer to the FWHM in eV.
b 1
Intensity of the Cu peak in% of the total Cu 2p3 / 2area.
c 21
Total intensity of the Cu peaks (main peak and sat.) in% of the total Cu 2p3 / 2 area.
for CuO. In our case, the main peak of the Cu 2p3 / 2region point out the presence of both monovalent and bivalent
is located at ca. 931 eV, which is close to Brabers and Van copper in the Ni–Cu–Mn–O system.
Setten’s results. Therefore, this peak can be attributed to The peak at ca. 936.5–938 eV in the Cu 2p3 / 2 region is
bivalent copper ions within the spinel structure. Moreover, more difficult to attribute. Indeed, there are no data
the peak observed at ca. 940 eV corresponds to the position reported in the literature that fits these results for copper
21
of the satellite line of Cu found in the literature [6,19] cations within the spinel structure. Hence, this peak is
and remains closely linked to the position of the main peak related to a different coordination environment of the
(at 8–9 eV above the main peak). The high intensity of this copper. The XPS peak analysis of the Ni 2p and O 1s core
satellite peak is an additional element in favor with the
21
assignment of the main peak (at ca. 931 eV) to Cu .
Previous studies [14–17] have shown that it was pos-sible in some cases to distinguish between octahedrally and tetrahedrally coordinated cations. Although the presence of
1
Cu cations in octahedral sites is still a matter of
con-troversy, most authors agree that the order of binding
1
energies in the Cu 2p3 / 2 region is as follows: Cu (Oh),
1 21 21
Cu (Td),Cu (Oh),Cu (Td). However, in the present
case, such a distinction between octahedrally and
tetra-21
hedrally coordinated Cu cations was not possible.
There-21
fore, the main peak at ca. 931 eV may include Cu located in both Oh and Td sites. Brabers and Van Setten
[19] have attributed a peak at 930.5 eV in the Cu 2p3 / 2
1
region to tetrahedrally coordinated Cu cations in
CuMnCoO . This value is close to that of the peak4
observed at 928–929.5 eV in this study. However, metallic
0 1
copper Cu corresponds to similar BE values as Cu [6]
and it is generally not possible to distinguish between these oxidation states only from XPS analysis of the Cu 2p
region. To achieve this goal, the Cu L M M3 45 45 Auger
electron transition was recorded (Fig. 4) and the modified Auger parameter a 9 was determined by the formula a 95
hn 1(KE CuLMM– KE Cu 2p3 / 2), wherehn is the energy
of the incident photon, and KE CuLMM and KE Cu2p3 / 2
are the kinetic energies corresponding to the Cu L M M3 45 45
and Cu 2p3 / 2 core-levels, respectively. The modified
Auger parameter found for all the oxides was a 9(1846.6– 1848.1 eV. On the other hand, the parameter corresponding
0
to Cu is generally considered to be close to 1851 eV
1
whereas that of Cu is much smaller: 1848–1849 eV
[6,20]. This last value matches our experimental results. Therefore, the peak at 928–929.5 eV can be attributed to
1
Cu cations and not to metallic copper atoms. These Fig. 4. Cu L M M3 45 45 Auger transition for Ni0.70Cu Mny 2.32yh3d / 4O41d
spinel structure, i.e. taking into account the main peak as well as its satellite line, displays the opposite behavior. The increase in copper content of the oxides favors thus
1
bivalent copper rather than monovalent Cu cations.
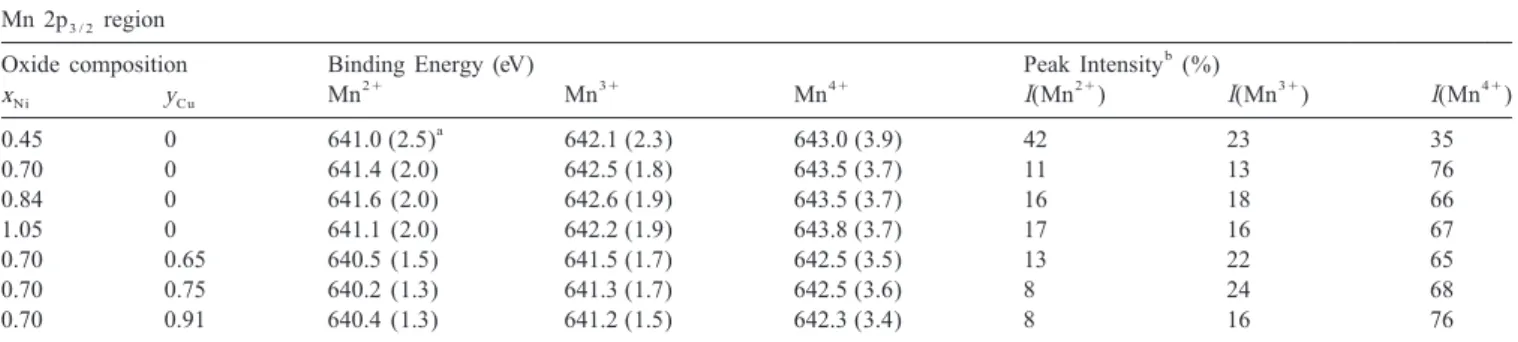
Many papers have reported XPS data of manganese-containing compounds. These studies have shown that it was generally possible to distinguish between the different oxidation states of manganese from the analysis of the Mn 2p or Mn 3p regions [1,3,21,22]. In particular, Hashemi and Brinkman [1] have attributed a peak at 640.3 eV in the
21
Mn 2p3 / 2 region to Mn cations in NiMn O , whereas2 4
peaks at 641.2 eV and 642.0 eV were assigned respectively
31 41
to Mn and Mn . In our study, the Mn 2p3 / 2region for
nickel and nickel–copper manganites could be deconvo-luted into three peaks at 640.2–641.6 eV, 641.2–642.6 eV and 642.3–643.8 eV (Fig. 5). The characteristics of these peaks for all the compounds studied in this work are listed in Table 5. According to the literature data, the three peaks
21 31 41
were attributed respectively to Mn , Mn and Mn
cations within the spinel structure (satellite lines of man-ganese appear at much higher binding energies [1,14]). These assignments are consistent with the cation dis-tributions found in the literature showing the coexistence of the three oxidation states of the manganese [1,3,21,22]. A slight decrease in binding energy can be observed in the
Mn 2p3 / 2region (Fig. 5) for Ni–Cu compounds compared
to nickel manganites. This small shift is close to that observed in the O 1s region and might be assigned to a slight weakening of the Mn–O bonds in the presence of copper.
Fig. 5. Mn2p3 / 2 core-level spectra for Ni0.70Cu Mny 2.32yh3d / 4O41d with Table 5 also reports the proportions of the three oxida-y 50, 0.65, 0.75 and 0.91.Cu
tion states of the manganese as determined from the Mn
2p core level analysis. Except for the oxide
levels showed the presence of hydroxide species on the 3 / 2
21
Ni Mn h O , the percentages of Mn and
surface of such oxides. Hence, the peak observed at 936.5– 0.45 2.55 0.32 4.43
31
938 eV in the Cu 2p3 / 2 region of these oxides may be Mn in the spinel structure are in the range 8–24%, while
41
related to surface copper hydroxide. that of Mn is close to 70%. Such proportions of
Table 4 shows that the relative intensity of the peak tetravalent manganese match those expected in the case of
located at 928–929.5 eV in the Cu 2p3 / 2 region, attributed non-stoichiometric compounds. This shows that the
sam-to monovalent copper, tends sam-to decrease when the nominal ples have not been notably reduced during the XPS
copper content of the oxide increases. On the contrary, the experiments. The particular behavior of the oxide
21
total intensity of the peaks relative to Cu cations in the Ni0.45Mn2.55h0.32O4.43can be explained by the absence of
Table 5
XPS data of the Mn 2p3 / 2 region for nickel and nickel–copper manganites (withx 50.70)Ni
Mn 2p3 / 2 region
b
Oxide composition Binding Energy (eV) Peak Intensity (%)
21 31 41 21 31 41
xNi yCu Mn Mn Mn I(Mn ) I(Mn ) I(Mn )
a 0.45 0 641.0 (2.5) 642.1 (2.3) 643.0 (3.9) 42 23 35 0.70 0 641.4 (2.0) 642.5 (1.8) 643.5 (3.7) 11 13 76 0.84 0 641.6 (2.0) 642.6 (1.9) 643.5 (3.7) 16 18 66 1.05 0 641.1 (2.0) 642.2 (1.9) 643.8 (3.7) 17 16 67 0.70 0.65 640.5 (1.5) 641.5 (1.7) 642.5 (3.5) 13 22 65 0.70 0.75 640.2 (1.3) 641.3 (1.7) 642.5 (3.6) 8 24 68 0.70 0.91 640.4 (1.3) 641.2 (1.5) 642.3 (3.4) 8 16 76 a
Numbers in parentheses refer to the FWHM in eV.
b
Fig. 6. Comparison of the surface (XPS) and bulk Ni / Mn atomic ratios Fig. 7. Comparison of the surface (XPS) and bulk CuI(Mn1Ni) atomic for nickel manganites. ratios for nickel–copper manganites.
nickel cations in tetrahedral sites (unlike the other oxides attracts Mn at the surface more than Cu or Co, which
with higher nickel contents), which enables a higher induces a surface enrichment of Mn.
21
amount of Mn in Td sites as can be seen in Table 5. The surface atomic ratio Ni / Mn of nickel manganites
Finally, the comparison of Ni0.70Mn2.3h0.53O4.70 and was determined from XPS data using the sensitivity factors
Ni0.70Cu Mny 2.32yh3d / 4O41d with yCu50.65, 0.75, 0.91 given by Wagner et al. [27]. This ratio was compared to
(Table 5) shows similar proportions respectively for each that corresponding to the bulk composition and the results
oxidation state of the manganese. This shows that copper are reported in Fig. 6. This graph shows the surface
must be present in both Td and Oh sites, which is in enrichment of nickel for all the oxides: the higher the
accordance with the results found in the literature nominal nickel content of the oxide, the more segregated
[13,14,18]. nickel at the surface. Sazonov et al. [28] have shown that
Many XPS studies on mixed metal oxides have shown the surface oxygen binding energies for NiO and MnO2
the segregation or depletion of some elements at the were of a similar order. Therefore the interpretation of
21
surface [9,17,23,24]. Such behaviors come from surface Yang et al. [26] cannot be invoked here. Actually, Ni
relaxation and can generally be explained by energetic and cations have a larger size than manganese cations and the
steric (ionic radius) considerations. Kingery [25] claims size effect described by Kingery [25] may thus explain the
that the dominant factor which determines the segregation surface segregation of nickel.
is the size of the segregating cation (the larger the size, the The surface chemical composition of nickel–copper
stronger the enrichment at the surface). However, ex- manganites has also been investigated in a similar way.
perimental results do not always fit this size effect and Table 6 shows that nickel still segregates at the surface.
other parameters must then be considered as well. For For a given nickel content (x 50.70), the presence ofNi
example, Yang et al. [26] invoked the role of the synthesis copper in the oxides does not seem to influence the amount
atmosphere, and explained the surface segregation of of segregated nickel cations. On the contrary, the surface
41
Mn cations in mixed Mn–Cu–Co oxides calcined in air atomic ratio Cu /(Mn1Ni) for
by the fact that the Mn–O bonds are stronger than Cu–O Ni0.70Cu Mny 2.32yh3d / 4O41d (Fig. 7) is lower than the
and Co–O in the simple oxides MnO , CuO and Co O2 3 4 corresponding bulk ratio. This difference between the two
[26]. According to these authors, the oxidative atmosphere ratios increases with the nominal copper content of the
Table 6
Comparison of the surface (XPS) and bulk Ni /(Mn1Cu) atomic ratios for nickel–copper manganites withx 50.70Ni
y in NiCu 0.70Cu Mny 2.32yh3d / 4O41d Ni /(Mn1Cu)XPS Ni /(Mn1Cu) bulk
0 0.53 0.30
0.65 0.52 0.30
0.75 0.58 0.30
oxide. These results are opposite to those obtained by presence of Ni leading to a penetration of Cu into the bulk
Veprek et al. [23] who showed the surface enrichment of or by the existence of Cu-containing highly-dispersed
copper at the surface of commercial Hopcalite CuMn O .2 4 phases, such as CuO, on the surface of the samples.
However, the presence of nickel could explain the different behavior. Indeed, nickel and copper may compete for a surface exposition. Moreover, Yang et al. [26] have
References
underlined the strong influence of the synthesis conditions of the samples, and particularly the atmosphere, on the
[1] Hashemi T, Brinkman AW. J Mater Res 1992;7–5:1278.
resulting surface segregation. However, Anderson and
[2] Hashemi T. Br Ceram Trans J 1991;90:171.
Fierro [29] have observed a similar copper depletion for
[3] Brabers VAM, Van Setten FM, Knapen PSA. J Sol Stat Chem
LaZr12xCu O perovskites. They attributed this phenom-x 3 1983;49:93.
enon to the existence of highly-dispersed phases containing [4] Drouet C, Alphonse P, Rousset A, to be published.
copper, like CuO. Until now, no experimental results have [5] Drouet C, Alphonse P, Rousset A. Solid State Ionics 1999;123:25. [6] Wagner CD, Riggs WM, Davis LE, Moulder JF, Muilenberg GE,
allowed us to show the existence of such highly-dispersed
Handbook of X-ray photoelectron spectroscopy, Perkin-Elmer,
phases in our samples. However, this eventuality cannot be
Minnesota, USA 1979.
excluded and further surface analyses with other tech- [7] Rojas ML, Fierro JLG. J Sol Stat Chem 1990;89:299.
niques will be necessary to investigate this point. [8] Ertl G, Hierl R, Knozinger H, Thiele N, Urbach HP. Appl Surf Sci¨
1980;5:49.
[9] Allen GC, Harris SJ, Jutson JA, Dyke JM. Appl Surf Sci 1989;37:111.
4. Conclusions
`
[10] Lenglet M, D’Huysser A, Arsene J, Bonnelle JP, Jorgensen CK. J Phys C: Solid State Phys 1986;19:L363.
The surface of non-stoichiometric nickel and nickel– [11] Navrotsky A, Kleppa OJ. J Inorg Nucl Chem 1967;29:2701.
copper manganites has been investigated by XPS. The [12] Lenglet M, D’Huysser A, Bonnelle JP, Durr J, Jorgensen CK. Chem¨
Phys Lett 1987;136–5:478.
analysis of the Ni 2p core level only showed the presence
¨
[13] Topfer J, Feltz A, Dordor P, Doumerc JP. Mat Res Bull 1994;29–
of bivalent nickel. A chemical shift of ca. –1.5 eV in the
3:225.
Ni 2p3 / 2 region was observed between nickel and nickel– [14] Lenglet M, D’Huysser A, Kasperek J, Bonnelle JP, Durr J. Mat Res¨
copper manganites. This was explained by the displace- Bull 1985;20:745.
21
ment of some Ni cations from tetrahedral to octahedral [15] D’Huysser A, Le Calonnec D, Lenglet M, Bonnelle JP, Jorgensen
CK. Mat Res Bull 1984;19:1157.
sites of the spinel structure. The Cu 2p3 / 2 region of
¨
[16] Topfer J, Feltz A. Solid State Ionics 1993;59:249.
nickel–copper manganites was also investigated and the
1 [17] Brabers VAM. Mat Res Bull 1983;18:861.
resulting XP spectra revealed the presence of both Cu
[18] Elbadraoui E, Baudour JL, Bouree F, Gillot B, Fritsch S, Rousset A.
21
and Cu cations. The occurrence of metallic copper Cu8 Solid State Ionics 1997;93:219.
was ruled out by the determination of the modified Auger [19] Brabers VAM, Van Setten F. J Phys D: Appl Phys 1983;16:L169.
parameter. Moreover, the XPS data have shown the [20] Sheffer GR, King TS. J Catal 1989;115:376.
¨ ¨
[21] Topfer J, Feltz A, Graf D, Hackl B, Raupach L, Weissbrodt P. Phys
increase in proportion of bivalent copper compared to
Stat Sol (a) 1992;134:405.
monovalent copper when the nominal copper content of
[22] Martinez Sarrion ML, Morales M. J Am Ceram Soc 1995;78:915.
the oxide increases. The analysis of the Mn 2p3 / 2level of [23] Veprek S, Cocke DL, Kehl S, Oswald HR. J Catal 1986;100:250. the oxides showed the simultaneous presence of the three [24] Laine J, Brito J, Severino F, Castro G, Tacconi P, Yunes S, Cruz J.
21 31 41
oxidation states Mn , Mn and Mn of the manganese Catal Lett 1990;5:45.
[25] Kingery WD. Pure Appl Chem 1984;56:1703.
in all the samples. The surface atomic ratios Ni / Mn and
[26] Yang BL, Chan SF, Chang WS, Chen YZ. J Catal 1991;130:52.
Ni /(Cu1Mn) were determined and compared to the
21 [27] Wagner CD, Davis LE, Zeller MV, Taylor JA, Raymond RH, Gale
corresponding bulk ratios. In all cases Ni surface
LH. Surf Interface Anal 1981;3–5:211.
enrichment was observed. On the contrary, the surface [28] Sazonov BA, Popovskii VV, Boreskov GK. Kin i Katal 1968;9–
ratio Cu /(Mn1Ni) was shown to be lower than that of the 2:312.