HAL Id: hal-00140480
https://hal.archives-ouvertes.fr/hal-00140480
Submitted on 6 Apr 2007
HAL is a multi-disciplinary open access
archive for the deposit and dissemination of
sci-entific research documents, whether they are
pub-lished or not. The documents may come from
teaching and research institutions in France or
abroad, or from public or private research centers.
L’archive ouverte pluridisciplinaire HAL, est
destinée au dépôt et à la diffusion de documents
scientifiques de niveau recherche, publiés ou non,
émanant des établissements d’enseignement et de
recherche français ou étrangers, des laboratoires
publics ou privés.
A Hierarchical Approach for Dependability Analysis of a
Commercial Cache-Based RAID Storage Architecture
Mohamed Kaâniche, Luigi Romano, Zbigniew Kalbarczyk, Ravishankar Iyer,
Rick Karcich
To cite this version:
Mohamed Kaâniche, Luigi Romano, Zbigniew Kalbarczyk, Ravishankar Iyer, Rick Karcich. A
Hierar-chical Approach for Dependability Analysis of a Commercial Cache-Based RAID Storage Architecture.
28th IEEE International Symposium on Fault-Tolerant Computing, Jun 1998, Munich, Germany.
pp.6-15. �hal-00140480�
28th IEEE International Symposium on Fault-Tolerant Computing (FTCS-28), Munich (Allemagne), IEEE Computer Society, Juin 1998, pp.6-15
A Hierarchical Approach for Dependability Analysis
of a Commercial Cache-Based RAID Storage Architecture
M. Kaâniche
1*,
L. Romano
2†, Z. Kalbarczyk
2, R. Iyer
2and R. Karcich
32
Center for Reliable and High-Performance
Computing
University of Illinois at Urbana-Champaign
1308 W. Main St., Urbana, IL 61801, USA
[email protected]; {kalbar, yer}@crhc.uiuc.edu
1
LAAS-CNRS,
7, Av. du Colonel Roche
31077 Toulouse Cedex 4
France
[email protected] 3Storage Technology
2270 S 88th St. MS 2220
Louisville, CO 80028,
USA
[email protected]Abstract
We present a hierarchical simulation approach for the dependability analysis and evaluation of a highly available commercial cache-based RAID storage system. The archi-tecture is complex and includes several layers of overlap-ping error detection and recovery mechanisms. Three ab-straction levels have been developed to model the cache architecture, cache operations, and error detection and recovery mechanism. The impact of faults and errors oc-curring in the cache and in the disks is analyzed at each level of the hierarchy. A simulation submodel is associated with each abstraction level. The models have been devel-oped using DEPEND, a simulation-based environment for system-level dependability analysis, which provides facili-ties to inject faults into a functional behavior model, to simulate error detection and recovery mechanisms, and to evaluate quantitative measures. Several fault models are defined for each submodel to simulate cache component failures, disk failures, transmission errors, and data errors in the cache memory and in the disks. Some of the parame-ters characterizing fault injection in a given submodel cor-respond to probabilities evaluated from the simulation of the lower-level submodel. Based on the proposed method-ology, we evaluate and analyze 1) the system behavior un-der a real workload and high error rate (focusing on error bursts), 2) the coverage of the error detection mechanisms implemented in the system and the error latency distribu-tions, and 3) the accumulation of errors in the cache and in the disks.
1 Introduction
A RAID (Redundant Array of Inexpensive Disks) is a set of disks (and associated controller) that can automati-cally recover data when one or more disks fail [4, 13]. Storage architectures using a large cache and RAID disks
* Was a Visiting Research Assistant Professor at CRHC, on leave from LAAS-CNRS, when this work was performed.
† Was a Visiting Research Scholar at CRHC, on leave from Dipartimento di Informatica e Sistemistica, University of Naples, Italy
are becoming a popular solution for providing high per-formance at low cost without compromising much data re-liability [5, 10]. The analysis of these systems is focused on performance (see e.g., [9, 11]). The cache is assumed to be error free, and only the impact of errors in the disks is investigated. The impact of errors in the cache is addressed (to a limited extent) from a design point of view in [12], where the architecture of a fault-tolerant, cache-based RAID controller is presented. Papers studying the impact of errors in caches can be found in other applications not related to RAID systems (e.g., [3]).
In this paper, unlike previous work, which mainly ex-plored the impact of caching on the performance of disk arrays, we focus on dependability analysis of a cache-based RAID controller. Errors in the cache might have a significant impact on the performance and dependability of the overall system. Therefore, in addition to the fault toler-ance capabilities provided by the disk array, it is necessary to implement error detection and recovery mechanisms in the cache. This prevents error propagation from the cache to the disks and users, and it reduces error latency (i.e., time between the occurrence of an error and its detection or removal). The analysis of the error detection coverage of these mechanisms, and of error latency distributions, early in the design process provides valuable information. System manufacturers can understand, early on, the fault tolerance capabilities of the overall design and the impact of errors on performance and dependability.
In our case study, we employ hierarchical simulation, [6], to model and evaluate the dependability of a commer-cial cache-based RAID architecture. The system is decom-posed into several abstraction levels, and the impact of faults occurring in the cache and the disk array is evaluated at each level of the hierarchy. To analyze the system under realistic operational conditions, we use real input traces to drive the simulation. The system model is based on the specification of the RAID architecture, i.e., we do not evaluate a prototype system. Simulation experiments are conducted using the DEPEND environment [7].
sev-eral layers of overlapping error detection and recovery mechanisms. Our three main objectives are 1) to analyze how the system responds to various fault and error scenar-ios, 2) to analyze error latency distributions taking into ac-count the origin of errors, and 3) to evaluate the coverage of error detection mechanisms. These analyses require a detailed evaluation of the system’s behavior in the pres-ence of faults. In general, two complementary approaches can be used to make these determinations: analytical mod-eling and simulation. Analytical modmod-eling is not appropri-ate here, due to the complexity of the RAID architecture. Hierarchical simulation offers an efficient method to con-duct a detailed analysis and evaluation of error latency and error detection coverage using real workloads and realistic fault scenarios. Moreover, the analysis can be completed within a reasonable simulation time.
To best reproduce the characteristics of the input load, a real trace file, collected in the field, is used to drive the simulation. The input trace exhibits the well-known track skew phenomenon, i.e., a few tracks among the address-able tracks account for most of the I/O requests. Since highly reliable commercial systems commonly tolerate iso-lated errors, our study focuses on the impact of multiple near-coincident errors occurring during a short period of time (error bursts), a phenomenon which has seldom been explored. We show that due to the high frequency of sys-tem operation, a transient fault in a single syssys-tem compo-nent can result in a burst of errors that propagate to other components. In other words, what is seen at a given ab-straction level as a single error becomes a burst of errors at a higher level of abstraction. Also, we analyze how bursts of errors affect the coverage of error detection mechanisms implemented in the cache and how they affect the error la-tency distributions, (taking into account where and when the errors are generated). In particular, we demonstrate that the overlapping of error detection and recovery mecha-nisms provides high error detection coverage for the over-all system, despite the occurrence of long error bursts. Fi-nally, analysis of the evolution of the number of faulty tracks in the cache memory and in the disks shows an in-creasing trend for the disks but an almost constant number for cache memory.
This paper contains five sections. Section 2 describes the system architecture and cache operations, focusing on error detection and recovery mechanisms. Section 3 out-lines the hierarchical modeling approach and describes the hierarchical model developed for the system analyzed in this paper. Section 4 presents the results of the simulation experiments. Section 5 summarizes the main results of the study and concludes the paper.
2 System presentation
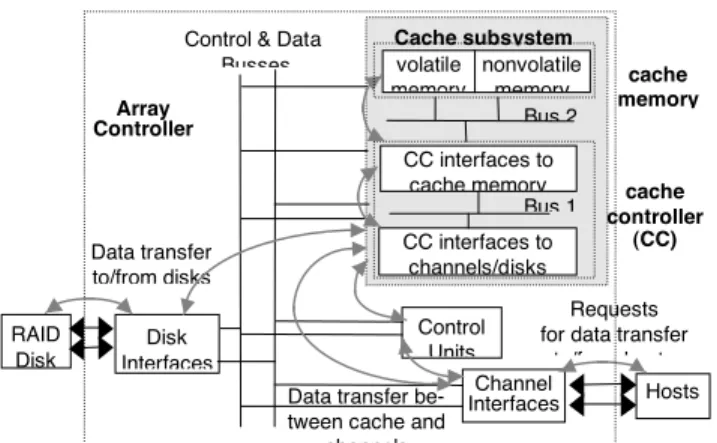
The storage architecture analyzed in this paper (Figure 1) is designed to support a large amount of disk storage and to provide high performance and high availability. The storage system supports a RAID architecture composed of
a set of disk drives storing data, parity, and Reed-Solomon coding information, which are striped across the disks [4]. This architecture tolerates the failure of up to two disks. If a disk fails, the data from the failed disk is reconstructed on-the-fly using the valid disks; the reconstructed data is stored on a hot spare disk without interrupting the service. Data transfer between the hosts and the disks is supervised by the array controller. The array controller is composed of a set of control units. The control units process user re-quests received from the channels and direct these rere-quests to the cache subsystem. Data received from the hosts is as-sembled into tracks in the cache. The number of tracks cor-responding to a single request is application dependent. Data transfers between the channels and the disks are per-formed by the cache subsystem via reliable and high-speed control and data busses. The cache subsystem consists of 1) a cache controller organized into cache controller inter-faces to the channels and the disks and cache controller in-terfaces to the cache memory (these inin-terfaces are made of redundant components to ensure a high level of availabil-ity) and 2) cache volatile and nonvolatile memory. Com-munication between the cache controller interfaces and the cache memory is provided by redundant and multidirec-tional busses (denoted as Bus 1 and Bus 2 in Figure 1). The cache volatile memory is used as a data staging area for read and write operations. The battery-backed nonvola-tile memory is used to protect critical data against failures (e.g., data modified in the cache and not yet modified in the disks, information on the file system that is necessary to map the data processed by the array controller to physi-cal locations on the disks).
2.1
Cache subsystem operations
The cache subsystem is for caching read and write re-quests. A track is always staged in the cache memory as a whole, even in the event of a write request involving only a few blocks of the track. In the following, we describe the main cache operations assuming that the unit of data trans-fer is an entire track.
Read operation. First, the cache controller checks for
Figure 1: Array controller architecture, interfaces and data flow
Cache subsystem cache controller (CC) cache memory Bus 1 Bus 2 Control & Data
Busses
Data transfer be-tween cache and
channels
Requests for data transfer
to/from hosts Data transfer to/from disks Channel Interfaces RAID Disk Disk Interfaces Hosts Control Units CC interfaces to channels/disks CC interfaces to cache memory nonvolatile memory volatile memory Array Controller
the requested track in the cache memory. If the track is al-ready there («cache hit»), it is read from the cache and the data is sent back to the channels. If not («cache miss»), a request is issued to read the track from the disks and swap it to the cache memory. Then, the track is read from the cache.
Write operation. In the case of a cache hit, the track is
modified in the cache and flagged as «dirty.» In the case of a cache miss, a memory is allocated to the track and the track is written into that memory location. Two write strategies can be distinguished: 1) write-through and 2) fast write. In the write-through strategy, the track is first writ-ten to the volatile memory. The write operation completion is signaled to the channels after the track is written to the disks. In the fast-write strategy, the track is written to the volatile memory and to nonvolatile memory. The write op-eration completion is signaled immediately. The modified track is later written to the disks according to a write-back strategy, which consists of transferring the dirty tracks to the disks, either periodically or when the amount of dirty tracks in the cache exceeds a predefined threshold. Finally, when space for a new track is needed in the cache, the track-replacement algorithm based on the Least-Recently-Used (LRU) strategy is applied to swap out a track from the cache memory.
Track transfer inside the cache. The transfer of a track
between the cache memory, the cache controller, and the channel interfaces is composed of several elementary data transfers. The track is broken down into several data blocks to accommodate the parallelism of the different de-vices involved in the transfer. This also makes it possible to overlap several track transfer operations over the data busses inside the cache subsystem. Arbitration algorithms are implemented to synchronize these transfers and avoid bus hogging by a single transfer.
2.2
Error detection mechanisms
The cache is designed to detect errors in the data, ad-dress, and control paths by using, among other techniques, parity, error detection and correction codes (EDAC), and cyclic redundancy checking (CRC). These mechanisms are applied to detect errors in the data path in the following ways:
Parity. Data transfers, over Bus 1 (see Figure 1) are
covered by parity. For each data symbol (i.e., data word) transferred on the bus, parity bits are appended and passed over separate wires. Parity is generated and checked in both directions. It is not stored in the cache memory but is stripped after being checked.
EDAC. Data transfers over Bus 2 and the data stored in
the cache memory are protected by an error detection and correction code. This code is capable of correcting on-the-fly all single and double bit errors per data symbol and de-tecting all triple bit data errors.
CRC. Several kinds of CRC are implemented in the
ar-ray controller. Only two of these are checked or generated
within the cache subsystem: the frontend CRC (FE-CRC) and the physical sector CRC (PS-CRC). FE-CRC is ap-pended, by the channel interfaces, to the data sent to the cache during a write request. It is checked by the cache controller. If FE-CRC is valid, it is stored with the data in the cache memory. Otherwise, the operation is interrupted and a CRC error is recorded. FE-CRC is checked again when a read request is received from the channels. There-fore, extra-detection is provided to recover from errors that may have occurred while the data was in the cache or in the disks, errors that escaped the error detection mecha-nisms implemented in the cache subsystem and the disk ar-ray. PS-CRC is appended by the cache controller to each data block to be stored in a disk sector. The PS-CRC is stored with the data until a read from disk operation oc-curs. At this time, it is checked and stripped before the data is stored in the cache. The same algorithm is implemented to compute FE-CRC and PS-CRC. This algorithm guaran-tees detection of three or fewer data symbols in error in a data record.
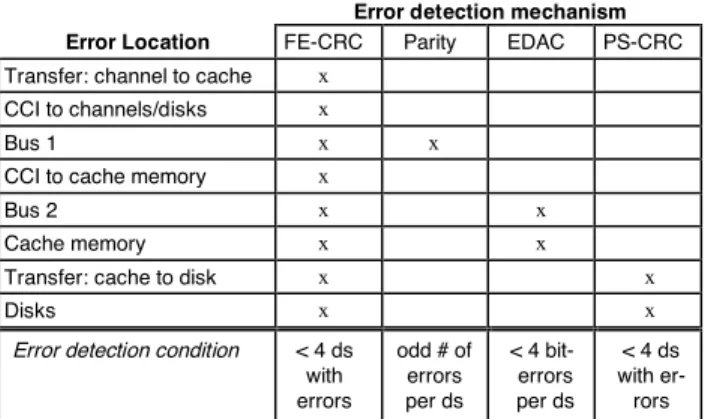
Table 1 summarizes the error detection conditions for each mechanism presented above, taking into account the component in which the errors occur and the number of noncorrected errors occurring between the computation of the code and its being checked. The (x) symbol means that errors affecting the corresponding component can be de-tected by the mechanism indicated in the column. It is noteworthy that the number of check bits and the size of the data symbol (ds) mentioned in the error detection con-dition are different for parity, EDAC, and CRC.
2.3 Error recovery and track reconstruction
Besides EDAC, which is able to automatically correct some errors by hardware, software recovery procedures are invoked when errors are detected by the cache subsystem. Recovery actions mainly consist of retries, memory fenc-ing, and track-reconstruction operations. When errors are detected during a read operation from the cache volatile memory and the error persists after retries, an attempt is made to read the data from nonvolatile memory. If thisop-Error detection mechanism Error Location FE-CRC Parity EDAC PS-CRC Transfer: channel to cache x
CCI to channels/disks x
Bus 1 x x
CCI to cache memory x
Bus 2 x x
Cache memory x x
Transfer: cache to disk x x
Disks x x
Error detection condition < 4 ds
with errors odd # of errors per ds < 4 bit-errors per ds < 4 ds with er-rors
ds= data symbol, CCI = Cache Controller Interface
Table 1. Error detection efficiency with respect to the loca-tion and the number of errors
eration fails, the data is read from the disk array. This op-eration succeeds if the data on the disks is still valid or it can be reconstructed (otherwise it fails). Figure 2 describes a simplified disk array composed of n data disks (D1 to Dn) and two redundancy disks (P and Q). Each row of the redundancy disks is computed based on the corresponding data tracks. For example, the first rows in disks P (P[1;n]) and Q (Q[1;n]) are obtained based on the data tracks T1 to Tn stored in the disks D1 to Dn. This architecture tolerates the loss of two tracks in each row; this condition will be re-ferred to as the track reconstruction condition. The tracks that are lost due to disk failures or corrupted due to bit-errors can be reconstructed using the valid tracks in the row, provided that the track reconstruction condition is sat-isfied; otherwise data is lost. More information about disk reconstruction strategies can be found in [8].
3 Hierarchical modeling methodology
We propose a hierarchical simulation approach to en-able an efficient, detailed dependability analysis of the RAID storage system described in the previous section.
Establishing the proper number of hierarchical levels and their boundaries is not trivial. Several factors must be considered in determining an optimal hierarchical decom-position that provides a significant simulation speed-up with one minimal loss of accuracy: 1) system complexity, 2) the level of detail of the analysis and the dependability measures to be evaluated, and 3) the strength of system component interactions (weak interactions favor hierarchi-cal decomposition).
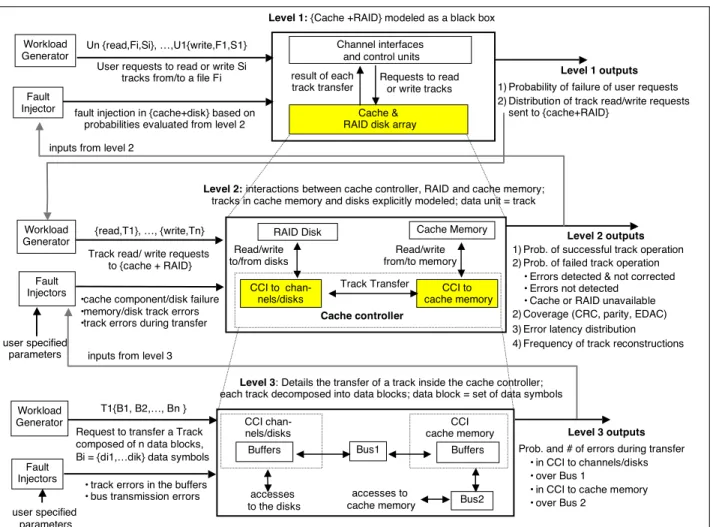
In our study, we define three hierarchical levels (sum-marized in Figure 3) to model the cache-based storage sys-tem. At each level, the behavior of the shaded components is detailed in the lower-level model. Each model is built in a modular fashion and is characterized by:
• the components to be modeled and their behavior, • a workload generator specifying the input distribution, • a fault dictionary specifying the set of faults to be
in-jected in the model, the distribution characterizing the occurrence of faults, and the consequences of the fault with the corresponding probability of occurrence, and • the outputs derived from the submodel simulation.
For each level, the workload can be a real I/O access trace or generated from a synthetic distribution (in this study we use a real trace of user I/O requests). The effects of faults injected at a given level are characterized by sta-tistical distributions (e.g., probability and number of errors occurring during data transfer inside the cache). Such
dis-tributions are used as inputs for fault injection at the next higher level. This mechanism allows the propagation of fault effects from lower-level models to higher-level mod-els.
In the model described in Figure 3, the system behavior, the granularity of the data transfer unit, and the quantita-tive measures evaluated are refined from one level to an-other. In the Level 1 model, the unit of data transfer is a set of tracks to be read or written from a user file. In Level 2, it is a single track. In Level 3, the track is decomposed into a set of data blocks, each of which is composed of a set of data symbols. In the following subsections, we describe the three levels. In this study, we address Level 2 and Level 3 models, which describe the internal behavior of the cache and RAID subsystems in the presence of faults. Level 1 is included to illustrate the flexibility of our approach. Using the hierarchical methodology, additional models can be built on top of Level 2 and Level 3 models to study the be-havior of other systems relying on the cache and RAID subsystems.
3.1 Level 1 model
Level 1 model translates user requests to read/write a specified file into requests to the storage system to read/write the corresponding set of tracks. It then propa-gates the replies from the storage system back to the users, taking into account the presence of faults in the cache and RAID subsystems. A file request (read, write) results in a sequence of track requests (read, fast-write, write-through). Concurrent requests involving the same file may arrive from different users. Consequently, a failure in a track op-eration can affect multiple file requests. In the Level 1 model, the cache subsystem and the disk array are modeled as a single entity—a black box. A fault dictionary specify-ing the results of track operations is defined to characterize the external behavior of the black box in the presence of faults. There are four possible results for a track operation (from the perspective of occurrence, detection, and correc-tion of errors): 1) successful read/write track operacorrec-tion (i.e., absence of errors, or errors detected and corrected), 2) errors detected but not corrected, 3) errors not detected, and 4) service unavailable. Parameter values representing the probability of the occurrence of these events are pro-vided by the simulation of the Level 2 model. Two types of outputs are derived from the simulation of the Level 1 model: 1) quantitative measures characterizing the prob-ability of user requests failure and 2) the workload distri-bution of read or write track requests received by the cache subsystem. This workload is used to feed the Level 2 model.
3.2 Level 2 model
The Level 2 model describes the behavior in the pres-ence of faults of the cache subsystem and the disk array. Cache operations and the data flow between the cache con-troller, the cache memory, and the disk array are described
Figure 2: A simplified RAID Tn+1 T1 row2 row1 T2n Tn Q[n+1 ; 2n] Q[1 ; n] Redundancy Disks: P, Q Data Disks: D1, … Dn P[n+1 ; 2n] P[1 ; n]
to identify scenarios leading to the outputs described in the Level 1 model and to evaluate their probability of occur-rence. At Level 2, the data stored in the cache memory and the disks is explicitly modeled and structured into a set of tracks. Volatile memory and nonvolatile memory are mod-eled as separate entities. A track transfer operation is seen at a high level of abstraction. A track is seen as an atomic piece of data, traveling between different subparts of the system (from user to cache, from cache to user, from disk to cache, from cache to disk), while errors are injected to the track and to the different components of the system. Accordingly, when a track is to be transferred between two communication partners, for example, from the disk to the cache memory, none of the two needs to be aware of the disassembling, buffering, and reassembling procedures that occur during the transfer. This results in a significant simu-lation speedup, since the number of events needing to be processed is reduced dramatically.
3.2.1 Workload distribution. Level 2 model inputs
correspond to requests to read or write tracks from the cache. Each request specifies the type of the access (read, write-through, fast-write) and the track to be accessed. The
distribution specifying these requests and their interarrival times can be derived from the simulation of the Level 1 model, from real measurements (i.e., real trace), or by gen-erating distributions characterizing various types of work-loads.
3.2.2 Fault models. Specification of adequate fault
models is essential to recreate realistic failure scenarios. To this end we distinguished three primary fault models, used to exercise and analyze error detection and recovery mechanisms of the target system. These fault models in-clude 1) permanent faults leading to cache controller com-ponent failures, cache memory comcom-ponent failures, or disk failures, 2) transient faults leading to track errors affecting single or multiple bits of the tracks while they are stored in
the cache memory or in the disks, and 3) transient faults
leading to track errors affecting single or multiple bits
dur-ing the transfer of the tracks by the cache controller to the
cache memory or to the disks.
Component failures. When a permanent fault is
in-jected into a cache controller component, the requests processed by this component are allocated to the other
Figure 3: Hierarchical modeling of the cache-based storage system Workload
Generator
Workload Generator
Fault
Injector Cache &
RAID disk array Channel interfaces
and control units
Level 3 outputs
Prob. and # of errors during transfer • in CCI to channels/disks • over Bus 1
• in CCI to cache memory • over Bus 2
Level 2 outputs
1) Prob. of successful track operation 2) Prob. of failed track operation • Errors detected & not corrected • Errors not detected
• Cache or RAID unavailable 2) Coverage (CRC, parity, EDAC) 3) Error latency distribution 4) Frequency of track reconstructions
Level 1 outputs
1) Probability of failure of user requests 2) Distribution of track read/write requests
sent to {cache+RAID} User requests to read or write Si
tracks from/to a file Fi
Track read/ write requests to {cache + RAID} {read,T1}, …, {write,Tn} Un {read,Fi,Si}, …,U1{write,F1,S1} result of each track transfer Read/write from/to memory Track Transfer Read/write to/from disks Requests to read or write tracks
Level 1: {Cache +RAID} modeled as a black box
Cache Memory RAID Disk
Level 3: Details the transfer of a track inside the cache controller;
each track decomposed into data blocks; data block = set of data symbols
Level 2: interactions between cache controller, RAID and cache memory;
tracks in cache memory and disks explicitly modeled; data unit = track
CCI to cache memory CCI to chan-nels/disks Cache controller accesses to the disks accesses to cache memory CCI cache memory CCI chan-nels/disks Buffers Workload Generator Bus2 Bus1 Buffers Fault Injectors Fault Injectors
Request to transfer a Track composed of n data blocks, Bi = {di1,…dik} data symbols
user specified parameters
T1{B1, B2,…, Bn }
fault injection in {cache+disk} based on probabilities evaluated from level 2
• track errors in the buffers • bus transmission errors •cache component/disk failure •memory/disk track errors •track errors during transfer user specified
parameters inputs from level 3 inputs from level 2
components of the cache controller that are still available. The reintegration of the failed component after repair does not interrupt the cache operations in progress. Permanent faults injected into a cache memory card or a single disk lead to the loss of all tracks stored in these components. When a read request involving tracks stored on a faulty component is received by the cache, an attempt is made to read these tracks from the nonvolatile memory or from the disks. If the tracks are still valid in the nonvolatile memory or in the disks, or if they can be reconstructed from the valid disks, then the read operation is successful, otherwise the data is lost. Note that when a disk fails, a hot spare is used to reconstruct the data and the failed disk is sent for repair.
Trackerrorsinthecachememoryandthedisks. These
correspond to the occurrence of single or multiple bit-errors in a track due to transient faults. Two fault injection strategies are distinguished: time dependent and load de-pendent. Time dependent strategy simulates faults occur-ring randomly. The time of injection is sampled from a predefined distribution, and the injected track, in the mem-ory or in the disks, is chosen uniformly from the set of ad-dressable tracks. Load dependent strategy aims at simulat-ing the occurrence of faults due to stress. The fault injec-tion rate depends on the number of accesses to the memory or to the disks (instead of the time), and errors are injected in the activated tracks. Using this strategy, frequently ac-cessed tracks are injected more frequently than other tracks. For both strategies, errors are injected randomly into one or more bytes of a track. The fault injection rate is tuned to allow a single fault injection or multiple near-coincident fault injections (i.e., the fault rate is increased during a short period of time). This enables us to analyze the impact of isolated and bursty fault patterns.
Trackerrorsduringtransferinsidethecache. Track
er-rors can occur:
• in the cache controller interfaces with channels/disks be-fore transmission over Bus 1 (see Figure 1), i.e., bebe-fore parity or CRC computation or checking,
• during transfer over Bus 1, i.e., after parity computation, • in the cache controller interfaces to cache memory before
transmission over Bus 2, i.e., before EDAC computation, or
• during transfer over Bus 2, i.e., after EDAC computation. To be able to evaluate the probability of occurrence and the number of errors affecting the track during the transfer, a detailed simulation of cache operations during this trans-fer is required. Including this detailed behavior in the Level 2 model would be far too costly in terms of compu-tation time and memory occupation. For that reason, this simulation is performed in the Level 3 model. In the Level 2 model, a distribution is associated with each event de-scribed above, specifying the probability and the number of errors occurring during the track transfer. The track
er-ror probabilities are evaluated at Level 3.
3.2.3 Modelingoferrordetectionmechanisms.
Per-fect coverage is assumed for cache components and disk failures due to permanent faults. The detection of track er-rors occuring when the data is in the cache memory or in the disks, or during the data transfer depends on (1) the number of errors affecting each data symbol to which the error detection code is appended and (2) when and where these errors occurred (see Table 1). The error detection modeling is done using a behavioral approach. The number of errors in each track is recorded and updated during the simulation. Each time a new error is injected into the track, the number of errors is incremented. When a request is sent to the cache controller to read a track, the number of errors affecting the track is checked and compared with the error detection conditions summarized in Table 1. During a write operation, the track errors that have been accumu-lated during the previous operations are overwritten, and the number of errors associated to the track is reset to zero.
3.2.4 Quantitative measures. Level 2 simulation
en-ables us to reproduce several error scenarios and analyze the likelihood that errors will remain undetected by the cache or will cross the boundaries of several error detec-tion and recovery mechanisms before being detected. Moreover, using the fault injection functions implemented in the model, we analyze (a) how the system responds to different error rates (especially burst errors) and input dis-tributions and (b) how the accumulation of errors in the cache or in the disks and the error latency affect overall system behavior. Statistics are recorded to evaluate the fol-lowing: coverage factors for each error detection mecha-nism, error latency distributions, and the frequency of track reconstruction operations. Other quantitative measures, such as the availability of the system and the mean time to data loss, can also be recorded.
3.3 Level 3 model
The Level 3 model details cache operations during the transfer of tracks from user to cache, from cache to user, from disk to cache, and from cache to disk. This allows us to evaluate the probabilities and number of errors occur-ring duoccur-ring data transfers (these probabilities are used to feed the Level 2 model, as discussed in Section 3.2). Un-like Level 2, which models a track transfer at a high level of abstraction as an atomic operation, in Level 3, each track is decomposed into a set of data blocks, which are in turn broken down into data symbols (each one correspond-ing to a predefined number of bytes). The transfer of a track is performed in several steps and spans several cy-cles. CRC, parity or EDAC bits are appended to the data transferred inside the cache or over the busses (Bus 1 and Bus 2). Errors during the transfer may affect the data bits as well as the check bits. At this level, we assume that the data stored in the cache memory and in the disk array is er-ror free, as the impacts of these erer-rors are considered in the
Level 2 model. Therefore, we need to model only the cache controller interfaces to the channels/disks and to the cache memory and the data transfer busses. The Level 3 model input distribution defines the tracks to be accessed and the interarrival times between track requests. This dis-tribution is derived from the Level 2 model.
Cache controller interfaces include a set of buffers in which the data to be transmitted to or received from the busses is temporarily stored (data is decomposed or as-sembled into data symbols and redundancy bits are ap-pended or checked). In the Level 3 model, only transient faults are injected to the cache components (buffers and busses). During each operation, it is assumed that a healthy component will perform its task correctly, i.e., it will exe-cute the operation without increasing the number of errors in the data it is currently handling. For example, the cache controller interfaces will successfully load their own buff-ers, unless they are affected by errors while performing the load operation. Similarly, Bus 1 and Bus 2 will transfer a data symbol and the associated information without errors, unless they are faulty while doing so. On the other hand, when a transient fault occurs, single or multiple bit-flips are continuously injected (during the transient) into the data symbols being processed. Since a single track transfer is a sequence of operations spanning several cycles, single errors due to transients in the cache components may lead to a burst of errors in the track currently being transferred. Due to the high operational speed of the components, even a short transient (a few microseconds) may result in an er-ror burst, which affects a large number of bits.
4 Simulation experiments and results
In this section, we present the simulation results ob-tained from Level 2 and Level 3 to highlight the advan-tages of using a hierarchical approach for system depend-ability analysis. We focus on the behavior of the cache and the disks when the system is stressed with error bursts. Er-ror bursts might occur during data transmission over bus-ses, in the memory and the disks as observed, e.g., in [2]. It is well known that the CRC and EDAC error detection mechanisms provide high error detection coverage of sin-gle bit errors. Previously the impact of error bursts has not been extensively explored. In this section, we analyze the coverage of the error detection mechanisms, the distribu-tion of error detecdistribu-tion latency and error accumuladistribu-tion in the cache memory and the disks, and finally the evolution of the frequency of track reconstruction in the disks.
4.1
Experiment set-up
Input distribution. Real traces of user I/O requests were
used to derive inputs for the simulation. Information pro-vided by the traces included tracks processed by the cache subsystem, the type of the request (read, fast-write, write-through), and the interarrival times between the requests. Using a real trace gave us the opportunity to analyze the system under a real workload. The input trace described
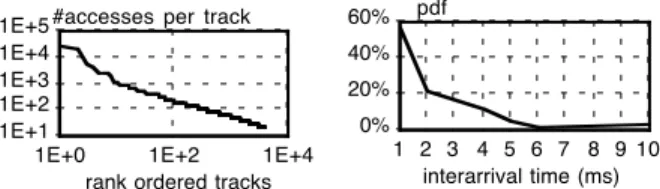
accesses to more than 127,000 tracks, out of 480,000 ad-dressable tracks. As illustrated by Figure 4, the distribution of the number of accesses per track is not uniform. Rather a few tracks are generally more frequently accessed than the rest—the well-known track skew phenomenon. For in-stance, the first 100 most frequently accessed tracks ac-count for 80% of the accesses in the trace; the leading track of the input trace is accessed 26,224 times, whereas only 200 accesses are counted for rank-100 track. The in-terarrival time between track accesses is about a few milli-seconds, leading to high activity in the cache subsystem. Figure 5 plots the probability density function of the inter-arrival times between track requests. Regarding the type of the requests, the distribution is: 86% reads, 11.4% fast-writes and 2.6% write-through operations.
Simulation parameters. We simulated a large disk
ar-ray composed of 13 data disks and 2 redundancy disks. The RAID data capacity is 480,000 data tracks. The capac-ity of the simulated cache memory is 5% the capaccapac-ity of the RAID. The rate of occurrence of permanent faults is 10-4 per hour for cache components (as is generally ob-served for hardware components) and 10-6 per hour for the disks [4]. The mean time for the repair of cache subsystem components is 72 hours (a value provided by the system manufacturer). Note that when a disk fails, a hot spare is used for the online reconstruction of the failed disk.
Transient faults leading to track errors occur more fre-quently than permanent faults. Our objective is to analyze how the system responds to high fault rates and bursts of errors. Consequently, high transient fault rates are assumed in the simulation experiment: 100 transients per hour over the busses, and 1 transient per hour in the cache controller interfaces, the cache memory and the disks. Errors occur more frequently over the busses than in the other compo-nents. Regarding the load-dependent fault injection strat-egy, the injection rate in the disk corresponds to one error each 1014 bits accessed, as observed in [4]. The same injec-tion rate is assumed for the cache memory. Finally, the length of the error burst in the cache memory and in the disks is sampled from a normal distribution with a mean of 100 and a standard deviation of 10, whereas the length of the error burst during the track transfer inside the cache is evaluated from the Level 3 model as discussed in Section 3.3. The results presented in the following subsections cor-respond to the simulation of 24 hours of system operation.
#accesses per track
1E+1 1E+2 1E+3 1E+4 1E+5
1E+0 1E+2 1E+4
rank ordered tracks interarrival time (ms) 0% 20% 40% 60% 1 2 3 4 5 6 7 8 9 10 pdf
4.2 Level 3 model simulation results
As discussed in Section 3.3, the Level 3 model aims at evaluating the number of errors occurring during the trans-fer of the tracks inside the cache due to transient faults over the busses and in the cache controller interfaces. We assumed that the duration of a transient fault is 5 micro-seconds. During the duration of the transient, single or multiple bit flips are continuously injected in the track data symbols processed during that time. The cache operational cycle for the transfer of a single data symbol is of the order of magnitude of a few nanoseconds. Therefore the occur-rence of a transient fault might affect a large number of bits in a track. This is illustrated by Figure 6, which plots the conditional probability density function of the number of errors (i.e., number of bit-flips) occurring during the transfer over Bus 1 and Bus 2 (Figure 6-a) and inside the cache controller interfaces (Figure 6-b), given that a tran-sient fault occurred. The distribution is the same for Bus 1 and Bus 2 due to the fact these busses have the same speed. The mean length of the error burst measured from the simulation is around 100 bits during transfer over the busses, 800 bits when the track is temporarily stored in the cache controller interfaces to cache memory, and 1000 bits when the track is temporarily stored in the cache controller interfaces to channels/disks. The difference between the results is related to the difference between the track trans-fer time over the busses and the track loading time inside the cache controller interfaces.
4.3 Level 2 model simulation results
We used the burst error distributions obtained from the Level 3 model simulation to feed Level 2 model as ex-plained in Section 3.2. In following subsections we present and discuss the results obtained from the simulation of Level 2, specifically: 1) the coverage of the cache error de-tection mechanisms, 2) the error latency distribution, and 3) the error accumulation in the cache memory and disks and the evolution of the frequency of track reconstruction.
4.3.1 Error detection coverage. For all simulation
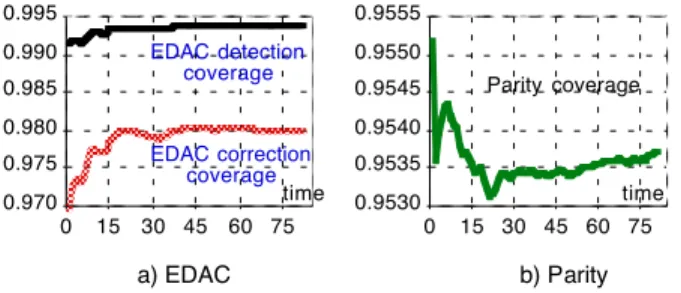
experiments that we performed, the coverage factor meas-ured for the frontend CRC and the physical sector CRC was 100%. This is due to the very high probability of de-tecting error patterns by the CRC algorithm implemented in the system (see Section 2.2). Regarding EDAC and par-ity, the coverage factors tend to stabilize as the simulation
time increases (see Figures 7-a and 7-b, respectively). Each unit of time in Figures 7-a and 7-b corresponds to 15 min-utes of system operation. Note that EDAC coverage re-mains high even though the system is stressed with long bursts occurring at a high rate, and more than 98% of the errors detected by EDAC are automatically corrected on-the-fly. This is due to the fact that errors are injected ran-domly in the track and the probability of having more than three errors in a single data symbol is low. (The size of a data symbol is around 10-3 the size of the track.) All the er-rors that escaped EDAC or parity have been detected by the frontend CRC upon a read request from the hosts. This result illustrates the advantages of storing the CRC with the data in the cache memory to provide extra detection of errors escaping EDAC and parity and to compensate for the relatively low parity coverage.
pdf 0 0.1 0.2 0.3 0.4 0.5 0 40 80 120 160 200 # errors during transfer
0 0.1 0.2 0.3 0.4 0.5 0.6 0 200 400 600 800 1000 pdf
# errors during transfer CCI channels/disks CCI cache memory
a) Bus 1, Bus 2 b) cache controller interfaces
Figure 6: Pdf of number of errors during track transfer given that a transient fault is injected
0.970 0.975 0.980 0.985 0.990 0.995 0 15 30 45 60 75 EDAC detection coverage EDAC correction coverage time 0.9530 0.9535 0.9540 0.9545 0.9550 0.9555 0 15 30 45 60 75 Parity coverage time a) EDAC b) Parity
4.3.2 Error latency and error propagation. When
an error is injected in a track, the time of occurrence of the error and a code identifying which component caused the error are recorded. This allows us to monitor the error propagation in the system. Six error codes are defined: CCI (error occurred when data is stored in the cache controller interfaces to the channels/disks and to the cache memory),
CM (error in the cache memory), D (error in the disk), B1
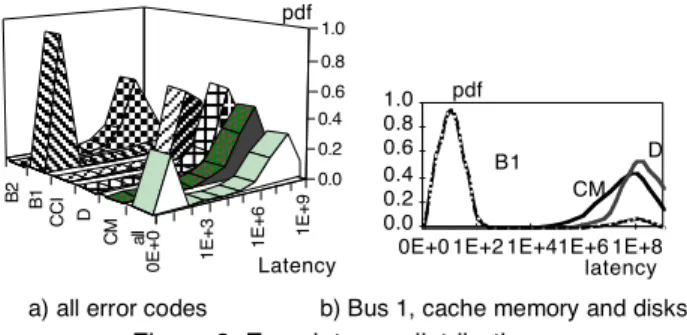
(error during transmission over Bus 1), and B2 (error dur-ing transmission over Bus 2). The time for an error to be overwritten (during a write operation) or detected (upon a read operation) is called error latency. Since a track is considered faulty as soon as an error is injected, we record the latency associated with the first error injected in the track. This means that the error latency that we measure corresponds to the time between when the track becomes faulty and when the errors are overwritten or detected. Therefore, the error latency measured for each track is the maximum latency for errors present in the track. Figure 8 plots the error latency probability density function for er-rors, as categorized above, and error latency for all sam-ples without taking into account the origin of errors (the unit of time is 0.1 ms). The latter distribution is bimodal. The first mode corresponds to a very short latency that re-sults mainly from errors occurring over Bus 1 and detected by parity. The second mode corresponds to longer laten-cies due to errors occurring in the cache memory or the disks, or to the propagation of errors occurring during data transfer inside the cache. Note that most of the errors es-caping parity (error code B1) remain latent for a longer pe-riod of time (as discussed in Section 3.2.3).
The value of the latency depends on the input distribu-tion. If the track is not frequently accessed, then errors pre-sent in the track might remain latent for a long period of time. Figure 8-b shows that the latency of errors injected in the cache memory is slightly lower than the latency of er-rors injected in the disk. This is because the disks are less frequently accessed than the cache memory. Finally, it is important to notice that the difference between the error la-tency distribution for error codes B1 and B2 (Figure 8-a) is due to the fact that data transfers over Bus1 (during read and write operations) are covered by parity, whereas errors occurring during write operations over Bus 2 are detected later by EDAC or by FE-CRC when the data is read from the cache. Consequently, it would be useful to check
EDAC before data is written to the cache memory in order to reduce the latency of errors due to Bus 2.
4.3.3 Errordistribution in thecache memory and
in the disks. Analysis of error accumulation in the cache
memory and disks provides valuable feedback, especially for scrubbing policy. Figure 9 plots the evolution in time of the percentage of faulty tracks in the cache memory and in disks (the unit of time is 15 minutes). An increasing trend is observed for the disks, whereas in the cache mem-ory we observe a periodic behavior. In the latter case, the percentage of faulty tracks first increases and then de-creases when either errors are detected upon read opera-tions or are overwritten when tracks become dirty. Since the cache memory is accessed very frequently (every 5 milliseconds in average) and the cache hit rate is high (more than 60%), errors are more frequently detected and overwritten in the cache memory than in the disks. The in-crease of the number of faulty tracks in the cache affects the track reconstruction rate (number of reconstructions per unit of time), as illustrated in Figure 10. The average track reconstruction rate is approximately 8.710-5 per mil-lisecond. It is noteworthy that the detection of errors in the cache memory does not necessarily lead to the reconstruc-tion of a track (the track might still be valid in the disks). Nevertheless, the detection of errors in the cache has an impact on performance due to the increase in the number of accesses to the disk. Figure 9 indicates that different strategies should be considered for disk and cache memory scrubbing. The disk should be scrubbed more frequently than the cache memory; this prevents error accumulation, which can lead to inability to reconstruct a faulty track.
5 Summary, discussion, and conclusions
The dependability of a complex and sophisticated cache-based storage architecture is modeled and simulated. To ensure reliable operation and to prevent data loss, the system employs a number of error detection mechanisms and recovery strategies, including parity, EDAC, CRC checking, and support of redundant disks for data recon-struction. Due to the complex interactions among these mechanisms, it is not a trivial task to accurately capture the behavior of the overall system in the presence of faults. To enable an efficient and detailed dependability analysis, we proposed a hierarchical, behavioral simulation-based ap-proach in which the system is decomposed into several ab-straction levels and a corresponding simulation model is associated with each level. In this approach, the impact of low-level faults is used in a higher level analysis. Using an appropriate hierarchical system decomposition, the com-plexity of individual models can be significantly reduced while preserving the model’s ability to capture detailed system behavior. Moreover, additional details can be in-corporated by introducing new abstraction levels and asso-ciated simulation models.
0 E + 0 1 E + 3 1 E + 6 1 E + 9 al l C M D C C I B 1 B 2 0.0 0.2 0.4 0.6 0.8 1.0 Latency pdf 0.0 0.2 0.4 0.6 0.8 1.0
0E+0 1E+2 1E+41E+6 1E+8 latency
B1 D
CM pdf
a) all error codes b) Bus 1, cache memory and disks
To demonstrate the capabilities of the methodology, we have conducted an extensive analysis of the design of a real, commercial cache RAID storage system. To our knowledge, this kind of analysis of a cache-based RAID system has not been accomplished either in academia or in the industry. The dependability measures used to charac-terize the system include coverage of the different error de-tection mechanisms employed in the system, error latency distribution classified according to the origin of an error, error accumulation in the cache memory and disks, and frequency of data reconstruction in the cache memory. To analyze the system under realistic operational conditions, we used real input traces to drive the simulations. It is im-portant to emphasize that an analytical modeling of the system is not appropriate in this context due to the com-plexity of the architecture, the overlapping of error detec-tion and recovery mechanisms, and the necessity of captur-ing the latent errors in the cache and the disks. Hierarchical simulation offers an efficient method to accomplish the above task and allows detailed analysis of the system to be performed using real input traces.
The specific results of the study are presented in the previous sections. It is, however, important to summarize the key points that demonstrate the usefulness of the pro-posed methodology. First, we focused on the analysis of the system behavior when it is stressed with high fault rates. In particular, we demonstrated that transient faults during a few microseconds—during data transfer over the busses or while the data is in the cache controller inter-faces—may lead to bursts of errors affecting a large num-ber of bits of the track. Moreover, despite the high fault in-jection rate, high EDAC and CRC error detection coverage was observed, and the relatively low parity coverage was compensated for by the extra detection provided by CRC, which is stored with the data in the cache memory.
The hierarchical simulation approach allowed us to per-form a detailed analysis of error latency with respect to the origin of an error. The error latency distribution measured from the simulation, regardless the origin of the errors, is bimodal†: short latencies are mainly related to errors oc-curring and detected during data transfer over the bus pro-tected by parity, and the highest error latency was observed for errors injected into the disks. The analysis of the evolu-tion during the simulaevolu-tion of the percentage of faulty tracks in the cache memory and the disks showed that, in
† Similar behavior was observed in other studies, e.g.,[1, 14].
spite of a high rate of injected faults, there is no error ac-cumulation in the cache memory, i.e., the percentage of faulty tracks in the cache varies within a small range (0.5% to 2.5%, see Section 4.3.3), whereas an increasing trend was observed for the disks (see Figure 9). This is related to the fact that the cache memory is accessed very frequently, and errors are more frequently detected and overwritten in the cache memory than in the disks. The primary implica-tion of this result, together with the results of the error la-tency analysis, is the need for a carefully designed scrub-bing policy capable of reducing the error latency with ac-ceptable performance overhead. Simulation results suggest that the disks should be scrubbed more frequently than the cache memory in order to prevent error accumulation, which may lead to an inability to reconstruct faulty tracks.
We should emphasize that the results presented in this paper are derived from the simulation of the system using a single, real trace to generate the input patterns for the simulation. Additional experiments with different input traces and longer simulation times should be performed to confirm these results. Moreover, the results presented in this paper are preliminary, as we addressed only the impact of errors affecting the data. Continuation of this work will include modeling of errors affecting the control flow in cache operations. The proposed approach is flexible enough to incorporate these aspects of system behavior. Including control flow will obviously increase the com-plexity of the model, as more details about system behav-ior must be described in order to simulate realistic error scenarios and provide useful feed back for the designers. It is clear that this kind of detailed analysis cannot be done without the support of a hierarchical modeling approach.
Acknowledgments
The authors are grateful to the anonymous reviewers whose comments helped improve the presentation of the paper and to Fran Baker for her insightful editing if our manuscript. This work was supported by the National Aeronautics and Space Administration (NASA) under grant NAG-1-613, in cooperation with the Illinois Com-puter Laboratory for Aerospace Systems and Software (ICLASS), and by the Advanced Research Projects Agency under grant DABT63-94-C-0045. The findings, opinions, and recommendations expressed herein are those of the authors and do not necessarily reflect the position or policy of the United States Government or the University of Illinois, and no official endorsement should be inferred.
References
[1] J. Arlat, M. Aguera, Y. Crouzet, et al., «Experimental Evaluation of the Fault Tolerance of an Atomic Multicast System,» IEEE Transactions on Reliability, vol. 39, pp. 455-467, 1990.
[2] A. Campbell, P. McDonald, and K. Ray, «Single Event Upset Rates in Space,» IEEE Transactions on Nuclear Science, vol. 39, pp. 1828-1835, 1992. 0% 1% 2% 3% 4% 1 11 21 31 41 51 61 71 81 cache memory disks
time
%faulty tracks frequency
0E+0 1E-5 2E-5
1 11 21 31 41 51 61 71 81 time
Figure 9: Percentage faulty Figure 10: Frequency of tracks in cache and disks track reconstruction
[3] C.-H. Chen and A. K. Somani, «A Cache Protocol for Error Detection and Recovery in Fault-Tolerant Computing Sys-tems,» 24th IEEE International Symposium on Fault-Tolerant Computing (FTCS-24), Austin, Texas, USA, 1994, pp. 278-287.
[4] P. M. Chen, E. K. Lee, G. A. Gibson, et al., «RAID: High-Performance, Reliable Secondary Storage,» ACM Computing Surveys, vol. 26, pp. 145-185, 1994.
[5] M. B. Friedman, «The Performance and Tuning of a Stora-geTek RAID 6 Disk Subsystem,» CMG Transactions, vol. 87, pp. 77-88, 1995.
[6] K. K. Goswami, «Design for Dependability: A simulation-Based Approach,» PhD., University of Illinois at Urbana-Champaign, UILU-ENG-94-2204, CRHC-94-03, February 1994.
[7] K. K. Goswami, R. K. Iyer, and L. Young, «DEPEND: A simulation Based Environment for System level Dependabil-ity Analysis,» IEEE Transactions on Computers, vol. 46, pp. 60-74, 1997.
[8] M. Holland, G. Gibson, A., and D. P. Siewiorek, «Fast, On-Line Failure Recovery in Redundant Disk Arrays,» 23rd In-ternational Symposium on Fault-Tolerant Computing (FTCS-23), Toulouse, France, 1993, pp. 422-431.
[9] R. Y. Hou and Y. N. Patt, «Using Non-Volatile Storage to improve the Reliability of RAID5 Disk Arrays,» 27th Int. Symposium on Fault-Tolerant Computing (FTCS-27), WA, Seattle, 1997, pp. 206-215.
[10] G. E. Houtekamer, «RAID System: The Berkeley and MVS Perspectives,» 21st Int. Conf. for the Resource Man-agement & Performance Evaluation of Enterprise Computing Systems (CMG'95), Nashville, Tennesse, USA, 1995, pp. 46-61.
[11] J. Menon, «Performance of RAID5 Disk Arrays with Read and Write Caching,» International Journal on Distrib-uted and Parallel Databases, vol. 2, pp. 261-293, 1994. [12] J. Menon and J. Cortney, «The Architecture of a
Fault-Tolerant Cached RAID Controller,» 20th Annual Interna-tional Symposium on Computer Architecture, San Diego, CA, USA, 1993, pp. 76-86.
[13] D. A. Patterson, G. A. Gibson, and R. H. Katz, «A Case for Redundant Arrays of Inexpensive Disks (RAID),» ACM International Conference on Management of Data (SIGMOD), New York, 1988, pp. 109-116.
[14] J. G. Silva, J. Carreira, H. Madeira, et al., «Experimental Assessment of Parallel Systems,» 26th International Sympo-sium on Fault-Tolerant Computing (FTCS-26), Sendai, Ja-pan, 1996, pp. 415-424.
![Figure 2: A simplified RAID Tn+1 T1 row2row1T2n Tn Q[n+1 ; 2n] Q[1 ; n] Redundancy Disks: P, Q Data Disks: D1, … Dn P[n+1 ; 2n] P[1 ; n]](https://thumb-eu.123doks.com/thumbv2/123doknet/2341691.33998/5.918.85.436.107.223/figure-simplified-raid-tn-redundancy-disks-data-disks.webp)