HAL Id: hal-01135613
https://hal-mines-paristech.archives-ouvertes.fr/hal-01135613
Submitted on 25 Mar 2015HAL is a multi-disciplinary open access archive for the deposit and dissemination of sci-entific research documents, whether they are pub-lished or not. The documents may come from teaching and research institutions in France or abroad, or from public or private research centers.
L’archive ouverte pluridisciplinaire HAL, est destinée au dépôt et à la diffusion de documents scientifiques de niveau recherche, publiés ou non, émanant des établissements d’enseignement et de recherche français ou étrangers, des laboratoires publics ou privés.
technological and regional approach with TIAM-FR
Olivia Ricci, Sandrine Selosse
To cite this version:
Olivia Ricci, Sandrine Selosse. Achieving negative emissions in the power sector: A technological and regional approach with TIAM-FR. [Research Report] Working Paper 2012-03-06, Chaire Modélisation prospective au service du développement durable. 2012, pp.20 - Les Cahiers de la Chaire. �hal-01135613�
Les Cahiers de la Chaire
e Modé
lisa
tion pr
ospectiv
e au se
rvice du dé
veloppe
me
nt dur
able
Achieving negative emissions in the power sector:
A technological and regional approach using TIAM-FR
Olivia RICCI and Sandrine SELOSSE
October 2012
Achieving negative emissions in the power sector:
A technological and regional approach using TIAM-FR
Olivia Ricci
& Sandrine Selosse
Mines ParisTech, Centre for Applied Mathematics Rue Claude Daunesse, BP207, 06904 Sophia Antipolis, France olivia.ricci@mines-paristech.fr, sandrine.selosse@mines-paristech.fr
Abstract
It seems increasingly likely that atmospheric greenhouse gases concentration will overshoot the recommended 400 ppmC02 target. Therefore, it may become necessary to use bioenergy with
carbon capture and storage technologies (BECCS) to remove CO2 from the atmosphere. This
study evaluates the possible deployment of BECCS in the power sector using the bottom-up multiregional optimization model TIAM-FR. The results of this long-term modeling exercise suggest that, to achieve a stringent target, BECCS technology represents an environmentally and economically viable option. The regional analysis shows that industrialized countries will develop CCS mainly on biomass sources while CCS on fossil fuel will be widely deployed in fast-developing countries.
Keywords
Bioenergies, Carbon capture and storage, Long term modeling, Electricity, Environmental poli-cies
Acknowledgment
This research was supported by the Chair Modeling for sustainable development, driven by MINES ParisTech, Ecole des Ponts ParisTech, AgroParisTech, and ParisTech, supported by ADEME, EDF, RENAULT, SCHNEIDER ELECTRIC and TOTAL.
1. Introduction
In its Fourth Assessment Report, the IPCC showed that in order to limit the long-term global temperature increase to 2°C above pre-industrial levels and avoid dangerous consequences of climate change, global greenhouse gas (GHG) emissions need to be reduced by 50% to 85% by 2050. However, it seems increasingly likely that we will overshoot this limit. The IEA, in its World Energy Outlook (2011), announces that “the door to 2°C is closing”. Therefore, it may become necessary to develop technologies that capture emissions out of the atmosphere (nega-tive CO2 emissions technologies). By capturing CO2 from the air (directly or indirectly), CO2
emissions can be sequestered and the stock of atmospheric CO2 reduced to correct for the
over-shoot. It could also be used to offset additional anthropogenic emissions from sectors where emissions reductions are difficult to obtain or uneconomical, such as diffuse emissions. A range of negative emissions options have been identified, such as those that directly remove CO2 from
the atmosphere, so-called direct air-capture technologies (artificial trees and Lime-Soda pro-cess), and those that remove emissions indirectly (augmented ocean disposal processes; biochar and Bioenergy with Carbon Capture and Storage (BECCS)) (Mcglashan, 2012). The cost of di-rect air-capture technologies is still very uncertain (Keith, 2009) therefore BECCS appears to be the negative CO2 emissions technology with the most immediate potential to reduce emissions.
It can be defined as a process in which CO2 originating from biomass is captured and stored in
geological formations. Biomass absorbs CO2 from the atmosphere through the process of
photo-synthesis and releases it during transformation or combustion. If the released CO2 could be
cap-tured and stored permanently in geological storage sites, then we would have a situation of neg-ative CO2 emissions given sustainable biomass harvesting practices.
Many empirical studies show that the use of BECCS is increasingly significant to tackle strict stabilization targets (Fischer et al., 2007, Clarke et al., 2009; Azar et al., 2006, 2010; Edenhofer
et al., 2010; Katofsky et al., 2010; Luckow et al., 2010; van Vuuren et al., 2007, 2010b; van den
Broek et al., 2011; Lemoine et al., 2012). The availability of BECCS decreases the cost of meeting low stabilization targets. By comparing the results of three energy models that include BECCS technologies, Azar et al. (2010) show that CO2 atmospheric concentration can be
re-duced by 50-100 ppm for the same cost when BECCS is used. In fact, negative emissions are essential to meet low concentration targets, but the introduction of BECCS also diverts the emission reduction pathway toward the long-term atmospheric concentration target. It increases near-term flexibility in abatement timing in such a way that emissions reduction occurs in the second half of the century, and modest emissions reduction can be achieved before decreasing the total discounted abatement cost (van Vuuren et al., 2010b; Azar et al., 2010, Clarke al., 2009). However, this argument to postpone emissions reduction raises serious concerns, since relaxing action today could lead to a high overshoot in the concentration level with irreversible consequences on the climate (Azar et al., 2010). Several sectors have been identified as appro-priate targets for the BECCS option, such as the heat and pulp mill industries (Hektor and Berntsson, 2007; Möllersten et al., 2006), the biofuel sector (Möllersten et al., 2003; Kheshgi and Prince, 2005; Mathews, 2008; Lindfeldt and Westermark, 2008, 2009, Laude et al., 2011) and the electricity sector (Carpentieri et al., 2005; Rhodes and Keith, 2005; Uddin and Barreto, 2007). This study focuses on the electricity sector, which is the main producer of energy-related CO emissions. CO capture and storage technologies have therefore been recognized as critical
factors to decarbonize this sector (Ricci and Selosse, 2011). Indeed, the majority of support for CCS demonstrations has focused on power applications (IEA, 2012).
We contribute to the growing body of literature on BECCS by introducing a wide variety of CCS technologies on coal, gas, co-combustion of coal and biomass and biomass power plants in TIAM-FR. This bottom-up optimization model provides a technology-rich basis for estimating energy evolution and structural changes in the long term. It depicts the energy system over the period 2005-2100 in such a way as to minimize the net total cost of the system under a number of environmental, technological and demand constraints. The aim of this paper is to assess the deployment of BECCS technologies in the electricity sector, up to 2100, under ambitious cli-mate objectives. A regional analysis is conducted in order to quantify BECCS potential in in-dustrialized, fast-developing and developing countries. Moreover, the feasibility of BECCS as a negative emissions process technology is heavily dependent on the future development of car-bon capture and storage technology. Due to substantial uncertainties regarding storage capaci-ties, availability of CO2 transport networks, social acceptability, legal issues, and adequate
tech-nology incentives (Herzog, 2011), we also investigate the impact of exogenous constraints on CCS and BECCS availability on the electricity mix structure and on the total cost of the energy system.
The paper is organized as follows: Section 2 describes the model and the main assumptions. Section 3 presents and discusses the results of the long-term modeling. The final section gives some concluding remarks.
2. TIAM-FR model and scenarios
2.1. TIAM-FR structure
Analyses carried out in this paper are based on the TIAM-FR model developed by the MINES ParisTech Center for Applied Mathematics. TIAM-FR is the French version of the TIMES Inte-grated Assessment Model, a widely used, linear programming TIMES family model developed under the IEA’s Energy Technology Systems Analysis Program (ETSAP) (Loulou and Labriet, 2008). TIAM-FR is a bottom-up optimization model that offers a technology-rich representation of the energy system. The development of the energy system can be analyzed in short-, medi-um- and long term perspectives up until the year 2100. TIAM-FR is geographically integrated in 15 global regions that are presented in the following table.
Table 1: Regions in TIAM-FR model Regions group Regions
Industrialized countries
Australia-New Zealand (AUS), Canada (CAN), United-States of America (USA), Western Europe (EU-15, Iceland, Malta, Norway and Switzerland, WEU), Eastern Europe (EEU), Japan (JPN)
Fast developing
countries India (IND), China (includes Hong Kong excludes Chinese Taipei, CHI) Developing
countries
Africa (AFR), Central and South America (CSA), Middle-East (includes Turkey, MEA), Mexico (MEX), South-Korea (SKO), Other developing Asian countries (in-cludes Chinese Taipei and Pacific Islands, ODA), Former Soviet Union (include the Baltic states, FSU)
TIAM-FR is a linear-programming approach in which the technical optimum is computed by minimizing the discounted global system cost. For each region, it computes a total net present value of the stream of annual costs, discounted to a selected reference year. These regional dis-counted costs are then aggregated into a single total cost which is the objective function to be minimized by the model while satisfying a number of technological and/or environmental con-straints. The objective function is:
1 , ∗ ,
∈
where NPV is the net present value of the total cost; ANNcost(r,y) is the total annual cost in re-gion r and in year y; , is the discount rate, refy is the reference year for discounting, years is the set of years and R the set of regions (Loulou, 2008).
Each step of the energy chain, from mining to final energy service demands (heating, lighting, travel, etc.), is identified in the model in terms of both economic and technical characteristics. Technologies to achieve these stages are called processes (extraction of fossil fuels, imports, processing of primary energy in final energy, etc.). Energy carriers (primary energy, final ener-gy, and useful energy), energy services, materials, cash flows and emissions are called commod-ities. The links between the commodities and processes are represented in a Reference Energy System. Each primary energy form is extracted from multiple layers of either reserves (fossil, biomass) or resource potential (wing, hydro, geothermal, etc.), each with a potential and a spe-cific unit cost. This constitutes a supply curve for each energy form. Some types of energy are endogenously traded between the 15 regions (coal, crude oil, refined petroleum products, natu-ral gas, and liquefied natunatu-ral gas). The costs of these energy forms are therefore endogenous. This is not the case for biomass. In the model, biomass is characterized by manifold sources - industrial waste, municipal waste, landfill gas, bioenergy crops, and solid biomass resources – and the fact that it is not traded between regions. The maximum amount of available biomass for each region is determined exogenously according to IEA data. The global potential is esti-mated at 234 EJ per year in 2050 (72 EJ come from bioenergy crops, 72 EJ from solid biomass resources and the rest from industrial waste, municipal waste and landfill gas). In literature, bi-omass potential varies greatly given the different assumptions on land use, yield development, food consumption and other criteria of sustainability, such as water scarcity and loss in biodi-versity. This potential varies from 100 EJ to 300 EJ per year by 2050 (van Vuuren et al., 2009, IPCC, 2011). Electricity is produced by a large number of technologies that use one or more primary resources as inputs. The energy demand determinants, such as population and gross domestic product growth rates, as well as the evolution of demand sectors, are mainly taken from IEA, United Nations and FAO. The latest calibration of the model drivers is based on data from the Energy Technology Perspectives in 2010 (IEA, 2010). Through its integrated climate module, the model makes it possible to analyze and make assumptions on atmospheric GHG concentrations and temperature changes. It integrates CO2, CH4 and N2O emissions from each
2.2. CCS and BECCS in TIAM-FR
TIAM-FR integrates several carbon capture and sequestration technologies on fossil or bioener-gy resources. The purpose of the capture process is to obtain a concentrated stream of almost pure CO2 at high pressure. There are three modes of capturing CO2 from fossil fuels (coal, oil,
natural gas) in the model: 1) a post-combustion mode using a variety of processes such as reac-tive absorption or membranes, 2) a pre-combustion mode with conversion of fuel-chemical en-ergy into H2, followed by simultaneous low-cost carbon separation and 3) an oxy-combustion
mode characterized by the low cost of CO2 separation, but necessitating a supply of O2. For
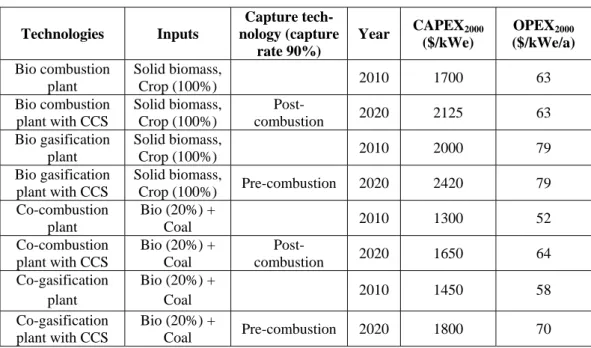
bio-plants and co-firing bio-plants (co-combustion of biomass and fossil fuel), two capture technologies are retained: pre-combustion capture for the biomass gasification process, and post-combustion capture for the biomass direct combustion process. For each technology, economic parameters must be completed, such as capital costs incurred for investing and dismantling processes, oper-ation and maintenance costs, and the date the technology will enter the market (see cost details in table 2).
Table 2: BECCS and co-firing technologies in TIAM-FR
Technologies Inputs Capture tech-nology (capture rate 90%) Year CAPEX2000 ($/kWe) OPEX2000 ($/kWe/a) Bio combustion plant Solid biomass, Crop (100%) 2010 1700 63 Bio combustion plant with CCS Solid biomass, Crop (100%) Post-combustion 2020 2125 63 Bio gasification plant Solid biomass, Crop (100%) 2010 2000 79 Bio gasification plant with CCS Solid biomass, Crop (100%) Pre-combustion 2020 2420 79 Co-combustion plant Bio (20%) + Coal 2010 1300 52 Co-combustion plant with CCS Bio (20%) + Coal Post-combustion 2020 1650 64 Co-gasification plant Bio (20%) + Coal 2010 1450 58 Co-gasification plant with CCS Bio (20%) + Coal Pre-combustion 2020 1800 70
Storage capacities are indicated by region in the TIAM-FR model. Global cumulated storage capacities are 14,800 Gt of CO2 of which 12,600 Gt of CO2 can be stored in deep saline aquifers
(appendix 1).
In order to evaluate the role of BECCS in long-term climate scenarios, we make different as-sumptions on the stringency of the environmental policy.
2.3. Climate scenarios
Three climate scenarios are assumed at a global level.
BAU scenario: A baseline scenario with no emission constraint is calculated first. This
Business As Usual (BAU) scenario outlines some key patterns in the evolution of the
energy system, and serves as the starting point for the analysis. The BAU scenario is then compared to the emissions reduction policy scenarios to assess the implications of carbon constraints on the evolution of the electricity system and formulate policy rec-ommendations. The CO2 emissions total will increase significantly in the BAU
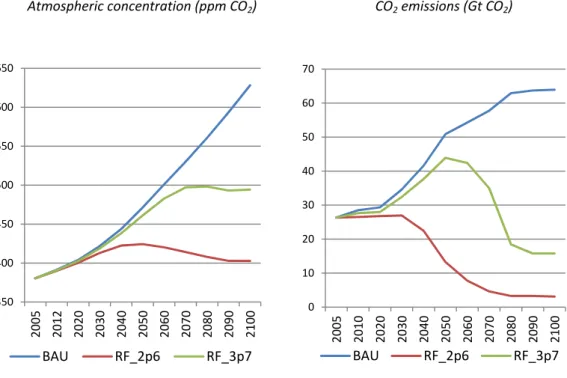
scenar-io, that is, from about 25 Gt in 2005 to 75 Gt by 2100. Driven by these increased emis-sions, CO2 atmospheric concentration will rise significantly over time and reach 628
ppm in 2100, which corresponds to a radiative forcing of about 5.4 W/m2 during the same period.
RF_2p6 scenario: This scenario consists in limiting radiative forcing to 2.6 W/m2
by 2100. This objective is compatible with the UNFCCC consensual 2-2.4°C objective (as specified by IPCC). In TIAM-FR, global CO2 emissions decrease by 50 % in 2050 and
by 84% in 2100 compared to the model’s reference year of 2005. It allows the atmos-pheric CO2 concentration to stabilize at 424 ppm by 2050 and 402 ppm by the end of
the century (figure 2).
RF_3p7 scenario: This scenario limits radiative forcing to 3.7 W/m2
by 2100. CO2
emissions increase by 66.5% from 2005 to 2050 and reach their highest level in 2050 (43.9 Gt of CO2). Then emissions decrease in the second part of the century and reach
15.7 Gt of CO2 in 2100, a reduction of 40% compared to 2005 (figure 1). The
atmos-pheric concentration pursues its growth until 2080 and then slows down to reach 493 ppm in 2100.
In both climate scenarios, emissions in the electricity sector are divided by 7 during the overall period to meet the global objective. In scenario RF_3p7 emissions rise from 2005 to 2050 and then decrease sharply, while in scenario RF_2p6, emissions decline from 2010 and then level off in the second part of the century.
Figure 1: Resulting atmospheric concentration (ppm CO2) and CO2 emissions (Gt CO2)
Atmospheric concentration (ppm CO2) CO2 emissions (Gt CO2)
3. Results: Assessing CCS and BECCS deployment in the electricity
sector
3.1. Impact of climate policies on the electricity mix and CCS
deployment
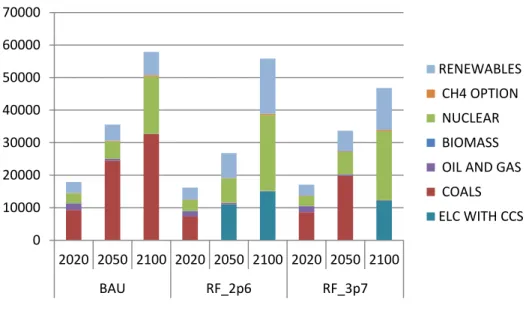
In the BAU scenario, electricity generation increases from 17,934 TWh in 2005 to 35,560 TWh in 2050 and 57,900 TWh in 2100. The implementation of a carbon policy induces a change in the structure of the electricity mix and the wide deployment of carbon capture and storage tech-nologies from 2030 in RF_2p6, and from 2070 in the less stringent scenario RF_3p7.
In RF_2p6, in 2050, electricity from coal, gas and biomass plants with carbon capture and stor-age represents 41% of the mix, with nuclear and renewables accounting for 28% each. In 2050, 99% of biomass power plants, 97% of coal power plants, and 82% of gas power plants are equipped with CCS technology. In 2100, there is significant deployment of renewables and nu-clear energy. Electricity generated from nunu-clear and renewables multiplies by respectively 7 and 4.5 between 2020 and 2100.
In RF_3p7, in 2050, coal remains the principal energy used in electricity production. It repre-sents 59% of the mix, nuclear accounts for 20% and renewables for 27%. In 2100, 26% of
elec-350 400 450 500 550 600 650 2005 2012 2020 2030 2040 2050 2060 2070 2080 2090 2100 BAU RF_2p6 RF_3p7 0 10 20 30 40 50 60 70 2005 2010 2020 2030 2040 2050 2060 2070 2080 2090 2100 BAU RF_2p6 RF_3p7
tricity is produced with CCS, 45% with nuclear and 27% with renewables. Figure 2 describes the electricity mix evolution from 2020 to 2100 in view of the two climate scenarios investigat-ed.
Figure 2: World electricity production (TWh)
The following graph focuses on the CCS technologies developed under the two climate policies. CCS on coal and biomass power plants become competitive options in 2030 in RF_2p6 and in 2070 in RF_3p7. CCS on gas power plants enters the market in 2040 in RF_2p6 and only in 2090 in RF_3p7.
Figure 3: World electricity production from CCS technologies (TWh) 0 10000 20000 30000 40000 50000 60000 70000 2020 2050 2100 2020 2050 2100 2020 2050 2100 BAU RF_2p6 RF_3p7 RENEWABLES CH4 OPTION NUCLEAR BIOMASS OIL AND GAS COALS ELC WITH CCS 0 1000 2000 3000 4000 5000 6000 7000 8000 9000 2050 2100 2100 RF_2p6 RF_3p7 Conventional Pulverized Coal+Oxyfueling Crop ‐ Direct Combustion. With CCS Solid Biomass ‐ Direct Combustion ‐ with CCS NGCC+CO2 removal from flue gas NGCC+Oxyfueling
The results show the role CCS plays in the electricity mix. In RF_2p6, 1,647 TWh, 11,038 TWh and 15,062 TWh of electricity are produced with a CCS technology in respectively 2030, 2050 and 2100. The average annual growth rate over this period is 3%. In 2050, 50% of CCS tech-nologies are applied to fossil resource power plants (coal (35%) and gas (15%)) and 50% to sol-id and crop biomass power plants. The share of fossil fuel power plants with CCS out of the to-tal CCS deployment increases from 2050 to 2100, rising from 50% in 2050 to 55% in 2100. 4.8 Gt of CO2 are captured and stored in geological formations in 2050 and 12 Gt in 2100 in
RF_2p6. In RF_3p7, electricity produced with CCS reaches 12,244 TWh in 2100 and 8 Gt are
captured per year in the same period. 61% of technologies are applied to coal power plants and 39% to biomass power plants.
The next section evaluates the impact of the availability of CCS, BECCS and co-firing technol-ogies on the electricity mix and on CCS technology deployment in the most stringent scenario
(RF_2p6).
3.2. A Technology availability analysis in a climate constrained
economy
The technology scenarios are the following:
- RF_2p6_NoCCS: CCS seems to be a promising technology to reduce CO2 emissions
but a significant number of uncertainties and key aspects need to be addressed to scale up this technology. Therefore, we consider the case where CCS is not deployed on any type of power plant throughout the time horizon.
- RF_2p6_NoBECCS: We assume that CCS technology on full biomass power plants is
not available. It is only developed on coal, gas, and co-combustion of coal and biomass power plants.
- RF_2p6_NoBECCSCF: Finally, we assume that CCS is only developed on coal and gas
power plants. BECCS and CCS are not available on co-firing technologies.
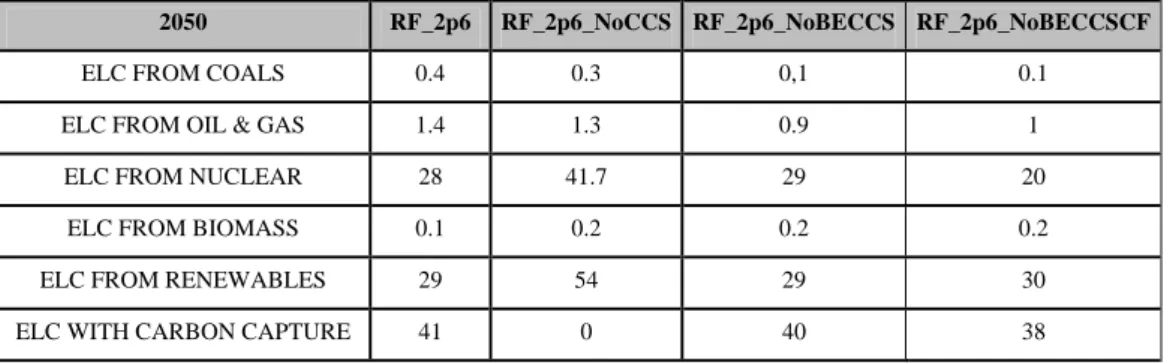
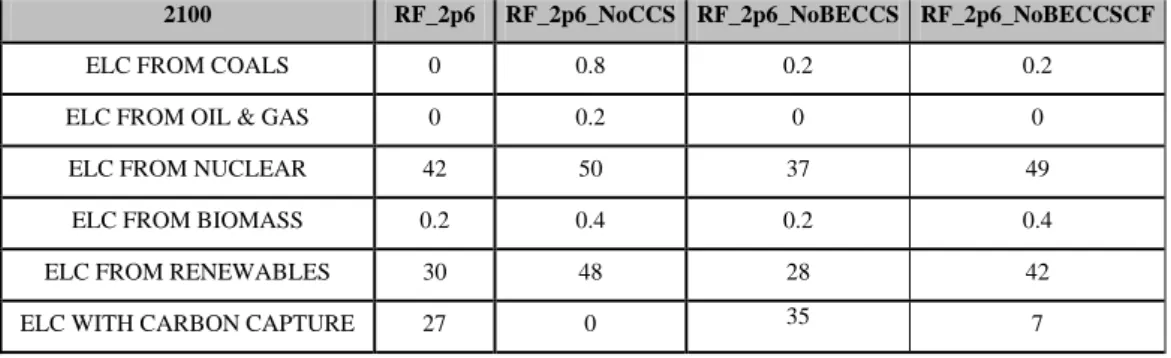
Table 3 and figure 4 show the structure of the electricity mix for 2050 and 2100 and the de-ployment of CCS under the technology scenarios for the climate scenario (RF_2p6).
Table 3: World electricity mix in percent (%)
2050 RF_2p6 RF_2p6_NoCCS RF_2p6_NoBECCS RF_2p6_NoBECCSCF
ELC FROM COALS 0.4 0.3 0,1 0.1 ELC FROM OIL & GAS 1.4 1.3 0.9 1
ELC FROM NUCLEAR 28 41.7 29 20 ELC FROM BIOMASS 0.1 0.2 0.2 0.2 ELC FROM RENEWABLES 29 54 29 30 ELC WITH CARBON CAPTURE 41 0 40 38
When CCS technologies are not available (RF_2p6_NoCCS) the environmental objective is achieved by the rapid deployment of renewable energies and the increase in the nuclear share. In 2050, the fact that biomass-CCS technology is not available does not change the structure of the electricity mix. In RF_2p6 and RF_2p6_NoBECCS, the contribution of CCS is about 40% of the electricity mix. In RF_2p6, we can see that the technology is applied at 50% on both bio-mass and fossil power plants (figure 3). When BECCS is not available there is a switch from bi-omass plants to mainly co-firing plants (figure 4). However, in 2100, comparing RF_2p6 and
RF_2p6_NoBECCS, the CCS share in the power mix increases. Electricity produced from CCS
rises from 15,062 TWh in RF_2p6 to 22,169 TWh in RF_2p6_NoBECCS. In this last scenario, CCS is applied to pulverized coal and air-blown IGCC co-firing plants (figure 4).
Figure 4: World electricity production from CCS technologies (TWh)
0 5000 10000 15000 20000 25000 2050 2100 2050 2100 2050 2100 RF_2p6 RF_2p6_NoBECCS RF_2p6_NoBECCSCF COAL.Conventional Pulverized Coal+oxyfueling COAL.BIO.Pulverized Coal.Co‐Firing+postcombustion COAL.BIO.Air Blown IGCC.Co‐Firing + precombustion GAS.NGCC+postcombustion GAS.NGCC+oxyfueling BIO.Sld Biomass Direct Combustion+postcombustion BIO.Crop Direct Combustion+postcombution
2100 RF_2p6 RF_2p6_NoCCS RF_2p6_NoBECCS RF_2p6_NoBECCSCF
ELC FROM COALS 0 0.8 0.2 0.2 ELC FROM OIL & GAS 0 0.2 0 0
ELC FROM NUCLEAR 42 50 37 49 ELC FROM BIOMASS 0.2 0.4 0.2 0.4 ELC FROM RENEWABLES 30 48 28 42 ELC WITH CARBON CAPTURE 27 0 35 7
When neither CCS on biomass nor CCS on co-firing power plants are available (RF_2p6_NoBECCSCF), the CCS share in the mix, compared to its share in scenario RF_2p6, decreases slightly in 2050 (-11%) and considerably in 2100 (-76%). In 2100, 15,060 TWh of electricity is produced with a CCS technology in RF_2p6 compared to only 3,550 TWh in
RF_2p6_NoBECCSCF. This decrease is mainly compensated by an increase of renewable and
nuclear energies. Why does CCS on coal and gas power plants not act as a substitute for BECCS and co-firing technologies? CCS on coal and gas is penalized under a stringent emis-sions reduction scenario because it does not allow a zero rate of CO2 emissions compared to
to-tally carbon-free technologies, such as renewables and nuclear.
Co-firing option appears to be a good solution to meet the climate target when CCS on bio plants is not available, notably IGCC power plants. IGCC systems are one of the most efficient clean-coal power production technologies. They have the advantage of processing many kinds of feedstock, such as coal, coke, residual oil, biomass and municipal waste. In IGCC plants, feedstock is converted into a hydrogen-rich syngas that is cleaned and burned in a gas turbine. The exhaust gas in then used to power a steam turbine; when CCS is applied, the syngas is transported to a shift reactor to convert CO into CO2 and hydrogen H2. The CO2 produced is
highly concentrated and can therefore be removed by physical absorbents with low efficiency penalties and at a low cost. In principle, IGCC technology is the cheapest option for CCS (IEA-ETSAP, 2010). However IGCC plants are more expensive and less reliable than supercritical conventional pulverized coal power plants (in the model about 15% more expensive). There is no consensus on which option will cost the least in the future. In the model, the cost of the plants with capture is fairly similar for both technologies. In figure 4, we can see that NGCC power plants with CCS also play a role in CCS deployment. NGCC is a mature technology. It was first introduced in the 1990s. Since then, the technology has made progress with cooling and materials development. As a result, efficiency has now reached 60% on a lower heating value basis, compared to standard gas-fired power plants in 2003, when the average efficiency was around 42%. NGCC emits less than half as much CO2 as coal-fired power plants per unit of
electricity, making it an interesting option when co-firing and BECCS technologies are not available (RF_2p6_NoBECCSCF). The constraint on the availability of negative emissions technologies affects the evolution of the electricity mix structure. What, then, is its impact on the total cost of the energy system?
Figure 5 presents the cost of the different stabilization and technological scenarios. It is ex-pressed as the net present value cost of additional mitigation expenditure compared to the BAU scenario (2005-2100) discounted at 5% in trillions of €2000.
Figure 5: Net present value costs for the climate scenarios by 2100
It can be seen that the option of using BECCS reduces the cost of meeting the RF_2p6 stabiliza-tion target. We can expect that the lower the stabilizastabiliza-tion target, the more significant the BECCS contribution will be to reducing costs as negative emissions become critical. In line with literature, we show that the availability of BECCS also has an impact on the least-cost emission reduction pathway towards the long-term concentration objective (Clarke et al., 2009; Azar et al., 2010; van Vuuren et al., 2010b). Conversely, in the RF_3p7 scenario, the total dis-counted cost of the energy system for achieving the carbon target does not change much, what-ever the CCS technology availability. Note howwhat-ever a higher additional cost in case of the total unavailability of CCS. Low carbon transition tends to be based more on other clean technolo-gies.
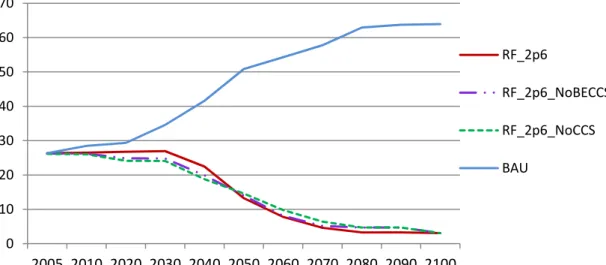
The availability of BECCS in RF_2p6 increases flexibility in timing and postpones emission re-duction after 2030. The CO2 emission peak is around 2030 and then stringent abatement occurs
between 2030 and 2050 (scenario RF_2p6) whereas, when BECCS is unavailable, CO2
emis-sions steadily decrease from 2010 (figure 6).
Figure 6: CO2 emissions pathway (GtCO2) when BECCS and CCS technologies are not available
(RF_2p6 scenario) 0 1 2 3 4 5 6 7 8 9 10 RF_2p6 RF_3p7 Additional cost s (10 12 €) BECCS+CCS+CF NoBECCS NoBECCSCF NoCCS 0 10 20 30 40 50 60 70 2005 2010 2020 2030 2040 2050 2060 2070 2080 2090 2100 RF_2p6 RF_2p6_NoBECCS RF_2p6_NoCCS BAU
We conduct a regional study to quantify BECCS potential in industrialized, fast-developing and developing countries
3.3 A regional analysis
3.3.1. CCS deployment in industrialized countries
In scenario RF_2p6, CCS enters the market in 2030 in industrialized countries on both conven-tional pulverized coal power plants and solid biomass direct combustion. Electricity from plants with carbon capture and storage increases by 20% per year between 2030 and 2050. It peaks in 2070 and then decreases over time (it is mainly the share of coal and gas + CCS that decreases) (figure 7). Given the progressively stringent climate obligations, the low but not nil CO2
emis-sions rate of coal and gas + CCS is compensated by the increase of BECCS and other totally carbon-free technologies, such as nuclear. In 2100, 1.9 Gt and 1.7 Gt of CO2 are captured and
stored per year respectively in RF_2p6 and RF_3p7.
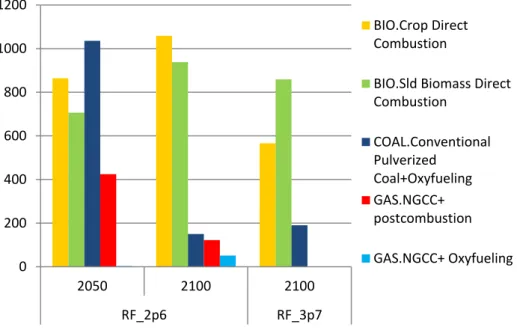
Figure 7: Electricity production from CCS technologies (TWh) in industrialized countries
In industrialized countries, CCS is mainly applied to biomass power plants after 2050 to satisfy both environmental constraints. In RF_2p6, 51% of the deployed CCS is applied to bio plants (1,570 TWh) in 2050; this share increases and reaches 86% in 2100. In Europe (WEU+EEU) and in the USA, CCS on bio plants represents 35% and 55% respectively of total CCS deploy-ment in 2050, and more than 80% in 2100. Australia, Canada and Japan only develop CCS on bio plants to meet the global objective. In RF_3p7, in 2100, CCS is also essentially applied to bio plants (1,425 TWh of electricity produced from biomass comes from a plant equipped with CCS). 0 200 400 600 800 1000 1200 2050 2100 2100 RF_2p6 RF_3p7 BIO.Crop Direct Combustion BIO.Sld Biomass Direct Combustion COAL.Conventional Pulverized Coal+Oxyfueling GAS.NGCC+ postcombustion GAS.NGCC+ Oxyfueling
3.1.2 CCS deployment in fast-developing countries
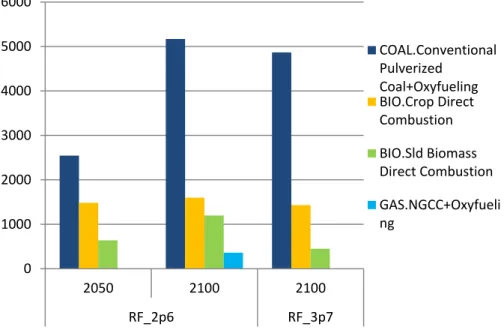
In fast-developing countries, the CCS power share of electricity production is multiplied by al-most 3 from 2030 to 2050 and by 1.7 from 2050 to 2100 in RF_2p6, rising from 1,557 TWh in 2030 to 4,667 TWh in 2050 and 8,330 TWh in 2100 (figure 8). In RF_2p6, 54% of CCS is ap-plied to fossil power plants in 2050 and 66% in 2100. In the less stringent scenario, CCS is de-ployed at 72% on coal power plants. CCS is mainly developed on coal power in China, where it represents more than 70% of the total deployment in both scenarios, whereas India relies more on BECCS than on fossil CCS. About 5 Gt of CO2 are captured and stored in India and China in
2100.
Figure 8: Electricity production from CCS technologies (TWh) in fast-developing countries
3.1.3 CCS deployment in developing countries
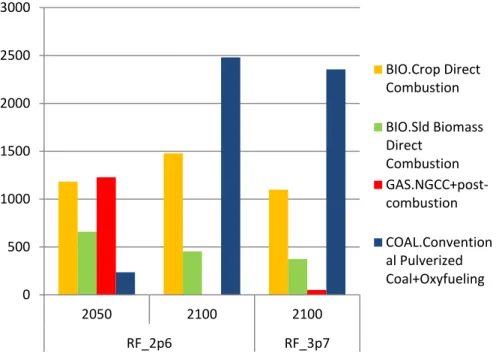
In 2050, half of the CCS deployed is applied to bio plants, and in 2100 CCS is more developed on fossil resources in developing countries (figure 9). However, differences exist between coun-tries. Africa, South America and Central America rely solely on BECCS, while in the Middle East and the former Soviet Union, CCS is mainly used on gas-fired power plants by 2050 and coal plants in 2100. Countries in South East Asia rely primarily on BECCS and a little on gas-fired plants + CCS by 2050. Developing countries store 3 Gt of CO2 in geological formations by
the end of the century in the most stringent scenario.
0 1000 2000 3000 4000 5000 6000 2050 2100 2100 RF_2p6 RF_3p7 COAL.Conventional Pulverized Coal+Oxyfueling BIO.Crop Direct Combustion BIO.Sld Biomass Direct Combustion GAS.NGCC+Oxyfueli ng
Figure 9: Electricity production from CCS technologies (TWh) in developing countries
4.
Conclusion
In this paper we focused on BECCS technology, which has been acknowledged as an interesting negative emission option for achieving major CO2 emissions reductions. We therefore evaluated
the role of power generation from bio plants with CCS to achieve a low climate target by 2100 using the optimization model TIAM-FR. We conducted a regional analysis to understand where the technology will be developed. We also studied what impact the unavailability of this tech-nology would have on the structure of the electricity mix and the cost of the system.
Under a stringent climate control target, the model is favorable for the widespread deployment of CCS technologies in the power sector from 2030. 40% of the electricity generated in 2050 comes from plants equipped with CCS technology. At a global level, 50% of the CCS deployed is associated with bio plants and 50% with fossil plants, with a preponderance of coal power plants. It is important to keep in mind that the possible contribution of BECCS depends heavily on the potential and societal acceptance of bioenergy on one hand, and the deployment of cap-ture and storage technologies on the other. Although there may be significant potential for this technology, uncertainties and concerns remain regarding technology development, carbon-negative life cycle assessment, food security, and biodiversity (van Vuuren et al., 2010a). Therefore, this study also looked at what happens when BECCS is not available in the long run. The results show that with a specific constraint on CCS diffusion, the share of renewables and nuclear energy becomes significant to meet the climate target. Moreover, co-firing options tend to be good substitute for CCS on bio plants when this last option in not available. But more im-portantly, if carbon-negative technologies (co-firing and BECCS) are not available, the share of CCS in the electricity mix significantly decreases in 2100. CCS on fossil fuel does not compen-sate for the absence of carbon-negative technologies as it is not a carbon-neutral technology.
0 500 1000 1500 2000 2500 3000 2050 2100 2100 RF_2p6 RF_3p7 BIO.Crop Direct Combustion BIO.Sld Biomass Direct Combustion GAS.NGCC+post‐ combustion COAL.Convention al Pulverized Coal+Oxyfueling
In line with literature, our scenarios reveal that while a broad range of mitigation technologies are needed to attain low concentration targets, the availability of BECCS enhances the possibil-ity of decreasing the cost of meeting those targets. The emissions reduction pathway depends strongly on technology assumptions. If negative emissions are available, less abatement takes place in the short term, and more aggressive action occurs later in time.
The regional analysis suggests that industrialized countries will develop CCS mainly on their bio plants, whereas in fast-developing countries, principally China, CCS will be applied to coal power plants. In developing countries, there are disparities between countries. Some will only develop BECCS, for instance: Africa, South and Central America and Japan, whereas the Mid-dle East and the former Soviet Union will develop CCS on their gas power plants.
5. References
Azar C, Lindgren K, Larson E, Möllersten K (2006) Carbon capture and storage from fossil fuels and biomass costs and potential role in stabilizing the atmosphère. Climatic Change 74:47-79.
Azar C, Lindgren K, Obersteiner M, Riahi K, Van Vuuren D, Michel K (2010) The feasibility of low CO2 concentration targets and the role of bio-energy with carbon capture and storage
(BECCS). Climatic Change 100: 195-202.
Carpentieri M, Corti A, Lombardi L, 2005 Life cycle assessment (LCA) of an integrated biomass gasification combined cycle (IBGCC) with CO2 removal. Energy Conversion and Management 46:1790–1808.
Clarke L, Edmonds J, Krey V, Richels R, Rose S, Tavoni M (2009) International climate policy architectures: Overview of the EMF 22 international scenarios. Energy Economics 31(Supplement 2):S64–S81, DOI 10.1016/j.eneco.2009.10.013
Edenhofer O, Knopf B, Barker T, Baumstark L, Bellevrat E, Chateau B, Criqui P, Isaac M, Kitous A, Kypreos S, Leimbach M, Lessmann K, Magne B, Scrieciu S, Turton H, van Vuuren DP (2010) The economics of low stabilization: Model comparison of mitigation strategies and costs. Energy Journal 31:11–48
Fisher BS, Nakicenovic N, Alfsen K, Morlot JC, de la Chesnaye F, Hourcade J, Jiang K, Kainuma M, Rovere EL, Matysek A, Rana A, Riahi K, Richels R, Rose S, van Vuuren D, Warren R (2007) Issues related to mitigation in the long term context. In: Metz B, Davidson OR, Bosch PR, Dave R, Meyer LA (eds) Climate Change 2007: Mitigation. Contribution of Working Group III to the Fourth Assessment Report of the Intergovernmental Panel on Climate Change, Cambridge University Press, Cambridge, United Kingdom and New York, NY, USA
Hektor E, Berntsson T (2007) Future CO2 removal from pulp mills – Process integration
conse-quences. Energy Conversion and Management 48: 3025–3033.
Herzog HJ (2011) Scaling up carbon dioxide capture and storage: From megatons to gigatons. Energy Economics 33:597-604
IEA (2012) Energy Technology Perspectives. IEA/OECD Paris. IEA (2011) World Energy Outlook. IEA/OECD Paris.
IEA (2010) Energy Technology Perspectives. IEA/OECD Paris.
IEA-ETSAP (2010) CO2 Capture & Storage. Technology Brief E14 – October.
IPCC (2011) Renewable Energy Sources and Climate Change Mitigation, Special Report, Chap-ter 2. Cambridge University Press, Cambridge.
Katofsky R, Stanberry M, Frantzis L (2010) Achieving climate stabilization in an insecure world: does renewable energy hold the key? Report International Energy Agency -
Renewa-Keith DW (2009) Why capture CO2 from the atmosphere? Science 325(5948):1654–1655, DOI:10.1126/science.1175680
Kheshgi HS, Prince RC (2005) Sequestration of fermentation CO2 from ethanol production.
En-ergy 30:1865–1871.
Laude A, Ricci O, Bureau G, Royer-Adnot J, Fabbri A (2011) CO₂ capture and storage from a bioethanol plant : Carbon and energy footprint and economic assessment. International Jour-nal of Greenhouse Gas Control 5:1220-1231
Lemoine DM, Fuss S, Szolgayova J, Obersteiner M, Kammen DM (2012) The influence of neg-ative emission technologies and technology policies on the optimal climate mitigation portfo-lio. Climatic Change 113:141-162
Lindfeldt E, Westermark MO (2008) System study of carbon dioxide (CO2) capture in bio-based
motor fuel production. Energy 33:352-361.
Lindfeldt E, Westermark MO (2009) Biofuel production with CCS as a strategy for creating a CO2-neutral road transport sector. Energy Procedia 1:4111–4118.
Loulou R. (2008) ETSAP-TIAM: the TIMES integrated assessment model. Part II: mathemati-cal formulation. Computational Management Science 5: 41-66.
Loulou R, Labriet M (2008) ETSAP-TIAM: the TIMES integrated assessment model (Part I: Model structure). Computational Management Science 5: 7-40.
Luckow P, Wise M, Dooley JJ, Kim S (2010) Large-scale utilization of biomass energy and carbon dioxide capture and storage in the transport and electricity sectors under stringent CO2
concentration limit scenario. International Journal of Greenhouse Gas Control 4:865-877. Mathews JA (2008) Carbon-negative biofuels. Energy Policy 36: 940-945.
Mcglashan RN, Workman MHW, Caldecott B, Shah N (2012) Negative Emissions Technolo-gies. Grantham Institute for Climate Change briefing paper No8, Imperial College London Möllersten K, Yan J, Moreira JR (2003) Potential market niches for biomass energy with CO2
capture and storage - Opportunities for energy supply with negative CO2 emissions. Biomass & Bioenergy 25:273-285.
Möllersten K, Gao L, Yan J (2006) CO2 capture in pulp and paper mills: CO2 balances and pre-liminary cost assessment. Mitigation and Adaptation Strategies for Global Change 11: 1129– 1150.
Ricci O, Selosse S (2011) Global and regional potential for bioelectricity with carbon capture and geological storage. Working paper Les cahiers de la Chaire Modélisation Prospective n°2011-03
Rhodes JS, Keith DW (2005) Engineering economic analysis of biomass IGCC with carbon capture and storage. Biomass and Bioenergy 29(6):440–450, DOI 10.1016/j.biombioe.2005.06.007
Uddin SK, Barreto L (2007) Biomass-fired cogeneration systems with CO2 capture and storage. Renewable Energy 32:1006–1019.
van den Broek M, Veenendaal V, Koutstaal P, Turkenburg W, Faaij A (2011) Impact of interna-tional climate policies on CO2 capture and storage deployment: Illustrated in the Dutch
ener-gy system. Enerener-gy Policy 39:2000–2019.
van Vuuren D, Den Elzen M, Lucas P, Eickhout B, Strengers B et al. (2007) Stabilizing green-house gas concentrations at low levels: an assessment of reduction strategies and costs. Cli-matic Change 81:119-159.
van Vuuren D, van Vliet J, Stehfest E (2009) Future bio-energy potential under various natural constraints. Energy Policy 37: 4220-4230.
van Vuuren DP, Bellevrat E, Kitous A, Isaac M (2010a) Bio-energy use and low stabilization scenarios. Energy Journal 31:193–221
van Vuuren DP, Stehfest E, den Elzen MG, van Vliet J, Isaac M (2010b) Exploring IMAGE model scenarios that keep greenhouse gas radiative forcing below 3 W/m2 in 2100. Energy Economics 32(5):1105–1120, DOI 10.1016/j.eneco.2010.03.001
Appendix 1. Cumulated storage capacities in GtCO2 assumed in TIAM-FR
Storage capacity AFR AUS CAN CHI CSA EEU FSU IND
Enhanced Oil Recovery 5.25 0 5 1.5 15 3 30 0
Depleted oil fields (onshore) 5.25 0 5 1.5 15 3 45 0
Depleted oil fields (offshore) 3 1.5 1 0.3 3 0 0 0
Depleted gas fields (onshore) 21 1.5 20 0 45 0 336 0
Depleted gas fields (offshore) 7.5 12 10 0 0 0 0 0
Enhanced Coalbed Methane
Re-covery <1000 m 3.75 37.5 25 75 0 15 75 7.5
Enhanced Coalbed Methane
Re-covery >1000 m 3.75 37.5 25 75 0 15 75 7.5
Deep saline aquifers 1.500 750 1.000 750 1.500 375 1.500 750
Storage capacity JPN MEA MEX ODA SKO USA WEU World
Enhanced Oil Recovery 0 75 0.75 2.25 0 15 0.75 153.5
Depleted oil fields (onshore) 0 112.5 7.5 15 0 15 0.75 225.5
Depleted oil fields (offshore) 0 15 4.5 2.25 0 15 6 51.55
Depleted gas fields (onshore) 0 300 15 45 0 15 22.5 821
Depleted gas fields (offshore) 0 75 15 30 0 15 45 209.5
Enhanced Coalbed Methane
Re-covery <1000 m 0 0 0 37.5 0 60 22.5 358.75
Enhanced Coalbed Methane
Re-covery >1000 m 0 0 0 37.5 0 60 22.5 358.75