HAL Id: hal-00707236
https://hal.archives-ouvertes.fr/hal-00707236
Submitted on 12 Jun 2012
HAL is a multi-disciplinary open access
archive for the deposit and dissemination of
sci-entific research documents, whether they are
pub-lished or not. The documents may come from
teaching and research institutions in France or
abroad, or from public or private research centers.
L’archive ouverte pluridisciplinaire HAL, est
destinée au dépôt et à la diffusion de documents
scientifiques de niveau recherche, publiés ou non,
émanant des établissements d’enseignement et de
recherche français ou étrangers, des laboratoires
publics ou privés.
Kevin Coulomb, Augustin Degomme, Mathieu Faverge, François Trahay
To cite this version:
Kevin Coulomb, Augustin Degomme, Mathieu Faverge, François Trahay. An open source tool chain
for performance analysis. 5th Parallel Tools Workshop, Sep 2011, Dresden, Germany. �hal-00707236�
analysis
K. COULOMB, A. DEGOMME, M. FAVERGE, and F. TRAHAY
Abstract Modern supercomputers with multi-core nodes enhanced by accelerators, as well as hybrid programming models, introduce more complexity in modern appli-cations. Efficiently Exploiting all of the available resources requires a complex per-formance analysis of applications in order to detect time-consuming or idle sections. This paper presents an open-source tool-chain for analyzing the performance of par-allel applications. It is composed of a trace generation framework called EZTRACE,
a generic interface for writing traces in multipe format called GTG, and a trace vi-sualizer called VITE. These tools cover the main steps of performance analysis –
from the instrumentation of applications to the trace analysis – and are designed to maximize the compatibility with other performance analysis tools. Thus, these tools support multiple file formats and are not bound to a particular programming model. The evaluation of these tools show that they provide similar performance compared to other analysis tools, while being generic.
1 Introduction
Numerical simulation has become one of the pillars of science in many domains: nu-merous research topics now rely on computational simulation for modeling physical phenomenons. The need for simulation in various computer power hungry research
Kevin COULOMB
SysFera e-mail: [email protected] Augustin DEGOMME
INRIA Rhône-Alpes – Équipe Mescal e-mail: [email protected] Mathieu FAVERGE
University of Tennessee, Innovative Computing Laboratory e-mail: [email protected] François TRAHAY
Institut Télécom, Télécom SudParis e-mail: [email protected]
areas, such as climate modeling, computational fluid dynamics, and astrophysic, has led to designing massively parallel computers that now reach petaflops. Given the cost of such supercomputers, high performance applications are designed to exploit the available computing power to its maximum. During the development of an appli-cation, the optimization phase is crucial for improving the efficiency. However, this phase requires extensive understanding of the behavior and the performance of the application. The complexity of supercomputer hardware, due to the use of NUMA architectures or hierarchical caches, as well as the use of various programming mod-els like MPI, OpenMP, MPI+threads, MPI+GPUs and PGAS modmod-els, makes it more and more difficult to understand the performance of an application. Due to the com-plexity of the hardware and software stack, the use of convenient analysis tools is a great help for understanding the performance of an application. Such tools permit the user to follow the behavior of a program and to spot its problematic phases.
This paper describes a complete set of tools designed for performance analysis, from the instrumentation of parallel applications using EZTRACEto the analysis of their execution with VITE. This open-source tool-chain provides a convenient and performant means to understand the behavior of an application.
The remainder of this paper is organized as follows: in Section 2, we present various research related to performance analysis. The design of EZTRACE– our
in-strumentation framework – is described in Section 3. Section 4 presents the GTG tracing library. Section 5 provides an overview of our trace visualization tool named VITE. The results of experiments conducted on EZTRACEare discussed in
Sec-tion 6. Finally, in SecSec-tion 7, we draw a conclusion and introduce future work.
2 Related work
Since the advent of parallel programming and the need for optimized applications, numerous work has been conducted on performance analysis. Tools were designed for tracing the execution of parallel applications in order to understand their be-havior. Some of these tools are specific to a particular library – MPE [4] targets MPI applications, POSIXTHREADTOOL[6] aims at applications that use pthreads,
OMPTRACE[3] instruments OpenMP applications, . . . – Others, such as VAMPIR
-TRACE[11], TAU [13] or SCALASCA[7], provide multiple modules and thus can
track calls to multiple libraries. Instrumenting custom libraries or applications can be achieved with these tools by manually or automatically instrumenting the code.
The format of the trace generated by a tracing tool is usually specific, leading to incompatibility between performance analysis tools. Generic trace formats were designed to meet the needs of several tools. The PAJÉformat [8] permits the user
to depict the execution of a program in a generic and hierarchic way. The OPEN
TRACEFORMAT[9] (OTF) provides a generic and scalable means of tracing parallel applications more adapted to MPI applications using various communicators.
Exploring a trace file thus requires a tool designed for a particular trace for-mat. For instance, OTF traces can be viewed with VAMPIR [10], TRIVA[12]
dis-plays PAJÉtraces, and the files generated with MPE can be visualized with JUMP
-SHOT[4]. TAU and SCALASCAembed their own trace file viewer. The lack of
mul-tiformat trace viewers forces users to switch from one system to another, depending on the tracing tool in use. A complete tool-chain – from the application tracing to the trace analyzer – able to manipulate several trace formats, would allow users to use the most relevant format for each application to analyze.
3 Instrumenting applications with EZTRACE
EZTRACE[14] has been designed to provide a simple way to trace parallel appli-cations. This framework relies on plugins in order to offer a generic way to ana-lyze programs; depending on the application to anaana-lyze or on the point to focus on, several modules can be loaded. EZTRACEprovides pre-defined plugins that give the ability to the user to analyze applications that use MPI libraries, OpenMP, or Pthreads. However, user-defined plugins can also be loaded in order to analyze ap-plication functions or custom libraries.
EZTRACEuses a two-phases mechanism for analyzing performance. During the
first phase that occurs while the application is executed, functions are intercepted and events are recorded. After the execution of the application, the post-mortem analysis phase is in charge of interpreting the recorded events. This two phase mech-anism permits the library to separate the recording of a function call from its inter-pretation. It thus allows the user to interpret a function call event in different ways depending on the point he/she wants to focus on. It also reduces the overhead of profiling a program; during the execution of the application, the analysis tool should avoid performing time-consuming tasks such as computing statistics or interpreting function calls.
3.1 Tracing the execution of an application
During the execution of the application, EZTRACEintercepts calls to the functions
specified by plugins and records events for each of them. Depending on the type of functions, EZTRACEuses two different mechanisms for interception. The functions
defined in shared libraries can be overriden using LD_PRELOAD: When the EZ-TRACElibrary is loaded, it retrieves the addresses of the functions to instrument.
When the application calls one of these functions, the version implemented in EZ-TRACE is called. This function records events and calls the actual function. The
LD_PRELOAD mechanism cannot be used for functions defined in the application since there is no symbol resolution. In that case, EZTRACEuses the DYNINST[2] tool for instrumenting the program on the fly. Using DYNINST, EZTRACEmodifies the program to record events at the beginning and/or at the end of each function to instrument.
For recording events, EZTRACErelies on theFXTlibrary [5]. Each process being instrumented by EZTRACEgenerates a trace file using FXT. In order to keep the
trace size as compact as possible,FXTrecords events in a binary format that contains
only the minimum amount of information: a timestamp, an event code and optional parameters.
3.2 Instrumenting an application
Since EZTRACEuses a two-phases mechanism, plugins are organized in two parts: the description of the functions to instrument, and the interpretation of each function call. During the execution of the application, the first part of the plugin is in charge of recording calls to a set of functions as described in Section 3.1. The second part of the plugin is in charge of adding semantic to the trace. EZTRACEprovides plug-ins for major parallel programming libraries (MPI, OpenMP, PThread, etc) but also allows user-defined plugins designed for custom libraries or applications. For exam-ple, the PLASMA linear algebra library [1] is shipped with an EZTRACEplugin.
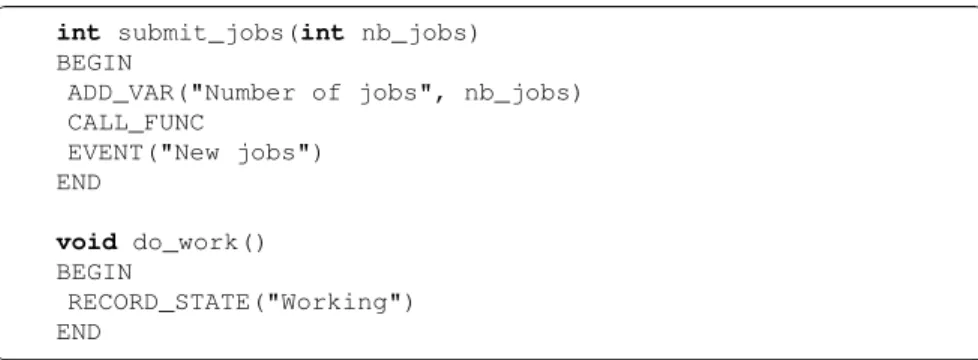
Fig. 1 Example of function instrumentation using the script language.
✞ ☎
int submit_jobs(int nb_jobs)
BEGIN
ADD_VAR("Number of jobs", nb_jobs) CALL_FUNC EVENT("New jobs") END void do_work() BEGIN RECORD_STATE("Working") END ✝ ✆
In order to ease the creation of a plugin, we designed a compiler that generates EZTRACEmodules from a simple script file. As depicted in Figure 1, such a script consists of a list of functions to instrument and the interpretation of each function. In this example, when the function submit_jobs is called, EZTRACEincreases the value of a counter, calls the original function, and creates an event. A call to do_workis represented as a change of the state in the output trace. This give the possibility to the users to create easily new EZTRACEmodules. Since the compiler
4 Creating trace files with GTG
During the post mortem analysis phase, EZTRACEbrowses the recorded events and
interprets them. It can then generate statistics – such as the length of messages, the duration of critical sections, etc. – or create a trace file for visualizing the ap-plication behavior. For generating trace files, EZTRACErelies on the Generic Trace
Generator (GTG) library1. GTG provides an abstract interface for recording traces.
This permits the application to use a single interface for creating traces in multiple formats. Thus, an application can generate PAJÉtraces or OTF files without any
modification.
4.1 Overview of GTG
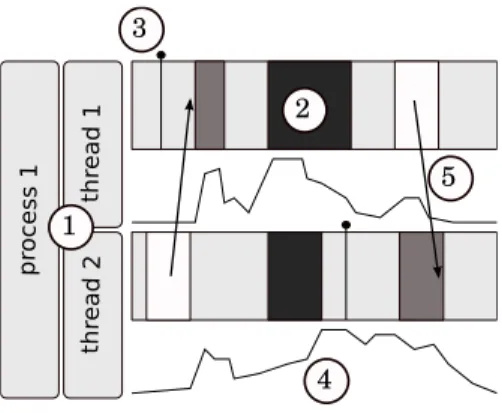
Although trace formats are different, most of them rely on the same structures and provide similar functionalities as it is depicted in Figure 2. A set of hierarchical con-tainers(1) represents processing entities such as processes, threads, or GPUs. These containers have states (2) that depict events that start at time T1and end at time T2
– the execution of a function, the processing of a computing kernel, a pending com-munication, etc. – Some events (3) (sometimes defined as markers) are immediate (i.e. T1= T2), and can represent the release of a mutex, the submission of a job,
etc. Most trace formats also provide a way to track a counter (4) such as the to-tal allocated memory, the number of pending jobs or the number of floating point operations per second. In order to symbolize the interaction between containers, trace formats often provide a link (5) feature: a couple of events that may happen on different containers. This permits the viewer tool to represent for example: commu-nications between processes, or signals between threads.
Fig. 2 Features commonly provided by trace formats.
pr oces s 1 th re ad 1 th re ad 2 1 2 3 4 5
GTG provides a simple interface for manipulating these features. This interface then calls one of the available modules depending on the output trace format.
4.2 Interaction between GTG and EZTRACE
Once EZTRACE is running along with the application, fxt traces are generated.
The second part of EZTRACE is based on GTG, and transforms the raw traces
to real meaningful traces. First a meaning is added (for example 42 represents an MPI_Sendrequest according to the MPI plugin). The semantic can represent links, events, states, etc. The hierarchical structure of the generated trace is PAJÉlike, al-thought OTF traces can also be generated. The containers can have states (’ This thread is in this function’), notify events, or count relevant data (number of mes-sages, memory used, number of jobs, etc). This step is based on the plugins (plugins give different meaning to the symbols). Using the EZTRACEconvert tool based on GTG, one can add meaning, define containers, and describe what is happening in a function.
Althought Pajé and OTF are both traces format, they have some differences. Thus, adding a meaning to a raw fxt event is the critical part and the event must be inter-preted in a way that is conformed to the output format choosen by the user. Other-wise, the traces will not represent the data they should.
5 Analyzing trace files with VITE
The trace files generated by tools such as GTG or VAMPIRTRACEcan be parsed for extracting statistics – such as the average message size –, however, understanding the behavior and the performance of an application requires a more convenient tool. In this Section, we present VITE2– which stands for Visual Trace Explorer –, an
open-source multi-format trace visualizer.
5.1 A generic trace visualizer
Originally, the PAJÉ[8] trace visualizer was designed to analyze parallel
applica-tions using a simple yet generic trace format. The decline of PAJÉled students to
design a new PAJÉtrace viewer. VITE was designed as a generic trace visualizer,
and additional trace formats such as OTF and TAU were added later. To manage multiple formats, VITE relies on a module architecture as depicted in Figure 3.
Fig. 3 Modules architecture in VITE.
OpenGL SVG PNG
OTF Pajé TAU
Parsers Generic Trace Model
Viewers
Core
A set of modules are in charge of parsing traces and filling the generic data struc-ture. VITE implements parsers for several trace formats: OTF, PAJÉ, extended PAJÉ
(a multiple files PAJÉformat) and TAU formats. Filling the generic data structure is
a critical part of VITE: traces may have millions of events and their processing –
storing events, browsing through the event list, finding associated data, etc. – has to be efficient. The last modules are in charge of rendering traces. Such a module uses the data structure to display the trace as requested by the user. A graphical interface based on QT and OpenGL allows for user-friendly browsing of the trace. Additional rendering modules generate SVG or PNG files depicting traces to easily export the results.
Although trace formats are different in their design, most of them provide similar functionalities. VITE implements a generic data structure and manipulates abstract objects representing the different features defined by trace formats. This abstrac-tion permits the developpers to easily implement addiabstrac-tional parsers for new trace formats, while rendering traces in a homogeneous way.
5.2 Displaying millions of events
VITE is able to display millions of items. To manage such performances, an
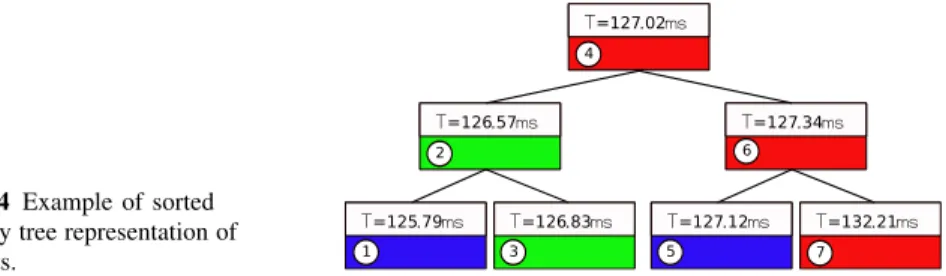
on sorted binary trees, as depicted in Figure 4. Thanks to these trees, any element can be accessed in logarithmic time and unneeded branches of the tree can be avoided.
Fig. 4 Example of sorted binary tree representation of events. T=127.02ms T=126.57ms T=127.34ms T=127.12ms T=132.21ms T=126.83ms T=125.79ms 1 2 3 4 6 5 7
The binary tree structure is also useful for rendering the trace. In order to avoid creating millions of graphical elements, portions of the trace have to be summarized. VITE uses a resolution parameter for eliminating the events that are too small to be rendered: if a node and his father are too close, then the resolution will not be enough for displaying them, and it is useless to keep on browsing all the nodes between the two (the subtree of the node on the same side as the father). For example, when rendering the binary tree depicted in Figure 4 with a resolution of 1 ms, VITE
browses event # 4. It then handles # 2. Since the interval between events # 2 and # 4 is lower than the resolution (T#4− T#2<1ms), event # 3 is not taken into account. Event # 1 is then handled normally. Then, VITE processes event # 6. Event # 5 is
skipped since it is beneath the resolution (T#6− T#4<1ms) and event # 7 is handled normally. As a result, the number of elements to display, as well as the number of nodes to browse, is limited increasing the rendering performance. If the user zooms in, the resolution decreases and the same algorithm is used.
The rendering is also critical; OpenGL has been chosen after benchmarking sev-eral solutions based on Qt, GTK, SDL, GNUStep and JAVA. Despite the fact that Qt and GTK could provide a better and easier interaction with the trace, the OpenGL engine, with our own mouse placement detection, appeared to be the most scalable solution. Moreover, on some machines, OpenGL can benefit from hardware opti-mization with the GPU.
6 Evaluation
When analyzing the performance of parallel applications that generate millions of events, the performance of the analysis tool is important. The overhead of the in-strumentation should be as low as possible, and the visualization tool should allow a smooth browsing of the resulting trace. In this Section, we assess the performance of EZTRACE. We evaluate the raw performance of the instrumentation mechanisms
used in EZTRACEon a synthetic benchmark as well as on application kernels. The results of this evaluation were obtained on the CLUSTER0 platform. It is composed of 32 nodes, each being equipped with two 2.2 GHz dual-core OPTERON
(2214HE) CPUs featuring 4 GB of memory. The nodes are running Linux 2.6.32 and are interconnected through MYRINETMYRI-10G NICs. We compare EZTRACE
with VAMPIRTRACEin its 5.9 version.
6.1 Overhead of trace collection
In order to evaluate the raw overhead of program instrumentation, we use an MPI ping pong program. We measure the latency obtained for 16-bytes messages. We in-strument this program using the automatic (i.e. using LD_PRELOAD) and manual (i.e. using DYNINST) mechanisms described in Section 3.1, then we compare the overhead of using EZTRACEor VAMPIRTRACEto the performance obtained with-out instrumentation. For VAMPIRTRACE, the automatic instrumentation is obtained by using its MPI module. The manual instrumentation is obtained by inserting call to VT_USER_START and VT_USER_END in the application.
Table 1 shows the results we obtained. Using VAMPIRTRACEautomatic
instru-mentation degrades the latency by 1.1 µs while the manual instruinstru-mentation causes an overhead of 700 ns. The difference is due to the fact that VAMPIRTRACE
gen-erates events at the entry and the exit of functions in both instrumentations, but it also generates a SendMessage or ReceiveMessage event when the MPI module is selected.
Instrumenting the application with EZTRACEcauses an overhead of 700 ns for
both mechanisms. This is because EZTRACErecords events at the entry and the
exit of functions for both manual and automatic modes. The SendMessage and Re-ceiveMessageevents are generated during the post mortem phase.
Table 1 Results of the 16-bytes latency test Method Open MPI VampirTrace EZTrace Automatic 4.99 µs 6.12 µs 5.68 µs Manual 4.99 µs 5.71 µs 5.67 µs
6.2 NAS parallel benchmarks
In order to evaluate the overhead of EZTRACEon more realistic computing kernels,
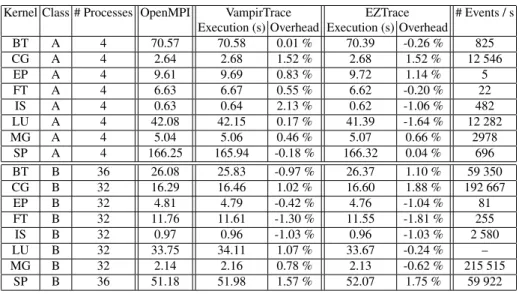
we also measure its performance for NAS application kernels. The experiment was carried out with 4 computing processes for Class A and 32 processes (or 36 for BT and SP that require a square number of processes) for Class B. We instrument MPI functions of these kernels with EZTRACEand VAMPIRTRACEautomatic modules.
Table 2 summarizes the results we obtained. Since EZTRACEpost mortemphase crashes for the LU kernel for Class B, the number of events in the resulting OTF
trace is not reported. The results show that instrumenting these kernels with EZ-TRACEor VAMPIRTRACEdoes not significantly affect the performance: variation
of the execution time is less than 2 %. This experiments also show that intensive event recording kernels – such as MG or CG for Class B – do not suffer from the overhead of the instrumentation.
Table 2 NAS Parallel Benchmark performance for Class A and B
Kernel Class # Processes OpenMPI VampirTrace EZTrace # Events / s Execution (s) Overhead Execution (s) Overhead
BT A 4 70.57 70.58 0.01 % 70.39 -0.26 % 825 CG A 4 2.64 2.68 1.52 % 2.68 1.52 % 12 546 EP A 4 9.61 9.69 0.83 % 9.72 1.14 % 5 FT A 4 6.63 6.67 0.55 % 6.62 -0.20 % 22 IS A 4 0.63 0.64 2.13 % 0.62 -1.06 % 482 LU A 4 42.08 42.15 0.17 % 41.39 -1.64 % 12 282 MG A 4 5.04 5.06 0.46 % 5.07 0.66 % 2978 SP A 4 166.25 165.94 -0.18 % 166.32 0.04 % 696 BT B 36 26.08 25.83 -0.97 % 26.37 1.10 % 59 350 CG B 32 16.29 16.46 1.02 % 16.60 1.88 % 192 667 EP B 32 4.81 4.79 -0.42 % 4.76 -1.04 % 81 FT B 32 11.76 11.61 -1.30 % 11.55 -1.81 % 255 IS B 32 0.97 0.96 -1.03 % 0.96 -1.03 % 2 580 LU B 32 33.75 34.11 1.07 % 33.67 -0.24 % – MG B 32 2.14 2.16 0.78 % 2.13 -0.62 % 215 515 SP B 36 51.18 51.98 1.57 % 52.07 1.75 % 59 922
7 Conclusion and future work
Programming a parallel application that efficiently exploits a supercomputer be-comes more and more tedious due to the increasing complexity of hardware – mul-ticore processors, NUMA architectures, GPGPUs, etc. – and the use of hybrid pro-gramming models that mix MPI, OpenMP or CUDA. Tuning such an application requires the programmer to precisely understand its behavior.
We proposed in this paper an open-source tool-chain for analyzing the perfor-mance of modern parallel applications. This software suite is composed of EZ-TRACE – a generic framework for instrumenting applications –, GTG – a tool for generating traces in multiple formats –, and VITE – a trace visualizer that supports several trace formats –. These tools were designed to provide an open-source alternative to other performance analysis tools, while allowing interoperabil-ity with other tools such as Vampir or TAU. The evaluation shows that this genericinteroperabil-ity does not imply extra overheads since EZTRACEprovides similar performance when
In the future, we plan to study more precisely the performance of the whole soft-ware suite and to improve it. Additional modules are to be developped in EZTRACE
in order to allow the analysis of programs running CUDA or OpenCL. We also plan to improve EZTRACEperformance analysis capabilities so that it can detect
pro-gramming or runtime issues such as network congestion or insufficient overlap of communication and computation. Future work concerning GTG includes the sup-port for other trace formats – such as TAU – and enhancing the API. We also plan to merge VITE and TRIVA[12] projects. TRIVAis based on PAJÉsoftware and
pro-vides new ways of displaying information such as treemaps, or network graphs that will benefit to ViTE. On the other side, TRIVAwill benefit from the multi-format
parser and from the OpenGL display.
References
1. Agullo, E., Demmel, J., Dongarra, J., Hadri, B., Kurzak, J., Langou, J., Ltaief, H., Luszczek, P., Tomov, S.: Numerical linear algebra on emerging architectures: The plasma and magma projects. In: Journal of Physics: Conference Series, vol. 180, p. 012037. IOP Publishing (2009) 2. Buck, B., Hollingsworth, J.: An API for runtime code patching. International Journal of High
Performance Computing Applications 14(4), 317–329 (2000)
3. Caubet, J., Gimenez, J., Labarta, J., DeRose, L., Vetter, J.: A dynamic tracing mechanism for performance analysis of OpenMP applications. OpenMP Shared Memory Parallel Program-ming pp. 53–67 (2001)
4. Chan, A., Gropp, W., Lusk, E.: An efficient format for nearly constant-time access to arbitrary time intervals in large trace files. Scientific Programming 16(2-3), 155–165 (2008)
5. Danjean, V., Namyst, R., Wacrenier, P.: An efficient multi-level trace toolkit for multi-threaded applications. Euro-Par 2005 Parallel Processing pp. 166–175 (2005)
6. Decugis, S., Reix, T.: NPTL Stabilization Project. In: Linux Symposium, vol. 2, p. 111 (2005) 7. Geimer, M., Wolf, F., Wylie, B., Ábrahám, E., Becker, D., Mohr, B.: The scalasca performance toolset architecture. Concurrency and Computation: Practice and Experience 22(6), 702–719 (2010)
8. de Kergommeaux, J., de Oliveira Stein, B.: Pajé: an extensible environment for visualizing multi-threaded programs executions. In: Euro-Par 2000 Parallel Processing, pp. 133–140. Springer (2000)
9. Knüpfer, A., Brendel, R., Brunst, H., Mix, H., Nagel, W.: Introducing the open trace format (OTF). Computational Science–ICCS 2006 pp. 526–533 (2006)
10. Knüpfer, A., Brunst, H., Doleschal, J., Jurenz, M., Lieber, M., Mickler, H., Müller, M., Nagel, W.: The Vampir Performance Analysis Tool-Set. Tools for High Performance Computing pp. 139–155 (2008)
11. Muller, M., Knüpfer, A., Jurenz, M., Lieber, M., Brunst, H., Mix, H., Nagel, W.: Develop-ing scalable applications with Vampir, VampirServer and VampirTrace. ProceedDevelop-ings of the Minisymposium on Scalability and Usability of HPC Programming Tools at PARCO (2007) 12. Schnorr, L.M., Huard, G., Navaux, P.O.: Triva: Interactive 3d visualization for performance
analysis of parallel applications. Future Generation Computer Systems 26(3), 348 – 358 (2010)
13. Shende, S., Malony, A.: The TAU parallel performance system. International Journal of High Performance Computing Applications 20(2), 287 (2006)
14. Trahay, F., Rue, F., Faverge, M., Ishikawa, Y., Namyst, R., Dongarra, J.: EZTrace: a generic framework for performance analysis. In: IEEE/ACM International Symposium on Cluster, Cloud and Grid Computing (CCGrid). Newport Beach, CA (2011)