HAL Id: hal-01401337
https://hal.archives-ouvertes.fr/hal-01401337
Submitted on 23 Nov 2016
HAL is a multi-disciplinary open access
archive for the deposit and dissemination of
sci-entific research documents, whether they are
pub-lished or not. The documents may come from
teaching and research institutions in France or
abroad, or from public or private research centers.
L’archive ouverte pluridisciplinaire HAL, est
destinée au dépôt et à la diffusion de documents
scientifiques de niveau recherche, publiés ou non,
émanant des établissements d’enseignement et de
recherche français ou étrangers, des laboratoires
publics ou privés.
Grégory Simon, F. Saliou, P. Chanclou, B. Le Guyader, L. Guillo, J.
Konopacki, F. Bourgart, D. Erasme
To cite this version:
Grégory Simon, F. Saliou, P. Chanclou, B. Le Guyader, L. Guillo, et al.. Focus on Time-Dependent
Wavelength Drift of DMLs Under Burst-Mode Operation for NG-PON2. Journal of Lightwave
Tech-nology, Institute of Electrical and Electronics Engineers (IEEE)/Optical Society of America(OSA),
2016, 34 (13), pp.3148-3154. �10.1109/JLT.2016.2552719�. �hal-01401337�
Abstract—Upstream time-dependent wavelength drift of
Directly Modulated Lasers (DMLs) under burst-mode operation is measured on a Second Next Generation Passive Optical Network (NG-PON2) pre-commercial system. A new measurement method is used to demonstrate that the ITU-T (International Telecommunication Union) recommendations on maximum wavelength drift excursion should be improved. Considering the proximity of the different wavelength channels in the ITU-T grid (down to 50GHz), the time-dependent wavelength drift of directly modulated optical emitters is shown to lead to communication degradation and may cause breakdowns. A way to mitigate this problem is proposed.
Index Terms—Adiabatic chirp, direct modulation, heterodyne
detection, second next generation passive optical network (NG-PON2), thermal chirp, time-dependent wavelength drift, time and wavelength division multiplexing (TWDM), time division multiplexing (TDM), wavelength division multiplexing (WDM).
I. INTRODUCTION
ONSTANTLY growing customer appetite for faster and cheaper information and communication technologies permanently challenges the different actors of the market (equipment suppliers, service providers, and independent test labs). For example, at the end of 2014 in Europe, 14.6 million people were connected to FTTH/B (Fiber to the Home/Building) networks, with a 50% market increase over the previous year [1].
In order to forecast future demands, the International Telecommunication Union (ITU-T) has standardized in 2015 the second Next Generation Passive Optical Networks, or
NG-Manuscript received February 11, 2016; revised March 30, 2016; accepted April 08, 2016.
This work was supported in part by the French National Research project LAMPION (grant n° ANR-13-INFR-0002).
Gaël Simon and Justine Konopacki are with both Orange Labs, 2 avenue Pierre Marzin, 22307, Lannion, France, and LTCI, CNRS, Télécom
ParisTech, Université Paris-Saclay, 75013, Paris, France (e-mail:
gael.simon@orange.com).
Fabienne Saliou, Philippe Chanclou, Bertrand Le Guyader, Laurent Guillo and Fabrice Bourgart are with Orange Labs, 2 avenue Pierre Marzin, 22307, Lannion, France (e-mail: philippe.chanclou@orange.com).
Didier Erasme is with LTCI, CNRS, Télécom ParisTech, Université
Paris-Saclay, 75013, Paris, France (e-mail: didier.erasme@telecom-paristech.fr).
PON2 (ITU-T G.989) as a solution for the optical access network. This recommendation associates two distinct PONs architectures, to be operated by the service provider depending on the use case and constraints.
The first solution, referred as a point-to-point Wavelength Division Multiplexing (PtP-WDM), is “a multiple wavelength PON that provides a dedicated wavelength for each end-user in both downstream and upstream directions” [2], based on colorless properties and supporting legacy Optical Distribution Network (ODN).
The second solution is an evolution from the point-to-multipoint G-PON (Gigabit-capable Passive Optical Network) architecture, but including a multiple wavelength aspect over the regular Time Division Multiplexing (TDM) structure and in which “each wavelength is shared between multiple Optical Network Units (ONUs) by employing TDM” [2]. The novelty, compared to pure TDM PON legacy, thus consists in the mix of Time and Wavelength Division Multiplexing (TWDM). This TWDM-PON solution is able to reach 40km range preferably with a passive plant, and to support a split ratio of at least 1:256, then possibly providing 256 customers. A total of 40Gb/s downstream bitrate is aimed at, with 4 wavelengths carrying a 10Gb/s signal each but an optional 80Gb/s downstream bitrate is also allowed [2] (8 wavelengths at 10Gb/s). In order to provide coexistence with legacy PONs and restrain the required spectral occupation, a Dense WDM (D-WDM) has been selected with Channel Spacing (CS) between optical carriers varying from 200GHz down to 50GHz.
Another NG-PON2 request is that ONUs must be colorless, i.e. not specific to a certain wavelength, in order to bring some flexibility to the network operation. The low cost and broad deployment constraints of the access network have put forward the use of direct modulation of Distributed Feedback semiconductor lasers (DFB) [3] that have demonstrated high modulation bandwidth, reliable technological maturity and whose wavelength can be temperature tuned so as to match the colorless requirement. Pre-calibration of each emitter wavelength and remote wavelength loop control from the Optical Line Termination (OLT) constitute some of the proposed tuning solutions.
For upstream, time division multiple access requires burst mode operation of the optical source located in the ONU. The
Focus on Time-Dependent Wavelength Drift
of DMLs under Burst-Mode Operation
for NG-PON2
Gaël Simon, Fabienne Saliou, Philippe Chanclou, Bertrand Le Guyader, Laurent Guillo,
Justine Konopacki, Fabrice Bourgart and Didier Erasme
directly modulated laser is electrical-current modulated with a data upstream signal at 2.5Gb/s or 10Gb/s (both possibilities are allowed) during bursts and switched off between bursts. Current biased semiconductor lasers suffer from self-heating, leading to a temperature swing between burst and inter-burst periods. A time-dependent wavelength drift (here often referred as “wavelength drift”, “frequency drift”, or “drift”) is induced by the phenomenon known as “thermal chirp” [4]-[6] as well as the adiabatic chirp related to the laser bias level [7]-[9].
The wavelength window allocated to uplink transmission in previous ITU TDM PON technologies (for example: 20nm for upstream XG-PON1) is sufficiently large to prevent any consequences from this phenomenon. On the contrary, the small channel spacing (from 200GHz down to 50GHz) of the four to eight TWDM NG-PON2 wavelength channels makes the technology sensitive to this time-dependent wavelength drift, potentially associated with a tuning error of the colorless-ONU emitting wavelength. The signal of an emitter whose wavelength is drifting out of the allocated band can be temporary filtered out by the demultiplexer at the OLT side. Furthermore, drifting away from its allocated wavelength span, the signal can cause interchannel interferences on neighboring channels.
We propose here a synthesis of our previous works on the time-dependent wavelength drift of DMLs under burst-mode operation for TWDM [10], [11] with a complementary description of drift measurements methods and new results. The ITU-T recommendations are recalled in Section II and compared to the spectral measurements done on a pre-commercial TWDM NG-PON2 system. We then propose and confront two time-dependent wavelength drift measurement methods in Section III. In Section IV, time-dependent measurements are performed on the pre-commercial system, and confronted to spectral measurements.
II. WAVELENGTH ACCURACY RECOMMENDATIONS AND
SPECTRAL ASSESSMENT OF A PRE-COMMERCIAL PROTOTYPE
ITU-T G989.2 recommendations do not explicitly propose any method to measure time-dependent wavelength drift. However, according to the following spectral definitions, the spectral measurement implicitly proposed is applied to a TWDM-PON pre-commercial system.
A. ITU-T G989.2 Recommendations on Spectral Excursion
The International Telecommunication Union has produced several recommendations to take into account the wavelength accuracy of the emission at the ONU. In G989.2 [2] the Maximum Spectral Excursion (MSE) is “specified as a one-sided deviation from the peak wavelength”. The maximum spectral excursion value depends on the channel spacing as follows:
+/- 12.5GHz for 50GHz channel spacing +/- 20GHz for 100GHz channel spacing +/- 25GHz for 200GHz channel spacing
The SSW defined as the single-sided -15dB spectral width of the modulated signal cannot exceed the MSE. Consequently, the Maximum Tuning Error (MTE) [2] corresponds to:
MTE = MSE – SSW (1)
B. System Under Test
A TWDM NG-PON2 pre-commercial system is being assessed with respect to wavelength ITU-T recommendation. The system presents four 100GHz spaced channels for both downstream and upstream directions. At the OLT side, each one of the four emitters is able to send data at 10Gb/s in L-band. At the other end, two ONUs (called “ONU A” and “ONU B”) provide non-return to zero data bursts at 10Gb/s. The wavelength of the pre-calibrated ONU emitters (no remote wavelength loop control is embedded) can be tuned to reach each one of the four channels by warming or cooling the chips with a thermoelectric cooler. The demultiplexer (DeMUX) at the OLT side has flattop 80GHz full-width-at-half-maximum wide channels. The system demonstrated its capacity to provide error free bidirectional traffics.
C. Spectral measurement of the ONU signal
A 125µs period electrical signal that includes a 59µs long optical burst modulates ONU A’s laser. Figure 1 presents the optical power spectral density (PSD) of the ONU transmitter signal measured with an optical spectrum analyzer (blue solid lines) averaging several identical bursts over a few seconds. According to the MSE and MTE definitions, a non-affordable tuning error would correspond on Fig. 1 to the cases where the blue line crosses one of the black dashed rectangles that have been positioned so as to correspond to a MSE of +/-20GHz (100GHz CS case). In the case of Fig. 1 one can observe a tuning error of about 5GHz. This also implies that the -15dB total bandwidth (BW) cannot exceed twice the MSE at the risk of getting spectrally out-of-band.
The full -15dB BW of the ONU tunable source is depicted in Table. I for various burst lengths. Short bursts (<30µs)
Fig. 1. ONU A optical power spectral density when emitting a 59µs long burst (blue solid lines), DeMUX transfer function (red dotted lines), and non-recommended zones (black dashed rectangles).
[Resolution bandwidth: 20pm/2.5GHz @1550nm] Burst duration (µs) Burst periodicity (µs) -15dB bandwidth (GHz) 16 125 x 2 62.5 30 125 x 1 44.3 59 125 x 1 20.8 88 125 x 1 17 257 125 x 3 19.9
present full -15dB BW exceeding twice the MSE (40GHz). However, since a wide bandwidth flattop DeMUX is used here and since the emitter’s wavelength is centered (with pre-calibration), no impairments on transmissions were observed when demultiplexing.
III. TIME-DOMAIN WAVELENGTH DRIFT MEASUREMENTS
METHODS FOR DMLS UNDER BURST MODE OPERATION
Several methods were proposed to verify the accuracy of the spectral measurements of the wavelength drift [5], [10]-[16]. Assuming this effect to be time-related, most of these methods are based on time-resolved measurements, such as the periodic filter method presented in [12]. Two time-dependent methods are presented in this part and compared with one another in order to verify the accuracy of the results of the following sections.
A. Filter Edge Method
Based on a band-edge optical filtering, the method, which experimental setup is presented on Fig. 2.a, transforms an optical frequency deviation into an optical intensity modulation [5], [13]-[15]. The edge of the optical filter must be positioned in terms of wavelength so as to overlap with the wavelength range swept by the optical signal to be measured during the burst. The instantaneous frequency is extracted at successive time samples from the ratio of the magnitude of the optical signals with and without filter. A filter edge as linear as possible simplifies the offline processing.
B. Heterodyne Detection Method
Heterodyne detection basically consists in transposing a high frequency signal (the DML optical frequency in our case) to a lower frequency using a Local Oscillator (LO).
The optical signal emitted by the continuous-wave (CW) low phase noise external cavity tunable laser acting as LO at frequency fLO is mixed with a sample of the optical signal
emitted by the DML under test which optical instantaneous frequency fs(t) is time dependent, as presented in the setup of
Fig. 2.b. The local oscillator wavelength is tuned so that the
intensity oscillation occurring at the frequency difference between both optical signals (fs(t) – fLO) falls within the
bandwidth of the quadratic photoreceiver. Then the latter transforms this oscillation into an electrical signal.
Experimentally, a 100Gbit/s DP-QPSK commercial coherent receiver, which includes a pair of balanced detectors, electrically subtracts away the DC electrical components resulting from detection of the average optical intensity of both lasers. The electrical beating signal is captured by the Digital Storage Oscilloscope (DSO). If the LO optical signal is considered as static in amplitude and phase, this electrical signal is a direct transposition of the optical signal at frequency fs(t) to the electrical signal at frequency (fs(t) – fLO)
that will include all the intensity and frequency variation of the former. A wavelength drift of the DML will be transposed directly onto the frequency of the received electrical signal. When containing data, the intensity steps between ones and zeros will be captured as well as instantaneous frequency variation between the same ones and zeros (see Fig. 3) resulting from the laser chirped modulation [7]-[10]. A variant of this setup, only using a unique photodiode and few passive optical components was presented in [10].
The offline processing used to extract the instantaneous frequency of the beating signal captured by the DSO is done in two steps. First, phase and envelope of the beating signal are extracted with a Hilbert transform [17].
Then, the phase of the beating signal is derived and smoothed (using Savitzky-Golay algorithm [18]), in order to calculate the instantaneous frequency.
On the other side, the ones and zeros of the optical burst signal can be discriminated in using a threshold. The samples corresponding to the instantaneous frequency of the logical ones data bits can be separated from those of the logical zeros, assuming an accurate synchronization of the entries realized with a cross-correlation between the envelope of the beating signal and the optical burst signal. Thus, only the instantaneous frequency of the logical ones is interpolated, in order to simplify the results analysis.
The method only covers an optical frequency span as wide as twice the bandwidth of the photodiode. In order to cover the entire spectrum, several successive measurements may have to be made, shifting the LO wavelength, or several detectors and local oscillators may be used simultaneously.
C. Comparison of the Methods
Both methods are then compared. This time the device
Fig. 3. a) Optical signal and b) corresponding instantaneous frequency of a non-commercial modulated DFB laser (Scale: 0.005µs/div) [10]
Fig. 2. Filter edge wavelength drift measurement setup (a), and heterodyne detection wavelength drift measurement setup (b)
under test is a commercial DFB laser (separate from the previously described pre-commercial system), emitting at 1542nm and directly modulated by a 125µs-period step signal consisting of 79µs during which the laser is biased at twice its threshold current (36mA) and 46µs remaining when it is switched off. The optical signal is split into two parts: one goes to the programmable filter setup for filter-edge measurement; the other is send to the 100Gb/s coherent DP-QPSK commercial receiver for heterodyne detection.
The transfer function of the programmable optical filter has a 0.01GHz-1 linear slope.
The LO is an external cavity tunable laser whose wavelength is set to 1542.25nm. The 14GHz photodiode bandwidth covers a 28GHz optical band.
The results are displayed in Fig. 4. It appears that the wavelength drift measured using both methods match perfectly. Thus, the contrast between the measurement methods comforts the validity of the results presented in the following sections.
In practice, the filter edge method uses a simple offline processing but its difficulty consists in finding a well-suited optical filter. Moreover, in order not to distort the burst shape, the CW component must be captured; finding a broadband photodector with a transimpedance amplifier that does not filter-out low frequency components is practically difficult. For available equipment reasons, the heterodyne method is used in the remaining sections of this paper.
The heterodyne detection method allows a wide observation range (O and C bands) with a high accuracy. Time resolution can be lower than the bit duration at 10Gb/s [10], [11]). However, its main drawback is the relatively complex offline processing.
IV. TIME-DEPENDENT WAVELENGTH DRIFT MEASUREMENTS
Time-dependent wavelength drift measurements are performed on the pre-commercial TWDM-PON product
presented in Section II, whose emitters are thermoelectrically cooled. The wavelength drift results are expressed in GHz and then refer to the optical frequency (equivalent to the wavelength), to be compared in section IV-C to MSE and MTE. First, the signal consisting of a 59µs long optical burst emitted every 125µs (which optical spectrum has been displayed in Fig. 1) is shown on Fig. 5.a. The corresponding computed time-dependent wavelength drift measurement is presented on Fig. 5.c bottom. In the present case, a total time- dependent drift of 52GHz is measured. As can be observed, a major evolution occurs within the first few nanoseconds. A zoom on this part is thus required.
A. First few Nanoseconds of the burst
Zooming on the first 0.3µs of the burst reveals a switch-on overshoot occurring from 0 to 40ns as seen in Fig. 5.b.
Comparing Fig. 5.b and Fig. 5.d the relation between the evolution of the optical frequency and the amplitude of the signal can be analyzed:
- The optical frequency is dragged toward high optical frequencies (“blue” wavelengths) when the optical power increases during the rising edge of the overshoot occurring between 0 and 10ns,
- The optical frequency then decreases (“red” wavelengths) when the optical power decreases on the falling edge of the overshoot from t=10ns to t=40ns. This behavior is consistent with the adiabatic chirp [7]-[9]. The overshoot induces a 19GHz drift in each ONU A burst, which in this 59µs long burst case corresponds to one third of the 52GHz overall drift. Avoiding burst overshoot could significantly reduce the total drift and its resulting effects.
B. Overall Bursts, and description of the phenomenon
After the overshoot, for the remaining part of the burst, the envelope of the optical intensity signal is relatively constant (see Fig 5.a). On the other hand, the optical frequency keeps increasing (see Fig 5.c), slowly in comparison with the first
Fig. 4. Commercial DFB laser wavelength drift measurement with heterodyne and filter edge methods (Scale: 10µs/div)
Fig. 5. Optical burst (top) and corresponding short term wavelength drift (bottom), over the entire burst (a and c) and over the first 300ns of the burst (b and d)
40ns. This slow evolution can be interpreted as the effect of the thermal chirp [4]-[6], which is induced by the fast thermal response of the various layers of the laser structure to electrical current flowing across the junction. The resulting material refractive index evolution induces fluctuation in the emitted wavelength, dragging the optical frequency to the low frequencies (“red” wavelengths).
Having different dimensions each layer of the laser acts as a low pass filter with a corresponding time response “τn”, and
relative magnitude “an”. The thermal chirp impulse response
can be expressed as [4]-[6]:
n n nt
a
t
h
(
)
.
exp
(2)The following parameters where used to fit to the wavelength drift of Fig. 5.c (black dashed curve):
- τ1=0.1, τ2=2, τ3=10, τ4=120, τ5=300 (µs).
- a1=70, a2=5, a3=0.65, a4=0.175, a5=0.05 (GHz/µs)
The time-dependent wavelength drift is then measured for both ONU A and ONU B, for various burst profiles. These burst profiles are obtained depending on the parameters of the Dynamic Bandwidth Allocation algorithm (DBA) of the system, located at the OLT. The DBA, whose mission is to improve network performance in introducing flexibility to the network, defines upstream burst duration and periodicity [19] depending among others on the number of customers, their subscribed services and actual traffic load. As presented in column 2 of Table. 2, the burst periodicity is always a multiple of 125µs.
The drift measurement results for both ONU A and ONU B are presented in Table. 2. According to the previously presented model (2), the layers of the chip act as a sum of low-pass filters. Then, the bursts being periodically emitted, the relaxation duration between two burst emissions (column 3 of Table. 2), which allows the chip to cool down between two emissions, must be taken into account. Too short relaxation duration prevents the temperature of the chip to cool down, and the next burst emission reaches faster its saturation value. As a result, the frequency swing and then the drift are reduced. It corresponds in Table. 2 to the 384µs long burst profile with 116µs relaxation, which is the longest burst measured but which does not correspond to the largest wavelength drift (51.5GHz for ONU A).
Then, having the longest emission duration and the longest relaxation duration, the 128µs long burst profile with 997µs relaxation presents the maximum wavelength drift, 62.5GHz for ONU A.
More generally, according to the model (2), the maximum drift would appear for a given burst cycle when the emission
duration equals the relaxation duration (warming equals cooling). Increasing the burst cycle, in keeping emission duration equal to relaxation duration, would also increase the temperature swing and then increase the wavelength drift.
According to the previous results, an idea could be to decrease the burst periodicity in acting on the DBA, and also to lower burst relaxation or burst duration in order to reduce the total wavelength drift. However, it has been demonstrated both theoretically and experimentally [4]-[10] that in most cases several time constants of the layers of the laser are very small (τ1=0.1µs and τ2=2µs in our example of Fig. 5.c), and
will still have enough time to express. The drift reduction obtained with respect to longer bursts or cycles is then limited.
C. Comparison of Spectral and Time-Dependent Measurements
Figure 6.c shows the optical Power Spectral Density (PSD) measurement of the previously described 59µs-long-burst/125µs-period signal, measured with an Optical Spectrum Analyzer (OSA). Having a total 21GHz asymmetrical -15dB BW, the “low wavelength” (or “red”) single-sided -15dB BW is measured to be 13GHz. The 100GHz channel-spacing MSE mask (black rectangles) is positioned in the graph so as to reach the Maximum Tuning Error affordable. Keeping in mind the colorless component of NG-PON2 described in the introduction, this intra-channel detuning can be induced in operational conditions by the lack of accuracy of a tuning mechanism.
Figures 6.a and 6.b recalls the 59µs-long-burst and 125µs-period time-related signal and the corresponding wavelength
Fig. 6. Optical burst (a) and corresponding drift (b) compared to the optical spectrum (c), when emitting a 59µs long signal.
TABLEII
TOTAL WAVELENGTH DRIFTS MEASUREMENTS FOR “ONUA” AND “ONUB”
Burst duration (µs) Burst periodicity (µs) Relaxation duration (µs)
Total drift of ONU A (GHz)
Total drift of ONU B (GHz) 16 125 x 2 234 45.5 34 59 125 x 1 66 52 38 88 125 x 1 37 54 37 128 125 x 9 997 62.5 45.5 257 125 x 3 118 58 43.5 384 125 x 4 116 51.5 40
drift previously displayed on Fig. 5. Since the wavelength drifts quickly at the beginning of the burst and slowly at its end, and since the envelope of the optical intensity signal is relatively constant after the overshoot, the final PSD of Fig 6.c appears to be asymmetrical. Furthermore, the optical PSD peak on Fig. 6.c is assumed to correspond to the last part of the burst, when the wavelength drifts slowly and constitutes a longer part of the pattern.
We consider the signal to be out-of-band when the instantaneous frequency is not in the optical frequency span defined by the channel center plus or minus the MSE. Then, during the first 6µs of this 59µs long burst example, the central instantaneous frequency of the optical signal is out-of-band, as if during that period the wavelength tuning was unacceptable. This effect cannot be seen in using the simple measurement of the PSD despite the asymmetry of the spectrum.
Repeating the previous positioning procedure, Fig. 7 displays the time-dependent drift measurement, the low wavelength single-sided spectral width at -15dB, and time during which the central frequency is “out-of-band” versus burst lengths. Out-of-band durations as long as 20µs are measured, for the 257µs long burst.
The detuning is here always artificially introduced with an offline processing in order to make the PSD appear at out-of-band limit. However, this detuning can result in a tuning error since the NG-PON2 emitters must be colorless, according to ITU-T recommendations.
In conclusion it would appear that a simple optical PSD measurement could lead to an under-estimation of the consequence of the time-dependent wavelength drift of DMLs under burst-mode operation. Therefore the MSE and MTE criteria definitions and the drift measurement methods should be improved to take into account this time-dependent wavelength drift.
D. Consequences of an Under-Estimation of the Wavelength Drift, and Possible Solution
The consequences of an out-of-band drift will depend on the demultiplexer characteristics (channel spacing, channel isolation, Gaussian or flattop shape) which are not defined in [2] and so, as in the pre-commercial system, do not necessarily
have a bandwidth of twice the MSE. However, two problems may then occur when under-estimating the drift:
- Parasitic data can be introduced on neighboring channels. This impairment will appear at anytime during the neighbor burst existence (tuning, ranging or operating phase). This is more likely to happen when the channel spacing is small, i.e. 50GHz. This impairment will be related to the demultiplexer adjacent channel isolation.
- Data can also be erased on the considered channel. As on Fig. 6, this phenomenon will mostly impact the beginning of the burst, which will not be detected because out-of-band, but will actually be out of the wavelength demultiplexer pass band.
The first problem could be solved in increasing the Channel Spacing (to 100GHz or even 200GHz), but this solution will lead to a reduction of both the spectral efficiency and the global system bit rate when reducing the number of channels from 8 to 4. On the other side, considering the wide wavelength range to be covered by the emitter, the low cost thermal wavelength tuning would be excluded if a high number of channels had to coexist with large channel spacing.
A way to solve the second problem, which only considers one channel, could be to send padding data (“Padd” in (3)) just before the preamble of the burst. This will provide a delay for the emitter to warm up and to reach in-band frequency before sending preamble (“Pre” in (3)), delimiter (“Del” in (3)) and payload. Padding data length must be longer than to the Out-Of-Band Time presented on Fig. 6. However, the burst efficiency “η”, which we define in (3) as the ratio of the number of useful bytes sent by the total number of bytes sent, will be affected.
Burst]
[Tot.
)
-(1
.
Padd)]
+
Del
+
(Pre
-Burst
[Tot.
(3)where “α” is the Forward Error Correction (FEC) overhead factor.
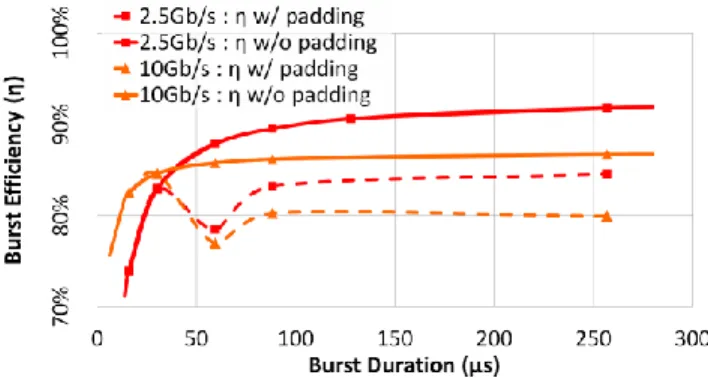
An example of the burst efficiency versus burst length is presented on Fig. 8. The following parameters are used:
- Upstream Bit rate: 2.5Gb/s or 10Gb/s (both allowed [20]) - Padding length: Out-Of-Band Time, assumed to be independent of the bit rate
Fig. 7. Spectrally measured “low wavelength” single-sided -15dB bandwidth (black solid lines), time-dependent wavelength drift measurements (grey dashed lines), and potential out-of-band duration (blue dotted lines), for several burst duration.
Fig. 8. Burst efficiency with (dashed lines) and without (solid lines) padding drift compensation, at 2.5Gb/s (red / squares) and 10Gb/s (orange / triangles).
- Preamble: 8 bytes repeated 127 times (max. allowed [20]) - Delimiter: 8 bytes (max. allowed [20])
- FEC frame overhead factor: 7% and 13% (Reed Solomon RS(248,232) and RS(248,216) [20] at 2.5Gb/s and 10Gb/s respectively).
For long bursts (above 20µs), Fig. 8 shows that the padding data introduce a significant burst efficiency reduction, for both 2.5Gb/s and 10Gb/s cases. For example, at 2.5Gb/s (squares) for the 59µs long burst, the burst efficiency is reduced from 87.9% without padding (solid lines), to 78.5% (dashed lines).
Both previously presented solutions are complementary since each of them only solves one of the two presented problems. Several other methods have also been proposed in the literature to compensate the time-dependent wavelength drift of DMLs [5], [12], [15], [16], [21], some of them are based on a compensation mechanism while others use other types of semiconductor lasers (Distributed Bragg Reflector lasers for example).
V. CONCLUSION
The upstream time-dependent wavelength drift of DMLs under burst-mode operation was measured on a Time and Wavelength Division Multiplexing pre-commercial system. Being induced by both thermal and adiabatic chirps on directly modulated emitters, this drift remains a major complication for TWDM NG-PON2 compared to TDM-PON legacy. The previous measurements demonstrated that the overshoot at the beginning of the burst was able to induce 19GHz of the total drift in only 40ns. Then, a total drift of up to 62GHz was measured.
The experiments tend to prove that TWDM NG-PON2 recommendations needs to consider this time-dependent wavelength drift. Under-estimation, added to a potential imperfect wavelength tuning of the colorless emitters, could lead to unaffordable impairments depending on the wavelength demultiplexer characteristics. Then, the current recommendations should enforce tighter short-term wavelength drift measurements and adjust the maximum excursion definitions.
ACKNOWLEDGMENT
The authors wish to thank the vendor, for the loan of the pre-commercial system.
REFERENCES
[1] Fibre to the Home Council Europe, "FTTH subscribers in Europe: nearly 15 million homes!", Press release, Feb. 2015, Available online:
http://www.ftthcouncil.eu/documents/PressReleases/2015/PR2015_FTT H_Subscribers.pdf
[2] 40-Gigabit-capable passive optical networks 2 (NG-PON2): Physical
media dependent (PMD) layer specification, ITU-T G989.2, 2015
[3] Nesset, D., "NG-PON2 Technology and Standards," in Lightwave Technology, Journal of , vol.33, no.5, pp.1136-1143, March1, 1 2015 doi: 10.1109/JLT.2015.2389115
[4] Shalom, H.; Zadok, A.; Tur, M.; Legg, P.J.; Cornwell, W.D.; Andonovic, Ivan, "On the various time constants of wavelength
changes of a DFB laser under direct modulation," in Quantum Electronics, IEEE Journal of , vol.34, no.10, pp.1816 -1822, Oct 1998, doi: 10.1109/3.720212
[5] Mulvihill, G.; O'Dowd, R., "Thermal transient measurement, modeling, and compensation of a widely tunable laser for an optically switched network," in Lightwave Technology, Journal of , vol.23, no.12, pp.4101-4109, Dec. 2005, doi: 10.1109/JLT.2005.858238
[6] Vicente de Vera, E.G.; Glance, B., "Switching-time limitation in tunable multisection lasers," in Photonics Technology Letters, IEEE , vol.2, no.11, pp.781-783, Nov. 1990, doi: 10.1109/68.63219
[7] G. P. Agrawal and N. K. Dutta, “Rate equations and operating characteristics,” in Long-Wavelength Semiconductor Lasers, 1st ed. New York: Van Nostrand Reinhold, 1986, pp. 263-284
[8] Krehlik, P., "Characterization of semiconductor laser frequency chirp based on signal distortion in dispersive optical fiber", Opt-Elec. Rev., Vol. 14, Iss. 2, pp.119-124
[9] Koch, T.L.; Bowers, J.E., "Nature of wavelength chirping in directly modulated semiconductor lasers," in Electronics Letters , vol.20, no.25, pp.1038-1040, December 6 1984, doi: 10.1049/el:19840709
[10] Simon, G.; Saliou, F.; Chanclou, P.; Le Guyader, B.; Guillo, L.; Erasme, D., "Accurate wavelength drift measurements of NGPON2 tunable lasers candidates," in Optical Communication (ECOC), 2015 European Conference on , vol., no., pp.1-3, Sept. 27 2015-Oct. 1 2015, doi: 10.1109/ECOC.2015.7341823
[11] Simon, G.; Saliou, F.; Chanclou, P.; Le Guyader, B.; Konopacki, J.; Bourgart, F.; Erasme, D., " Spectral and Temporal Analysis of the NGPON2 Short-Term Wavelength Drift for 10Gbit/s Bursts," in Optical Fiber Communications Conference and Exhibition (OFC), 2016 , Paper W4C.2
[12] Van Veen, D.; Pohlmann, W.; Farah, B.; Pfeiffer, T.; Vetter, P., "Measurement and mitigation of wavelength drift due to self-heating of tunable burst-mode DML for TWDM-PON," in Optical Fiber Communications Conference and Exhibition (OFC), 2014 , vol., no., pp.1-3, 9-13 March 2014, doi: 10.1364/OFC.2014.W1D.6
[13] Anandarajah, P.M.; Kaszubowska, A.; Maher, R.; Barry, L.P., "Wavelength tunable lasers in future optical communication systems," in Transparent Optical Networks, 2008. ICTON 2008. 10th Anniversary International Conference on , vol.2, no., pp.109-109, 22-26 June 2008, doi: 10.1109/ICTON.2008.4598604
[14] Poehlmann, W.; van Veen, D.; Schmuck, H.; Deppisch, B.; Bonk, R.; Pfeiffer, T., "Measurement of direct modulated lasers frequency-drift in burst-mode and impact on narrowly filtered receivers," in Optical Fiber Communications Conference and Exhibition (OFC), 2015 , vol., no., pp.1-3, 22-26 March 2015, doi: 10.1364/OFC.2015.Th2A.61
[15] Buimovich, E.; Sadot, D., "Measurements of thermal frequency chirp in directly modulated DFB lasers and thermal transient induced frequency drift during fast tuning in GCSR lasers using frequency discrimination technique," in Lasers and Electro-Optics Society, 2003. LEOS 2003. The 16th Annual Meeting of the IEEE , vol.1, no., pp.208-209 vol.1, 27-28 Oct. 2003, doi: 10.1109/LEOS.2003.1251708
[16] Poehlmann, W.; van Veen, D.; Farah, R.; Pfeiffer, T.; Vetter, P., "Wavelength drift of burst-mode DML for TWDM-PON [invited]," in Optical Communications and Networking, IEEE/OSA Journal of , vol.7, no.1, pp.A44-A51, Jan. 2015, doi: 10.1364/JOCN.7.000A44
[17] F. W. King, Hilbert Transform, Cambridge University Press, 2009 [18] Savitzky A. et al., "Smoothing and differentiation of data by simplified
least squares procedures", Journ. of Anal. Chem., vol.36, no.8, pp.1627– 1639 (Oct 1964)
[19] Skubic, Bjorn; Jiajia Chen; Ahmed, J.; Wosinska, L.; Mukherjee, B., "A comparison of dynamic bandwidth allocation for EPON, GPON, and next-generation TDM PON," in Communications Magazine, IEEE , vol.47, no.3, pp.S40-S48, March 2009, doi: 10.1109/MCOM.2009.4804388
[20] 40-Gigabit-capable passive optical networks 2 (NG-PON2): Transmission Convergence Layer Specification, ITU-T G989.3, 2015
[21] Darvish, G.; Moravvej-Farshi, M.K.; Zarifkar, A.; Saghafi, K., "Precompensation Techniques to Suppress the Thermally Induced Wavelength Drift in Tunable DBR Lasers," in Quantum Electronics, IEEE Journal of , vol.44, no.10, pp.958-965, Oct. 2008, doi: 10.1109/JQE.2008.200130