Electronic copy available at: http://ssrn.com/abstract=1071624
Ownership, control and market liquidity
Edith Ginglinger and Jacques Hamon
aRevised draft: January 30, 2011
Abstract
We examine how ownership concentration and the separation of ownership and control affect secondary-market liquidity in France. We find that firms with a large insider blockholder exhibit significantly lower liquidity. However, different methods of enhancing control affect liquidity in different ways. Pyramid structures impair market liquidity. Double voting right shares, a French specific means of control enhancement rewarding long-term shareholders and restraining insiders from trading their shares, lead to increased liquidity, especially for family firms. Our results suggest that by using double voting rights to enhance their control, a transparent decoupling mechanism, rather than pyramids, an opaque decoupling mechanism, blockholders offer higher secondary-market liquidity to outside investors.
JEL classification: G32, G34, G10
Key words: ownership, blockholders, long-term shareholders, ultimate control, pyramids, voting rights, liquidity, bid-ask spread
a
DRM, Université Paris-Dauphine, place du Maréchal de Lattre, 75775 – Paris cedex 16 – [email protected], [email protected]. We are grateful for comments from Paul André, Eric de Bodt, François Degeorge, Ariadna Dumitrescu, Thierry Foucault, Ulrich Hege, Hubert de La Bruslerie, Ernst Maug, Christine Parlour, Christophe Perignon, Fabrice Riva, Myron Slovin, and Marie Sushka. We thank seminar participants at Universités Lille II, Rennes, Paris-Dauphine, as well as participants at the 2007 French Finance Association conference and the 2008 FMA conference in Prague. Both authors acknowledge partial financial support from Europlace Institut of Finance and Edith Ginglinger acknowledges financial support from the « Fédération Bancaire Française Chair in Corporate Finance ».
Electronic copy available at: http://ssrn.com/abstract=1071624
2
Ownership, control and market liquidity
Abstract
We examine how ownership concentration and the separation of ownership and control affect secondary-market liquidity in France. We find that firms with a large insider blockholder exhibit significantly lower liquidity. However, different methods of enhancing control affect liquidity in different ways. Pyramid structures impair market liquidity. Double voting right shares, a French specific means of control enhancement rewarding long-term shareholders and restraining insiders from trading their shares, lead to increased liquidity, especially for family firms. Our results suggest that by using double voting rights to enhance their control, a transparent decoupling mechanism, rather than pyramids, an opaque decoupling mechanism, blockholders offer higher secondary-market liquidity to outside investors.
JEL classification: G32, G34, G10
Key words: ownership, blockholders, long-term shareholders, ultimate control, pyramids, voting rights, liquidity, bid-ask spread
Electronic copy available at: http://ssrn.com/abstract=1071624
3 1. Introduction
Whether corporate governance affects market liquidity is a matter of much debate. Market liquidity is an important issue for investors and firms. Liquidity is a component of the transaction costs born by investors and a determinant of the cost of capital (Amihud and Mendelson, 1986, 1989 and Pastor and Stambaugh, 2003). Therefore, investors prefer to invest in liquid stock markets. There are two potential explanations for the association between ownership structure and secondary-market liquidity. First, the trading hypothesis posits that the liquidity of a stock is increasing in the free float, limited when a firm’s ownership is concentrated. Second, according to the adverse selection hypothesis, the presence of large informed shareholders should increase the adverse selection discount associated with the trading of the stock, which implies a reduced liquidity.
In this paper, we examine the effect of decoupling voting and economic rights of blockholders on adverse selection and market liquidity, and explore whether transparent and non transparent decoupling devices have different effects on liquidity. We study these issues within the French institutional setting, which is characterized by firms with concentrated ownership and large control-ownership deviations. French firms use two primary devices to enhance control: pyramid structures (18.5% of our sample) and a specific double voting right mechanism that rewards long-term shareholders (68.3% of the sample).1 In contrast to dual-class shares, double voting right shares and single voting right shares trade at the same price and on the same trading line. When a double voting right share is sold, it loses the second voting right. France is therefore an ideal laboratory to analyze the effect of decoupling shares from votes on secondary market liquidity.
4
We make three contributions to understanding the ownership-liquidity relation. First, we find that block ownership, whether measured directly or by ultimate ownership, is detrimental to the firm’s market liquidity. Second, controlling for free float[EG1], deviation of control from
ownership is associated with lower liquidity, confirming the adverse selection hypothesis. Third, different devices used to enhance control have different effects on liquidity, since pyramid structures impair liquidity, whereas double voting rights enhance liquidity. Double voting rights reduce the number of insiders trading on private information, because if an insider sells a share with the rights and buys it back, the share only has a single voting right. By using double voting rights to enhance their control rather than other devices, blockholders reduce the degree of asymmetric information and offer higher secondary market liquidity to outside investors.
This paper is related to three areas of recent research. One area is research that investigates the effect of blockholdings on liquidity. Several theoretical analyses, when considering the costs and benefits of ownership concentration, emphasize that increased market liquidity is a positive consequence of dispersed ownership (see for example Bolton and Von Tadden, 1998 and Maug, 1998). Block ownership can affect the firm’s market liquidity through two major mechanisms: by altering the firm’s trading activity (trading hypothesis) or by increasing the probability of informed trading (adverse selection hypothesis). One, in the presence of a large shareholder, only shares included in the free float are likely to be traded. Thus, the availability of shares is limited, fewer shareholders can participate in the trading of the stock, the frequency of trades is reduced (Demsetz, 1968) and the acquisition and production of information is discouraged (Holmström and Tirole, 1993). Two, concentrated ownership is potentially costly, because blockholders may have private information about firm value, and as a result of this higher probability of informed trading, liquidity providers widen spreads. A large body of
5
theoretical work describes how markets react to the presence of informed traders (see for example Glosten and Milgrom, 1985). Previous empirical studies that examine the impact of blockholders on market liquidity, mainly conducted on U.S. data, lead to ambiguous results, partly because they do not distinguish between insider and institutional blockholdings.2 More recently, Rubin (2007) documents a high negative correlation between insiders’ blockholdings and institutional holdings, confirming that institutions are more willing to invest in firms with less concentrated insider ownership. He reports that total institutional holdings have a negative effect on spreads, whereas institutional blockholdings widen spreads. Brockman, Chung and Yan (2009) find that block ownership impairs the firm’s market liquidity. However, in accordance
with the trading hypothesis, their results suggest that it is the relative lack of trading, and not the threat of informed trading that explains the inverse relation between block ownership and market liquidity. Using the SEC’s definition of insiders, our study concentrates on manager and controlling shareholder ownership. We do not take into account institutional investors, unless they control the firm. Our approach is further motivated by the fact that blockholdings are on average very large in France (more than 50% on average) relative to the U.S. where Rubin (2007) and Brockman et al. (2009) document that insider blockholdings are on average only 5%. Despite the different institutional environment and the more concentrated ownership of French firms, we also find a negative relation between blockholdings and liquidity, confirming previous results. However, in contrast to Brockman et al. (2009), we find that both adverse selection and trading effects are responsible for the negative effect on liquidity.
The second area of the literature related to our work concerns the relation between corporate governance characteristics and market liquidity. Prior research examines how internal and external corporate governance structures as well as control-ownership divergence affect firm
6
value, the cost of capital, and stock returns.3 Moreover, most previous studies examine the impact of ownership on liquidity within a one-share-one-vote setting. In this regard, the separation of control and cash-flows rights can have several effects on market liquidity. Control can generate private benefits for controlling shareholders and the presence of such benefits makes outside investors reluctant to buy the stock, reducing market liquidity. The ultimate owner may adopt a poor disclosure policy to be able to trade on private information. However, evidence on these effects is limited. Chung, Elder and Kim (2010) find that stocks of companies with better governance structures have narrower spreads, a higher market quality index, smaller price impact of trades, and a lower probability of information-based trading. To our knowledge, Attig, Fong, Gadhoum and Lang (2006) are the first to examine the relation between stock liquidity and ultimate ownership. Using a sample of Canadian publicly-traded firms for the year 1996, they find that a greater separation between ultimate control and ownership results in more severe information asymmetry and wider bid–ask spreads. We use a French sample of 1550 firm-year observations to examine the relation between ownership characteristics and market liquidity and find that the deviation of ultimate control from ownership has a negative impact on liquidity. We therefore extend the previous results for a longer period of analysis, within a different legal context, and also evaluate several measures of market liquidity.
A third area of the literature to which our work is related analyzes different control enhancing devices. In our work, the two primary methods that separate voting rights from cash flow rights are pyramiding and having different classes of shares that provide different voting rights for given cash flow rights. A pyramid structure allows indirect control of a firm by a chain of ownership relations that have only a small cash flow stake. Several studies relate firm valuation and pyramidal structure.4 In this paper, our aim is to relate pyramids to asymmetric
7
information and liquidity. Manconi and Massa (2008) find that organizational complexity, measured as the number of layers in the firm’s subsidiary structure, increases the asymmetry of
information between the firm and the market. Therefore, pyramids should have a negative impact on secondary-market liquidity. Through the use of different classes of shares, a controlling shareholder can achieve separation by owning the firm’s high vote shares and selling the shares with inferior or no voting rights.5 We investigate whether differential voting right structures have positive effects on market liquidity. First, by using higher voting right shares, a large shareholder can hold a lower fraction of the shares while ensuring control, which has a positive impact on liquidity (see for example Becht, 1999). Second, with dual-class shares or equivalent mechanisms, insiders generally hold superior voting right shares, and therefore, do not trade inferior voting right shares. As a consequence, the probability of market participants trading against insiders is reduced, increasing liquidity. Consistent whith this view, Boehmer, Sanger and Varshney (2004) show that the bid-ask spread of low voting right dual class shares is smaller because insiders hold shares with high voting rights. In the case of dual class shares, there are two trading lines, so liquidity may be split. Our paper focuses on a French specific device that allows double voting rights for registered shares, with the additional voting right lost when the shares are sold. Thus, blockholders have to choose between the double voting rights and the liquidity of their shares. In contrast to dual class shares, the double voting right share is sold as a single voting right share and on the same trading line. This characteristic makes it a better experiment than dual class shares to test the hypothesis of an impact of differential voting right shares on market liquidity, since the double voting rights is a disincentive for insiders to sell, but not to buy shares. However, insiders are more likely to sell in order to liquidate their holdings, unlike institutional investors, and double voting rights restrain insiders from sell/buy back transactions
8
on their stocks. Thus, the probability of market participants trading against informed traders is reduced in the presence of double voting right shares, implying increased liquidity for outside investors. Controlling for market and ownership characteristics, we find that pyramid structures reduce liquidity and increase asymmetric information on the French market, whereas firms that use double voting rights experiment improved secondary-market liquidity. Overall, our study confirms the adverse selection hypothesis to explain the ownership-liquidity relationship.
The remainder of the paper is organized as follows. In Section 2, we describe data and our calculation of ultimate ownership. In Section 3, liquidity measures and methodology are developed. In Section 4, empirical results are reported on the effects of controlling shareholders, control-ownership deviation, and the means of dissociation between ownership and control on secondary market liquidity. Section 5 summarizes and provides conclusions.
2. Data
2.1. Euronext data
We use the Euronext intraday database. Our dataset contains a time-stamped to the nearest second record of all transactions and orders submitted to the market from July 1998 to July 2003 for all French listed firms. The data include transaction prices, volume, and the best limits of the order book (bid and ask prices, and bid and ask size), as well as market capitalization.
Euronext Paris is an electronic limit order market. There are two main market models: continuous trading, for the more actively traded stocks, and a double auctions market for the less liquid stocks. A description can be found in Biais, Hillion, and Spatt (1999). A call auction determines the opening and closing price in the continuous market. Trading takes place continuously from 9.00 to 17.25.6Traders mainly use limit orders and market orders. Deferred
9
settlement is possible for a subset of the more liquid shares: this market segment is called “Reglement Mensuel” until 2000 and “Service à Réglement Différé” or SRD after 2000.7
For stocks eligible for the SRD, investors can submit buy or sell orders with settlement at the end of the month. Stocks eligible for the SRD are chosen by Euronext. For all other stocks, only cash trading is possible. All SRD stocks belong to the continuous market. The SRD market segment accounts for approximately 89% of the total market value of Euronext Paris, and 97% of the turnover. As SRD stocks are the more traded and more liquid stocks, we control for SRD eligibility in our regressions.
2.2. Ownership and governance in France
In France, as in most Western European countries, ownership tends to be concentrated. Faccio and Lang (2002) show that 36.93% of European firms are widely held, whereas in France this percentage is only 14%. In France, 64.82% of firms are controlled by a single family, versus 44.29% in Europe. In line with Faccio and Lang (2002) and earlier studies, we assume that 20% of the voting shares is sufficient to ensure control. If no shareholder exceeds the 20% threshold, the firm is said to be widely held.
French blockholders use several devices to enhance control. Apart from pyramids, the most common device is double voting rights. The firm’s charter can authorise double voting rights for registered shares that have been held for more than x years (where x is between 2 and 4 years). Like all decisions amending a firm’s charter, introducing or deleting double voting right shares requires an extraordinary general meeting with a two-thirds majority vote by shareholders to be adopted. In contrast to dual-class shares, the voting right is attached to the shareholder. Typically, controlling shareholders own double vote shares while most dispersed shareholders own single vote shares.
10
In addition to different per share votes, the charter may also include voting caps, which limit voting rights in general shareholders’ meetings to x% of all shares or to a certain percentage
of votes cast at the meeting. A cap means a shareholder can only use a certain percentage of his voting rights, but if he owns 2/3 of the capital, all voting rights can be used.
Finally, some French companies are limited partnership firms. These firms consist of partners who manage the firm, in addition to other shareholders. As the active partners’ shares are non-transferable and the charter makes removal of the managing partner practically impossible, this form of legal entity precludes hostile takeovers.
Since there is no electronic database on French firm ownership, including needed information on double voting rights and corporate governance characteristics, we manually collect this information from annual reports for three years 1998, 2000 and 2002. The ownership structures are as of the 31st December of each year. Our sample, which includes all French listed firms for which the annual reports are available, consists of 1550 firm-observations. In France, annual reports disclose the identity of all shareholders who control at least 5 percent of voting rights, and identify and cluster direct and indirect family ownership. For example, if a family owns 10% directly and 30% through an unlisted holding entity belonging to the family, the annual report discloses the total family ownership of 40%. Since there are numerous family holdings, and family ownership is aggregated we observe fewer pyramids. However, the pyramids we observe are effective pyramids and not intra-familial organization devices.8
2.3. Determining ultimate ownership
We determine ultimate shareholders as in Claessens et al., (2000) and Faccio and Lang (2002), by computing ultimate voting rights in application of the so-called “weakest link” principle. Firm A is said to be controlled through pyramiding if it has an ultimate owner, who
11
controls firm B indirectly through another firm that it does not wholly control. A shareholder of a corporation is said to be an ultimate owner at the 20% threshold if control is via a control chain whose links all exceed the 20% threshold.
As an example, consider the ownership structure of Casino in December 2000. Figure 1 illustrates double voting rights shares and pyramiding in the Euris group, which owns the retail company Casino. All holdings of more than 5 percent of a firm’s shares are listed. Jean-Claude
Naouri owns Euris through a listed company, Finatis. Finatis owns 84.6% of Euris, which owns 83.06% of the cash flow rights in Foncière Euris, which owns 66.92% of Rallye, which owns 51.9% of Casino. Euris cash flow rights in Casino are therefore 84.6% x 83.06% x 66.92% x 51.90% = 24.4%. According to the weakest link principle, Euris owns 59.90% of the voting rights in Casino (the minimum of 100%, 84.49%, 81.24%, 59.90%).
A second example (Lazard group in 2002), illustrates that there may be complicated ownership loops involving several firms. The family Haussman-Percier owns 18.67% of the cash flow rights in Eurazeo through three channels. According to the weakest link principle, Haussman-Percier owns 63.17% of the voting rights in Eurazeo (Min[68.87%, 55.24%, 31.51%] + Min[68.87%, 0.04%] + Min[68.87%, 31.62%] = 31.51 + 0.04 + 31.62 = 63.17%). We have taken these loops into account to determine ultimate ownership for all the firms in our sample.
[Insert Figure1 here]
We classify firms into three groups, based on the identity of the ultimate shareholder. Family controlled firms include firms in which the ultimate owner is a family, an individual, or a firm that is not listed on any stock exchange. In non-family controlled firms, the ultimate owner
12
is a financial firm, the French state, a widely-held corporation, or a cooperative. Widely-held firms are firms without an ultimate owner at the 20% threshold.
Table 1 reports characteristics for the 1550 firm-observations of our database.
[Insert Table 1 here]
These data confirm that French firms are closely-held. On average, the largest shareholder directly holds 46.42% of the capital and 51.99% of the voting rights.9 The second largest shareholder holds on average 7.37% of the capital and 7.65% of the voting rights. The float, the percentage of the capital owned by shareholders not identified or holding less than 5% of the capital, averages 41.06% of capital for the total. On average, employees own 0.83% of firm shares and the firms hold 0.96% of their own shares.
We also identify the ultimate controlling shareholders in the presence of pyramids, for a threshold of 20% of the voting rights. On average, the largest shareholder ultimately holds 43.64% of the capital and 50.99% of the voting rights.
We further take into account the identity of the shareholders. At the 20% threshold, 70.1% of the companies are controlled by a family, holding on average 50.71% of the capital and 60.04% of the voting rights. Thus, French listed companies are largely controlled by families. Among the other controlling shareholders, are financial institutions (9.2%), widely-held companies (4.8%), and the French State (2.8%). Only 13.1% of the firms are widely-held.
We then examine the methods used by French firms to ensure separation between control rights and ownership rights held by large shareholders (Table 2). Double voting rights are the most frequent device used by 68.3% of the firms; for 52.2% of them, it is the only enhancing device. Pyramids are used by 18.5% of the firms, voting caps by 2.3% of the firms, dual-class
13
shares by 1.2%, and limited partnerships by 1.8%. As pyramids and double voting rights are the main devices used by French firms, we focus our analysis on these two mechanisms.
[Insert Table 2 here]
3. Liquidity measures and methodology
We include in our study several liquidity measures, divided into trade-based measures and order-based measures, to capture transactions costs. Trade-based measures include the logarithm of the number of trades and the logarithm of relative turnover (trading value divided by market capitalization). Order-based measures include depth and effective relative bid-ask spreads. Depth at the opening is measured by the logarithm of the sum of the value in Euros of shares posted at the best limits first observed in the order book on a given trading day. We calculate the daily average relative effective spread, estimated using full day data records. The number of spreads over a trading day varies according to the number of transactions. The effective spread takes into account the possibility of a transaction within the spread, although in practice this is rare on the Paris exchange.10 The relative effective spread relates the spread to the midpoint of the spread11:
( ( 1) M idpoint M idpoint -Price Trade 2 Spread Relative Effective , where 2 Price Bid Price Ask M idpoint
All liquidity variables are averages across all trading days over the 12 months around the date of ownership structure for each year (6 months before and after December 31, for the years 1998, 2000, 2002).12
To complement the univariate analysis, we use ordinary least squares (OLS) regressions to explain liquidity. There are four dependent variables: relative effective spread, number of transactions, relative turnover and depth. The independent variables include corporate
14
governance variables and control variables. To take into consideration the combined effect of control variables suggested by previous studies of the determinants of the liquidity13, we specify as variables market capitalization and SRD, a dummy equal to one when the share is traded on the deferred settlement market. We also specify a volatility variable (standard deviation of rates of return over one year around the date of ownership structure). Year dummies are included.
For the corporate governance, we specify variables for the percentage of capital owned by the controlling shareholder and the second largest shareholder (either direct or ultimate), the identity of the controlling shareholder, the wedge between cash flow rights and control rights, and dummy variables that reflect the presence of pyramids and double voting rights.
4. Empirical results
4.1. Controlling blockholders and liquidity
We expect liquidity measures to be lower for firms with controlling shareholders than for widely held firms. Table 3 presents univariate evidence of market characteristics and liquidity measures for subsamples of widely-held firms, family-controlled firms and non-family-controlled firms (firms that are controlled at the 20% level by financial, state, or widely-held firm blockholders).
[Insert Table 3 here]
Widely-held firms are largest in market value, more volatile, involved in the most transactions, and more liquid than family-controlled firms and non-family controlled firms. Turnover and number of transactions for widely-held firms’ are significantly larger than for other controlled firms, which, in turn, are larger than family-firms turnover and number of transactions.
15
Average relative spread is 1.46% for widely-held firms, 2.99% for family-firms, and 1.97% for non-family controlled firms. On average, 20.81 analysts follow widely-held firms, compared to 6.88 for family-firms and 13.51 for other closely-held firms. The data show that the size and the volatility of companies listed on the same market segment have only limited differences with respect to whether there is a controlling shareholder. However, family-firms are characterized by wider spreads and lower depth. In general, the descriptive statistics indicate that the widely-held companies are the largest and the most liquid firms, and family-controlled companies are the smallest and least liquid firms. Non-family controlled companies fall between these two profiles.
Table 4 reports the estimation results of our multivariate analysis. Liquidity, except for relative turnover, increases with market capitalization, and is greater for firms on the SRD market. Liquidity, regardless of measure, decreases as volatility increases. This result is consistent with previous findings on the determinants of liquidity measures.
[Insert Table 4 here]
In the first column, we regress the spread on free float, and find a negative relationship. As the size of the market for the firm’s shares declines, the frequency of trades and the production of information declines, leading to reduced liquidity. To more directly test the impact of controlling shareholders on liquidity, we include two dummy variables for controlled firms. The first (second) dummy equals one if the firm is controlled by a family (other controlling shareholder) at the 20% threshold. Spreads of family-firm (other controlled firm) shares are 0.44% (0.62%) larger on average than spreads of widely-held shares. We also include the percentage of capital held by the first and the second shareholders. We find that liquidity, regardless of the measure used, decreases with the percentage of the capital held by both the
16
controlling and second shareholder. Inside block ownership reduces liquidity, confirming that the shares of closely-held firms have a less liquid secondary-market.
We then investigate the impact of separating ultimate control and ownership on liquidity. The discrepancy between cash flow rights and voting rights is measured as the ratio of voting rights minus cash flow rights to cash flow rights. We find that the deviation of control from ownership has a positive impact on spread, a negative impact on the number of transactions and relative turnover, and a negative but insignificant impact on depth. Several reasons may explain this result. First, when minority shareholders suspect private benefits to be a large part of the firm’s value, they may prefer selling the shares or avoid buying them. Second, the ultimate
shareholder may choose to adopt a poor disclosure policy to trade on private information. Both lead to lower liquidity.
Our results also apply to subsamples by control type. The existence of a controlling shareholder at the 20% threshold reduces liquidity measured by trade-based variables and spread, whether it is a family or not, with a negative but insignificant effect on depth. A second shareholder has a negative impact on liquidity only for family-firms. The deviation between ultimate control and ownership increases the spread for all of the controlled firms, but the impact is more pronounced for family-firms, significantly reducing the number of transactions and the relative turnover, although not affecting depth. Orders may be posted in the order book in a manner that narrows the spread but with smaller quantities. One explanation is that most institutional investors will not invest in a firm with a large control-ownership deviation. Thus, transactions are mainly initiated by individual investors, leading to smaller order size. However, spreads increase since a fraction of these investors are informed. Thus, there is evidence for our hypothesis of reduced liquidity in the presence of controlling shareholders.
17
4.2. Means of enhancing control and market liquidity
We examine the impact of alternative means of enhancing control by estimating regressions to explain liquidity variables. Table 5 reports the regression coefficients for the total sample.
[Insert Table 5 here]
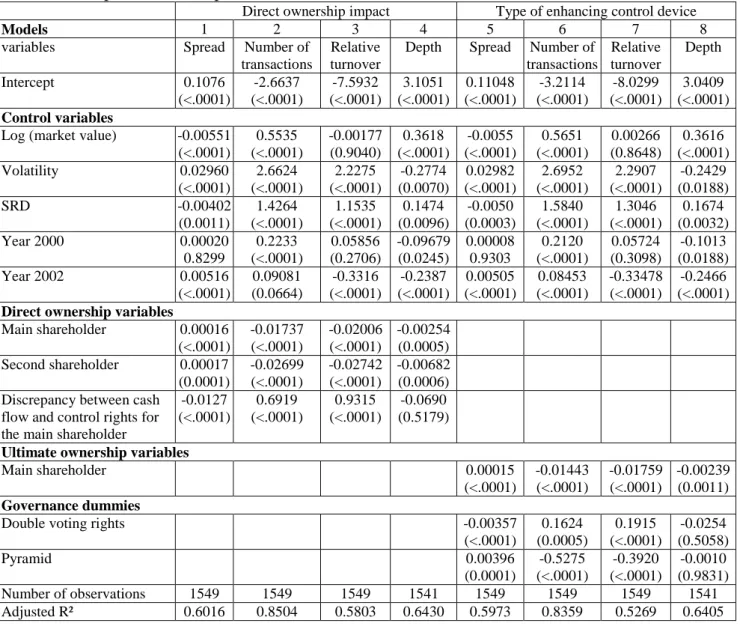
In the first set of regressions (columns 1 to 4), liquidity measures are specified as a function of direct ownership variables (as opposed to the ultimate ownership variables used in Table 4): percentage of capital owned by the main and second shareholders, and the deviation between cash flow rights and control rights. The impact of the two direct ownership variables is similar to that of the ultimate ownership variables. However, the direct control/ownership deviation improves liquidity when measured by spread, number of trades and relative turnover, whereas, in Table 4, the ultimate deviation has the opposite effect. Double voting right shares are the main source of direct deviation. Ultimate deviation is the consequence of both pyramiding and double voting rights. This finding may therefore reflect a difference in the impact of these two means of enhancing control on liquidity.
To verify this hypothesis, the next set of regressions (columns 5 to 8) includes two dummies that equal one if the firm has adopted, alternatively, a pyramidal structure or double voting rights. We find that double voting rights have a positive impact on liquidity measured by spread, number of transactions and relative turnover, whereas pyramiding leads to decreased liquidity. This result is robust to the inclusion of direct or ultimate ownership variables and of a free float variable, and is also robust to the inclusion of a dummy for the identity of the
18
controlling shareholder. However, depth is not affected by the inclusion of double voting rights and pyramiding dummies.
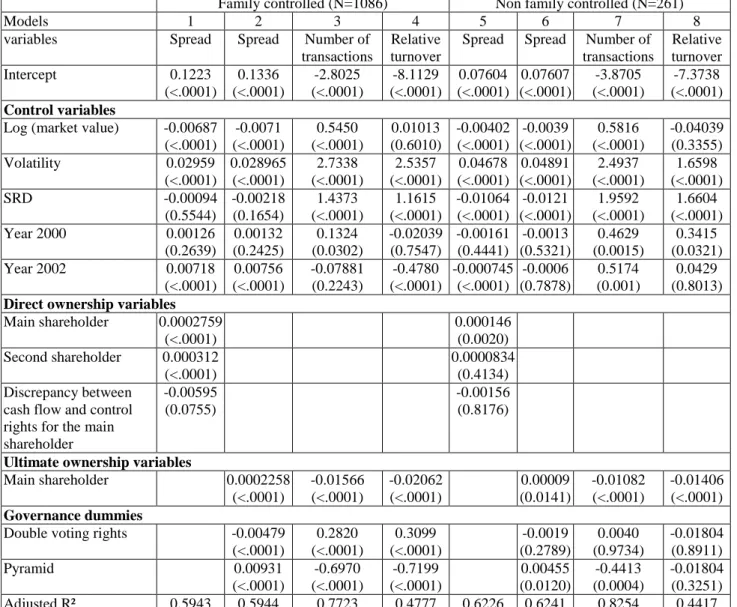
Next, we investigate whether our findings are invariant to the controlling shareholder identity. We re-estimate the previous set of regressions for subsamples of family controlled firms and other types of controlled firms (Table 6).
[Insert Table 6 here]
For family-firms, we confirm that direct control/ownership deviation has a negative impact on spreads. Double voting rights strongly increase liquidity, measured by spread, number of transactions and relative turnover, whereas pyramiding has the opposite effect. For non-family-controlled firms, pyramiding leads to decreased liquidity, as measured by spreads and number of transactions, but double voting rights have no significant effect on liquidity.
Our results confirm that double voting rights have a positive impact on liquidity for family-firms, that has two origins. First, free float is larger for family-firms with double voting rights, which permit family shareholders to ensure control by holding a lower fraction of the shares (trading hypothesis). As the negative impact of double voting rights is robust to the inclusion of the float variable in the regressions, increased float is not the only explanation for the positive impact of double voting rights on liquidity. The second reason is a probable reduction of insider trading. Some informed shareholders are likely to refrain from selling their shares, because of the loss of double voting rights. If a significant number of informed shareholders abstain from trading, the asymmetry of information may decrease, resulting in a greater liquidity (adverse selection hypothesis). Double voting rights, by rewarding long-term shareholders, also
19
enhance liquidity for minority shareholders of small and closely-held firms, and may thus be beneficial for both controlling and minority shareholders.
To verify the robustness of our results, we analyze subsamples of firms that use double voting rights as their only means of enhancing control and firms with no control enhancing device (Table 7, Panel A). Again, we find that for family-firms, double voting rights have a negative impact on spreads and a positive impact on number of transactions and relative turnover. There is no significant effect for the subsample of non-family controlled firms. For subsamples of firms using pyramids versus firms using no control enhancing device, we find that pyramids increase spreads for both family and non-family-controlled firms (Table 7, Panel B). Pyramids decrease the number of transactions and the relative turnover for family-firms and also for non-family controlled firms (although, the effect is not significant). Our results confirm the hypothesis that the impact of control-ownership deviation on liquidity depends on the device used to achieve it and that the effect on liquidity is positive for double voting rights and negative for pyramids.
[Insert Table 7 here]
4.3. Ownership structure, means of enhancing control and asymmetry of information
We further investigate the impact of ownership and governance variables on liquidity, to determine whether our prior findings result from variations in the degree of asymmetric information in the presence of blockholdings or when the control-ownership deviation is high. We use two approaches. First, following Brennan and Subrahmanyam (1995), we measure the level of a firm’s asymmetric information by the number of analysts following the firm. Second,
20
Measuring asymmetric information by the number of analysts following the firm. We obtain the number of analysts following each firm in our sample at the end of 1998, 2000, 2002, from the I/B/E/S database. On average (median), there are 9.82 (3) analysts following each firm. Widely-held firms are followed by 20.81 analysts on average, whereas family-firms are followed by 6.88 analysts. Table 8 reports OLS regressions that relate the number of analysts following each firm to blockholdings and control/ownership deviation.
[Insert Table 8 here]
We find that the number of analysts increases with free float at the 20% level and decreases with the ultimate and direct percentages of capital held by the main and the second shareholders, confirming that there are less analysts (and greater asymmetric information according to our hypothesis) in the presence of blockholders, for the total sample and for subsamples by type of controlling shareholder. The number of analysts increases with the direct control/ownership deviation for the total sample and for the family-firms. It declines with the ultimate control/ownership deviation but only for the subsample of family-firms. The double voting right dummy also has a positive effect on the number of analysts for the total sample and the subsamples of family and non family-controlled firms. The pyramid dummy has a negative effect for the total sample and the family-firms sample. The device used to dissociate control and ownership, pyramid or double voting rights, has an opposite impact. Given that the number of analysts is our measure of asymmetric information, we infer that pyramids increase asymmetric information, whereas double voting rights reduce asymmetric information.
21
Measuring asymmetric information by the adverse selection component of the spread. We use the Euronext intraday database to calculate the adverse selection component of the spread. We identify and exclude the transactions on opening and closing call auctions. The orders carried out on several limits of prices in the order book are identified and aggregated as a single transaction.14 Over a one-year period (6 months before and 6 months after) around the year-end 1998, 2000 and 2002, 56.604 million transactions occur for the shares in our sample, among which 6.362 million are executed on at least two price limits. The number of observations available in a given month differs from one share to another. For example, France Telecom has 143,969 transactions in July 2002, whereas 1475 share-months (out of 11,179) have less than 50 transactions.
We use the Huang and Stoll (1997) approach to measure the adverse component of the spread. We denote the price of the transaction at time t as Pt and define Qt to be the buy-sell trade indicator variable for the transaction price, Pt. The indicator equals +1 if the transaction is buyer initiated and -1 if the transaction is seller initiated. As Euronext is an electronic order driven market, the direction of the transactions can be identified in a precise way, by comparing the price and the immediately preceding spread.
( ( 2) 1
1
2 2 t t t t t t S S PP Q Q Q eTheand , which cannot be estimated separately, represent the adverse selection component and the cost of inventory component of the spread as a percentage of the half-spread. The traded spread, S, is estimated using the Huang and Stoll’s model for the 11,180 share-months for which at least 50 transactions (call auctions excluded) are available. The adverse selection component of the spread is estimated as:
22 ( ( 3) spread quoted spread estimated spread Quoted component selection Adverse
For each share and each of our three periods, we average the adverse selection spread component. All non-positive estimates are set equal to 0. Thus, the sample size for the adverse selection component of the spread (1,087 firm-year observations) is smaller than the sample size for spreads and depths (1,550). Table 9, Panel A, compares the characteristics of the firm-years for which the adverse component of the spread can be calculated versus the other observations. The reduced sample contains 92.61% of the widely-held firms, and only 64.18% of the family-firms. The firms in the smaller sample are characterized by a larger average market capitalization (2,878 million Euros compared to 97 million for the non-included firms), and the float is significantly larger (56.21% compared to 39.20%). The main ultimate shareholder holds 38.87% of the capital (54.87% for the non-included firms), and the average spread is 1.73% (4.70% for the non-included firms). In general, the smaller sample contains larger and more liquid firms than those of the initial sample.
[Insert Table 9 here]
We next estimate regressions that explain the adverse selection component of the bid-ask spread to test the hypothesis that larger controlling shareholders and greater control-ownership deviations are associated with more serious information asymmetry (Table 9, Panel B). We find that the adverse selection component of the spread is increasing with the ultimate and direct percentage of capital held by the main and the second shareholders, confirming that controlling shareholders are informed traders. It is also increasing with ultimate control/ownership deviation for the total sample and the subsamples of family and non family-controlled firms. The pyramid
23
dummy increases asymmetric information for the total sample and the family-firm sample. Thus, when the controlling shareholder is able to trade on private information to extract private benefits, in particular by adopting a poor disclosure policy, asymmetric information is higher. In contrast, we observe that neither the direct control-ownership deviation, resulting mainly from double voting rights, nor the double voting rights dummy, have a significant impact on the adverse selection component of spread. Our previous results on double voting rights hold mainly for family-firms, which are on average smaller than other firms, and in Table 9, panel A, it is apparent that more than one-third of the family-firms are excluded in the calculation of the adverse selection component of the spread. Since the reduced sample contains mainly larger and more liquid firms, one interpretation may be that there is an impact of double voting rights on the degree of asymmetric information for small firms, for which we are unable to calculate the adverse selection spread component, a metric that is not observable for larger firms.
5. Robustness checks
We conduct a series of robustness checks on our results. First, we average the liquidity variables over six months, four months plus two months around the end of the year, and the results are unchanged. Second, we re-estimate our models in Table 4 for each year in our sample, and our findings still hold. Third, we disaggregate the sample by settlement method (cash-only and deferred settlement) and re-estimate our models in Table 4 for each subsample. The results are qualitatively unchanged. Fourth, we re-estimate all of our regressions to include dummies that reflect other governance mechanisms (voting caps, dual class shares and limited partnership), including more detailed ultimate blockholder identity dummies and a free float variable. The results remain the same. Fifth, when all tests are conducted with quoted spreads instead of
24
effective spreads, the results are unchanged. Sixth, we examine the issue of endogeneity. Previous findings have highlighted that in studies that find a positive impact of institutional investor blockholdings on liquidity, there may be a problem of endogeneity, since institutional investors prefer more liquid stocks. In our study, we take into account controlling blockholders and blockholders have a negative impact on liquidity. As underlined by Brockman and al (2009), it is not obvious why blockholders would prefer less liquid stocks. However, as a test, we performed a 2SLS regression as in Heflin and Shaw (2000) and the results remain the same. We further perform 2SLS regressions that treat the choice of pyramids or double voting rights as endogeneous, and the findings are unchanged.
6. Conclusion
Our study of the ownership-liquidity relation in France contributes to understanding the impact of ownership structure and the decoupling of ownership/control on market liquidity. We study a large sample of French firms, gathering hand collected data on control enhancing devices. French firms are characterized by concentrated ownership and the extensive use of double voting rights, a mechanism that rewards long-term shareholders. We find that liquidity is significantly reduced for closely-held firms, and this result is robust with respect to whether the controlling shareholding is determined by direct or ultimate ownership. We take into account the identity of the controlling shareholder. We find that the device chosen to separate control from ownership has important consequences on liquidity and asymmetric information. Pyramids increase asymmetric information and decrease liquidity, whereas double voting rights reduce asymmetric information and increase liquidity, at least for small firms. Pyramids are complex and opaque mechanisms that allow controlling shareholder to trade on private information to extract private
25
benefits. In contrast, double voting rights are transparent, and restrain insiders from using sell/buy back transactions. By using double voting rights rather than pyramids to enhance their control, blockholders reduce the degree of asymmetric information on the market and offer higher secondary-market liquidity to outside investors.
26
References
Adams, R., and D. Ferreira. (2008) One Share - One Vote: The Empirical Evidence. Review of Finance, 12, 51-91.
Amihud, Y., and H. Mendelson. (1986) Asset pricing and the bid-ask spread. Journal of Financial Economics, 17, 223-249.
Amihud, Y. and H. Mendelson. (1989) The Effects of Beta, Bid-Ask Spread, Residual Risk, and Size on Stock Returns. Journal of Finance, 44, 479-486.
Attig, N., W.M. Fong, Y. Gadhoum, and L. Lang. (2006) Effects of large shareholding on information asymmetry and stock liquidity. Journal of Banking and Finance, 30, 2875-2892.
Bauguess, S., M. Slovin, and M. Sushka, (2007) Recontracting shareholder rights at closely held firms.” unpublished working paper, Arizona State University.
Becht, M. (1999) European corporate governance: Trading of liquidity against control. European Economic Review, 43 1071-1083.
Biais, B., P. Hillion, and C. Spatt. (1995) An empirical analysis of the limit order book and the order flow in the Paris Bourse. Journal of Finance, 50, 1655-1689.
Boehmer E., G. Sanger, and S. Varshney. (2004) Managerial bonding and stock liquidity: an analysis of dual-class firms. Journal of Economics and Finance, 28, 117-131.
Bollen, N.; T. Smith, and R. Whaley. (2003) Modeling the bid/ask spread: measuring the inventory-holding premium, Journal of Financial Economics, 72, 97-141.
Bolton, P., and E.-L. Von Thadden. (1998) Blocks, liquidity and corporate control. Journal of Finance 53, 1-25.
Brennan, M. J., and A. Subrahmanyam. (1995) Investment analysis and price formation in securities markets. Journal of Financial Economics, 38, 361-381.
27
Brockman, P., D. Y. Chung, and X. S. Yan. (2009) Block Ownership, Trading Activity, and Market Liquidity. Journal of Financial and Quantitative Analysis, 44, 1403-1426.
Chung, K.H., J. Elder, and J.C. Kim. (2010) Corporate Governance and Liquidity. Journal of Financial and Quantitative Analysis, 45, 265-291.
Claessens, S., S. Djankov, and L. Lang. (2000) The separation of ownership and control in East Asian corporations. Journal of Financial Economics, 58, 81-112.
Copeland, T. E., and D. Galai. (1983) Information effects of the bid-ask spread. Journal of Finance 38, 1457-1469.
De Jong A., D. DeJong, U. Hege, and G. Mertens. (2009) Leverage in Pyramids: When Debt Leads to Higher Dividends. working paper, HEC Paris.
Demsetz, H. (1968) The cost of transactions. Quarterly Journal of Economics, 20, 267- 291.
Faccio M., and L. Lang. (2002) The separation of ownership and control: an analysis of ultimate ownership in western European corporations. Journal of Financial Economics, 65, 365-395.
Foucault T., D. Sraer, and D. Thesmar. (2010) Individual investors and volatility. Journal of Finance, forthcoming
Glosten L. R., and P. R. Milgrom. (1985) Bid, Ask and Transaction Prices in a Specialist Market with Heterogeneously Informed Traders. Journal of Financial Economics, 14, 71-100.
Gompers, P., J. Ishii, and A. Metrick. (2003) Corporate Governance and Equity Prices. Quarterly Journal of Economics, 118, 107-155
Heflin F., and W. K. Shaw. (2000) Blockholder Ownership and Market Liquidity. Journal of Financial and Quantitative Analysis, 35, 621-633.
Holmström B., and J. Tirole. (1993) Market liquidity and performance monitoring. Journal of Political Economy, 101, 678-709.
28
Huang R.D., and H.R. Stoll. (1997) The components of the bid-ask spread: a general approach, Review of Financial Studies, 10, 995-1034.
Institutional Shareholder Services. (2007) Proportionality between ownership and control in EU listed companies: External study commissioned by the European Commission. Available at
http://www.ecgi.org/osov/documents/final_report_en.pdf
Kini, O., and S. Mian. (1995) Bid-ask spread and ownership structure, Journal of Financial Research, 58 401-414.
La Porta R. F., Lopez-de-Silanes A. Shleifer, and R. Vishny. (2000) Investor protection and corporate governance. Journal of Financial Economics, 58, 3-27.
La Porta R., Lopez-de-Silanes F., Shleifer A., and R. Vishny. (2002) Investor protection and corporate valuation. Journal of Finance, 57, 1147-1170.
Manconi, A., and M. Massimo. (2008) Modigliani and Miller Meet Chandler: Organizational Complexity, Capital Structure, and Firm Value. Working paper, Insead.
Masulis R., C. Wang, and F. Xie. (2009) Agency Costs at Dual-Class Companies. Journal of Finance, 64, 1697-1727.
Masulis R., P. Pham, and J. Zein. (2009), Family Business Groups around the World: Costs and Benefits of Pyramids. Working paper.
Maug, E. (1998) Large Shareholders As Monitors: Is There a Trade-Off Between Liquidity and Control? Journal of Finance, 53, 65-98.
Pastor L., and R.F. Stambaugh. (2003) Liquidity risk and expected returns. Journal of Political Economy, 11, 642-685.
Rubin A. (2007) Ownership level, ownership concentration, and liquidity. Journal of Financial Market, 10, 219-248.
29
Sarin A., K. A. Shastri, and K. Shastri. (2000) Ownership structure and stock market liquidity. Working Paper, Santa Clara University.
Stoll, H. R., (2003) Market microstructure. In Handbook of the Economics of Finance. Constantinides, G.; M. Harris, and R. Stulz, eds. North-Holland, Amsterdam
Villalonga B., and R. Amit. (2009) How are U.S. family firms controlled? Review of Financial Studies, 22, 3047-3091.
30
Figure 1. Casino and Lazard cash flow rights and control rights
This figure describes the major listed firms controlled by Jean-Claude Naouri (Casino) in 2000. Ownership stakes are denoted by “C” and voting stakes by “V”.
31 Table 1. Descriptive statistics for ownership
Statistics reported in Panel A are for ownership variables for the full sample of 1550 firm-year observations (year-end 1998, 2000, 2002). Ultimate ownership takes account of indirect control through pyramiding at the 20% threshold. The percentage of firms controlled by different ultimate controlling owners at the 20% threshold, and the mean percentage of capital and voting rights of the controlling owners are reported in Panel B.
Panel A. Direct and ultimate ownership and control of French firms
Direct ownership/control Ultimate ownership/control (at the 20% threshold)
% capital % voting rights % capital % voting rights mean median mean median mean median mean median Main shareholder 46.42 50.40 51.99 58.10 43.64 46.55 50.99 57.0
Second shareholder 7.37 5.44 7.65 5.80 7.98 5.53 8.74 6.43 Free float (5% threshold) 41.06 37.64 35.58 30.42
Free float (20% threshold) 51.12 46.60 45.72 38.73
Employees 0.83 0.00
Treasury stocks 0.96 0.00
Panel B. Controlling owners at the 20% threshold
Number – (%) firms Ultimate mean % capital (voting rights) Number (%) firms Ultimate mean % capital (voting rights) Number (%) firms Ultimate mean % capital (voting rights) Number (%) firms Ultimate mean % capital (voting rights) Widely-held 203 0 57 0 60 0 86 0 (13,1%) 0 (47,9%) 0 (18,5%) 0 (7,8%) 0 Family, management or non
listed company 1086 50.71 35 37,12 168 40.26 883 53,24 (70.1%) (60.04) (29.4%) (48.31) (51.9%) (52,83) (79.8%) (61,88) State 44 51.52 11 41,10 17 53.91 16 62,14 (2,8%) (55,57) (9.2%) (46.98) (5.2%) (57,55) (1,4%) (63,51) Other corporation 75 54.73 7 32.71 34 49.28 34 64.71 (4.8%) (57.73) (5.9%) (35.41) (10.5%) (54.37) (3.1%) (65.70) Financial institutions 142 43.70 9 39.05 45 37.69 88 47,25 (9,2%) (49.70) (7.6%) (47.60) (13,9%) (46,15) (7,9%) (51.82)
32 Table 2. Control enhancement devices
Control enhancement devices are reported for the full sample of 1550 firm-year observations (year-end 1998, 2000, 2002). Panel A reports the number (percentage) of firms that adopted a given control device, the number of firms that adopted pyramids and another device, and the number of firms that used double voting rights and another device. Panel B presents the control enhancement devices adopted by firms, by identity of controlling shareholders at the 20 percent threshold.
Double voting rights
Voting caps
Pyramids Dual class Limited partnership firm None Only double voting rights total
Panel A. Number of firm-years using different control devices
Number of observations (percentage) 1058 (68.3%) 35 (2.3%) 287 (18.5%) 19 (1.2%) 28 (1.8%) 316 (20.4) 809 (52.2%) 1550 (100%) Pyramids and another device 143 3 7 0 Double voting rights and another device
26 143 19 16
Panel B. Number of firm-years (percentage) using different control devices by identity of controlling shareholder
Family 829 (76.3%) 8 (0.7%) 136 (12.5%) 18 (1.7%) 9 (0.8%) 195 (18.0%) 682 (62.8%) 1086 (100%) Financial institution 65 (45.8%) 4 (2.8%) 73 (51.4%) 0 1 (0.7%) 29 (20.4%) 33 (23.2%) 142 (100%) State 13 (29.5%) 0 (0%) 14 (31.8%) 0 (0%) 0 (0%) 20 (45.5%) 6 (13.6%) 44 (100%) Other corporation 35 (46.7%) 1 (1.3%) 64 (85.3%) 0 (0.0%) 3 (4.0%) 4 (5.3%) 4 (5.3%) 75 (100%) Widely-held firms 116 (57.1%) 22 (10.8%) 0 (0%) 1 (0.5%) 15 (7.4%) 68 (33.5%) 84 (41.4%) 203 (100%)
33 Table 3. Descriptive statistics for market characteristics
Market characteristics are reported for the full sample of 1550 firm-year observations. Parametric and non parametric tests are reported in italics to compare the characteristics of widely-held firms, family-controlled firms and non-family-controlled firms. The daily market value of the firm is averaged over 12 months around the date of availability of the ownership data (year-end). Volatility is the annualized estimate of daily volatility. Turnover is the daily average. Spread is the daily average relative effective spread, estimated using full day data records. Depth is measured using the data closest to the opening of the trading day. All variables are averaged over 12 months around the year-end.
Widely-held (1) N=203 Family-controlled (2) N = 1086 Non-family-controlled (3) N = 261 (2) vs (1) (3) vs (1) (2) vs (3)
Mean Median Mean Median Mean Median p-values Student test (median test) p-values Student test (median test) p-values Student test (median test) Market capitalization (€ million) 6587.3 538.3 877.51 83.09 3401.2 460.3 <.0001
(<.0001)
0.0113 (0.3896
0.000 (<.0001) Volatility (average annualized daily estimation) 55.7% 52.1% 51.1% 47.8% 44.8% 42.7% 0.0039
(0.0014)
<.0001 (<.0001)
<.0001 (<.0001) Value Weighted Average Price, (in €) 54.26 31.09 68.12 28.61 64.02 47.72 0.1185
(0.2420)
0.1387 (0.001)
0.6527 (<.0001) Turnover (daily average in 000 €) 27,326.2 1744.8 2051.1 39.6 8669.7 312.0 <.0001
(<.0001)
<.0001 (0.001)
0.0011 (<.0001) Number of transactions (daily average) 919.8 217.7 105.9 12.5 397.0 33.3 <.0001
(<.0001)
<.0001 (<.0001)
<.0001 (<.0001) Average relative effective spread – full day’s data
records, % 1,46% 0,64% 2.99% 2.35% 1.97% 1.24% <.0001 (<.0001) 0.0069 (0.0019) <.0001 (<.0001) Depth (daily average at opening in 000 €) 68.4 25.4 24.8 9.6 61.2 19.8 <.0001
(<.0001)
0.5557 (0.1114)
0.0003 (<.0001) Number of analysts following each firm 20.81 18.00 6.88 2.00 13.51 8.00 <.0001
(0.001)
<.0001 (0.0024)
<.0001 (0.001)
34 Table 4. Controlling shareholders and liquidity
Regressions are reported that relate liquidity to ownership and governance characteristics for the full sample of 1550 firm-year observations. Liquidity is measured either by the effective relative spread, the Log(number of transactions), the Log(relative turnover) or Log(depth) for the firm-year. Spread is the daily average relative effective spread, estimated using full day data records. Relative turnover is the ratio of turnover to market capitalization. Depth is measured using the data closest to the opening of the trading day. Log (market value) is the logarithm of the daily market value of the firm. Volatility is the annualized estimate of daily volatility. All variables are averaged over 12 months around the year end. SRD is a dummy variable that takes the value of one when the share is eligible for trading with deferred settlement facilities, and zero otherwise. Other independent variables specified are free-float (at the 20% threshold) and ultimate cash-flow rights held by the largest and the second shareholder. Discrepancy between cash flow and control rights for the main shareholder is equal to the ratio of voting rights minus cash flow rights to cash flow rights. Family control is a dummy equal to one when the main shareholder is an individual or a group of individuals. Non-family control is a dummy equal to one when the controlling shareholder is not a family. The p-values are in parentheses.
Total sample Family-controlled firms Non-family controlled firms
Models 1 2 3 4 5 6 7 8 9 10 11 12 13 14 15
Variables Spread Spread Spread Spread Number of transactions
Relative turnover
Depth Spread Number of transactions
Relative turnover
Depth Spread Nb tran-sactions Relative turnover Depth Intercept 0.1229 (<.0001) 0.1110 (<.0001) 0.1084 (<.0001) 0.1072 (<.0001) -2.5269 (<.0001) -7.3397 (<.0001) 3.1394 (<.0001) 0.1167 (<.0001) -1.524 (<.0001) -6.6487 (<.0001) 3.6908 (<.0001) 0.07876 (<.0001) -3.8904 (<.0001) -6.6487 (<.0001) 3.5283 (<.0001) Control variables
Log (market value) -0.00552 (<.0001) -0.00544 (<.0001) -0.00534 (<.0001) -0.00547 (<.0001) 0.5427 (<.0001) -0.01703 (0.2719) 0.3606 (<.0001) -0.0067 (<.0001) 0.5172 (<.0001) -0.02007 (0.2947) 0.3201 (<.0001) -0.0040 (<.0001) 0.5876 (<.0001) -0.02007 (0.2947) 0.3700 (<.0001) Volatility 0.03014 (<.0001) 0.02804 (<.0001) 0.02979 (<.0001) 0.0300 (<.0001) 2.6583 (<.0001) 2.2254 (<.0001) -0.2887 (0.0053) 0.02978 (<.0001) 2.6499 (<.0001) 2.4326 (<.0001) -0.2623 (0.0252) 0.04836 (<.0001) 2.5326 (<.0001) 2.4326 (<.0001) -0.3180 (0.3498) SRD -0.00432 (0.0005) -0.00713 (<.0001) -0.00476 (0.0001) -0.005 (<.0001) 1.5204 (<.0001) 1.2402 (<.0001) 0.1448 (0.0109) -0.00252 (0.1161) 1.4624 (<.0001) 1.1352 (<.0001) 0.2044 (0.0025) -0.01144 (<.0001) 1.8120 (<.0001) 1.1352 (<.0001) -0.2028 (0.2230) Year 2000 0.0001162 (0.9015) 0.000085 (0.9300) -0.00013 (0.8878) 0.00018 (0.8468) 0.2415 (<.0001) 0.08830 (0.1172) -0.0944 (0.0284) 0.00095 0.4062 0.1652 (0.0078) 0.02171 (0.7410) -0.0805 (0.0958) -0.0018 0.3962 0.5054 (0.0006) 0.02171 (0.7410) -0.0804 (0.5688) Year 2002 0.00488 (<.0001) 0.00476 (<.0001) 0.00460 (<.0001) 0.00452 (<.0001) 0.1330 (0.0184) -0.2831 (<.0001) -0.2367 (<.0001) 0.00668 (<.0001) -0.01035 (0.8751) -0.3952 (<.0001) -0.2222 (<.0001) -0.0013 (0.5569) 0.5655 (0.0004) -0.3952 (<.0001) -0.3556 (0.020) Free Float (the 20%
threshold)
-0.01611 (<.0001)
Ultimate ownership variables
Main shareholder 0.00016 (<.0001) 0.0001833 (<.0001) -0.01622 (<.0001) -0.01929 (<.0001) -0.00293 (0.0472) 0.00030 (<.0001) -0.02226 (<.0001) -0.02854 (<.0001) -0.00098 (0.4626) 0.00011 (0.0163) -0.01480 (<.0001) -0.02854 (<.0001) -0.00741 (0.0161) Second shareholder 0.000097 (0.0318) 0.0001111 (0.0141) -0.01619 (<.0001) -0.01885 (<.0001) -0.00629 (0.0021) 0.00025 (<.0001) -0.02361 (<.0001) -0.03020 (<.0001) -0.00632 (0.0121) -0.00003 (0.7563) -0.00993 (0.1451) -0.03020 (<.0001) -0.00971 (0.1401) Discrepancy cash flow /
control rights for the main shareholder 0.00111 (0.1684) 0.00178 (0.0316) -0.2584 (<.0001) -0.2035 (<.0001) -0.0507 (0.1702) 0.00678 (<.0001) -0.5168 (<.0001) -0.5372 (<.0001) 0.05170 (0.4085) 0.00205 (0.0723) -0.2003 (0.0001) -0.5372 (<.0105) -0.08276 (0.2698)
Identity of controlling owner
Family control dummy 0.00437 (0.0005)
-0.00324 (0.0011) Non-family control dummy 0.00622
(<.0001)
Number of observations 1549 1549 1549 1549 1549 1549 1541 1086 1086 1086 1082 260 260 260 256 Adjusted R² 0.5960 0.5688 0.5884 0.5910 0.8326 0.5285 0.6432 0.5814 0.7658 0.4735 0.5592 0.6171 0.6226 0.8226 0.4356
35
Table 5. Mechanisms of enhancing control and liquidity
Regressions are reported for the relation of liquidity to ownership and governance characteristics. Liquidity is represented either by the effective relative spread, the Log(number of transactions), the Log(relative turnover) or the Log(depth) for the firm-year. Spread is the daily average relative effective spread, estimated using full day data records. Relative turnover is the ratio of turnover to market capitalization. Depth is measured using the data closest to the opening of the trading day. Log (market value) is the logarithm of the daily market value of the firm. Volatility is the annualized estimate of daily volatility. All variables are averaged over 12 months around year-end. SRD is a dummy variable that takes the value of one when the share is eligible for trading with deferred settlement facilities, and zero otherwise. Regressions include year indicators. Other independent variables are either ultimate or direct cash-flow rights held by the largest or the second shareholder. Discrepancy between cash flow and control rights for the main shareholder is equal to the ratio of voting rights minus cash flow right to cash flow rights. Double Voting Rights and Pyramid are dummies that equal 1 when the provision is present; N is the number of firm-year observations; p-values are in parentheses.
Direct ownership impact Type of enhancing control device
Models 1 2 3 4 5 6 7 8
variables Spread Number of transactions
Relative turnover
Depth Spread Number of transactions Relative turnover Depth Intercept 0.1076 (<.0001) -2.6637 (<.0001) -7.5932 (<.0001) 3.1051 (<.0001) 0.11048 (<.0001) -3.2114 (<.0001) -8.0299 (<.0001) 3.0409 (<.0001) Control variables
Log (market value) -0.00551 (<.0001) 0.5535 (<.0001) -0.00177 (0.9040) 0.3618 (<.0001) -0.0055 (<.0001) 0.5651 (<.0001) 0.00266 (0.8648) 0.3616 (<.0001) Volatility 0.02960 (<.0001) 2.6624 (<.0001) 2.2275 (<.0001) -0.2774 (0.0070) 0.02982 (<.0001) 2.6952 (<.0001) 2.2907 (<.0001) -0.2429 (0.0188) SRD -0.00402 (0.0011) 1.4264 (<.0001) 1.1535 (<.0001) 0.1474 (0.0096) -0.0050 (0.0003) 1.5840 (<.0001) 1.3046 (<.0001) 0.1674 (0.0032) Year 2000 0.00020 0.8299 0.2233 (<.0001) 0.05856 (0.2706) -0.09679 (0.0245) 0.00008 0.9303 0.2120 (<.0001) 0.05724 (0.3098) -0.1013 (0.0188) Year 2002 0.00516 (<.0001) 0.09081 (0.0664) -0.3316 (<.0001) -0.2387 (<.0001) 0.00505 (<.0001) 0.08453 (<.0001) -0.33478 (<.0001) -0.2466 (<.0001)
Direct ownership variables
Main shareholder 0.00016 (<.0001) -0.01737 (<.0001) -0.02006 (<.0001) -0.00254 (0.0005) Second shareholder 0.00017 (0.0001) -0.02699 (<.0001) -0.02742 (<.0001) -0.00682 (0.0006) Discrepancy between cash
flow and control rights for the main shareholder
-0.0127 (<.0001) 0.6919 (<.0001) 0.9315 (<.0001) -0.0690 (0.5179)
Ultimate ownership variables
Main shareholder 0.00015 (<.0001) -0.01443 (<.0001) -0.01759 (<.0001) -0.00239 (0.0011) Governance dummies
Double voting rights -0.00357
(<.0001) 0.1624 (0.0005) 0.1915 (<.0001) -0.0254 (0.5058) Pyramid 0.00396 (0.0001) -0.5275 (<.0001) -0.3920 (<.0001) -0.0010 (0.9831) Number of observations 1549 1549 1549 1541 1549 1549 1549 1541 Adjusted R² 0.6016 0.8504 0.5803 0.6430 0.5973 0.8359 0.5269 0.6405