Hydrological impacts of climate change on the Tejo and Guadiana Rivers
16
0
0
Texte intégral
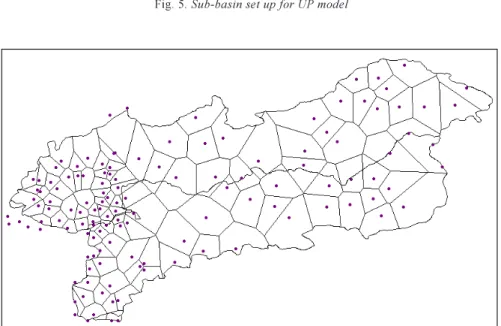
Figure
+7
Documents relatifs
