HAL Id: hal-01481340
https://hal.archives-ouvertes.fr/hal-01481340
Submitted on 31 May 2017
HAL is a multi-disciplinary open access
archive for the deposit and dissemination of
sci-entific research documents, whether they are
pub-lished or not. The documents may come from
teaching and research institutions in France or
abroad, or from public or private research centers.
L’archive ouverte pluridisciplinaire HAL, est
destinée au dépôt et à la diffusion de documents
scientifiques de niveau recherche, publiés ou non,
émanant des établissements d’enseignement et de
recherche français ou étrangers, des laboratoires
publics ou privés.
single greatest stratospheric gas release of the Common
Era
Céline M. Vidal, Nicole Métrich, Jean-Christophe Komorowski, Indyo
Pratomo, Nugraha Kartadinata, Agnès Michel, Vincent Robert, Franck
Lavigne
To cite this version:
Céline M. Vidal, Nicole Métrich, Jean-Christophe Komorowski, Indyo Pratomo, Nugraha Kartadinata,
et al.. The 1257 Samalas eruption (Lombok, Indonesia): the single greatest stratospheric gas release of
the Common Era. Scientific Reports, Nature Publishing Group, 2016, 6, pp.34868 �10.1038/srep34868�.
�hal-01481340�
The 1257 Samalas eruption
(Lombok, Indonesia): the single
greatest stratospheric gas release
of the Common Era
Céline M. Vidal
1, Nicole Métrich
1, Jean-Christophe Komorowski
1, Indyo Pratomo
2,
Agnès Michel
1, Nugraha Kartadinata
3, Vincent Robert
4& Franck Lavigne
5Large explosive eruptions inject volcanic gases and fine ash to stratospheric altitudes, contributing to global cooling at the Earth’s surface and occasionally to ozone depletion. The modelling of the climate response to these strong injections of volatiles commonly relies on ice-core records of volcanic sulphate aerosols. Here we use an independent geochemical approach which demonstrates that the great 1257 eruption of Samalas (Lombok, Indonesia) released enough sulphur and halogen gases into the stratosphere to produce the reported global cooling during the second half of the 13th century, as well as potential substantial ozone destruction. Major, trace and volatile element compositions of eruptive products recording the magmatic differentiation processes leading to the 1257 eruption indicate that Mt Samalas released 158 ± 12 Tg of sulphur dioxide, 227 ± 18 Tg of chlorine and a maximum of 1.3 ± 0.3 Tg of bromine. These emissions stand as the greatest volcanogenic gas injection of the Common Era. Our findings not only provide robust constraints for the modelling of the combined impact of sulphur and halogens on stratosphere chemistry of the largest eruption of the last millennium, but also develop a methodology to better quantify the degassing budgets of explosive eruptions of all magnitudes.
Sulphur (S) gases injected into the stratosphere during plinian eruptions are converted into sulphate aerosols that travel around the globe and backscatter solar radiation, resulting in a net cooling of the troposphere and the Earth’s surface1. Besides the effect of sulphate aerosols, volcanogenic halogens and especially chlorine (Cl) and bromine (Br) may induce the catalytic destruction of the ozone layer2. Although these processes have been observed on a very small scale for a number of recent explosive eruptions such as the 1963 Agung, 1982 El Chichón and 1991 Pinatubo events3, the effects of large historic silicic eruptions on climate and atmospheric chemistry remain poorly constrained, with hitherto unexplored feedbacks. The reconstruction of climate forcing associated with explosive eruptions involves several scientific disciplines, as it strongly depends on a variety of parameters including the height of injection, the gas flux and the latitude of the volcanic source. For past plinian eruptions suspected to have triggered or enhanced climate cooling, temperature reconstructions are commonly based on the amount of associated sulphate emissions inferred from glaciological records. It is furthermore com-monly admitted that the presence of a pre-eruptive vapour phase renders the quantification of the emissions of sulphate and other volatile species of past eruptions particularly challenging4–6.
The 1257 eruption of Mt Samalas, a part of the Rinjani volcanic complex (Fig. 1) on Lombok Island (Indonesia), has been recognized as the “mystery eruption”7 associated with the largest sulphate spike of the last 2.3 ky recorded in cores from both Arctic and Antarctic ice sheets8. This continuous four-phase eruption evacuated 40 ± 3 km3 of trachydacitic magma during tens of hours, producing plinian plumes that rose up to 43 km in the stratosphere and tephra fingerprinted up to 660 km from the source, thus standing as the most 1Institut de Physique du Globe de Paris, Université Sorbonne Paris Cité, CNRS UMR 7154, Paris, 75005, France. 2Museum of Geologi, Badan Geologi, Bandung, 40122, Indonesia. 3Center of Volcanology and Geological Hazards Mitigation, Badan Geologi, Bandung, 40122, Indonesia. 4Observatoire Volcanologique et Sismologique de la Guadeloupe IPGP, Gourbeyre, 97113, France. 5Laboratoire de Géographie Physique UMR 8591, Université Paris 1 Panthéon-Sorbonne, 92195 Meudon, France. Correspondence and requests for materials should be addressed to C.M.V. (email: vidal@ipgp.fr)
received: 10 June 2016 accepted: 20 September 2016 Published: 10 October 2016
powerful eruption of the last millenium9. Archaeologists recently determined a date of 1258 for mass burial of thousands of medieval skeletons in London10, that could be linked in some respect to climatic perturbations in the Northern Hemisphere by the 1257 Samalas eruption. Indeed, medieval chronicles in Northern Europe7 doc-ument the occurrence of initial warming in the early winter of 1258 just following the eruption, that was followed by extensive wet and cold climatic conditions in 1259 that may have impacted crops and contributed to the onset and magnitude of famines at that time for some regions of the Northern Hemisphere. The 1257 Samalas eruption might also have contributed to the onset of the Little Ice Age11.
The climate-forcing associated with the 1258–1259 sulphate anomaly in ice-cores has been the subject of intense research12–15, suggesting a range of sulphate yields until the source of the eruption was found. The recent re-evaluation of the record of volcanic sulphate deposition based on an extensive array of Antarctic ice cores sug-gested that a total of 170 Mt of SO2 (85 Tg of S) would have been released to produce the observed sulphate spikes, greater than the 45 Mt of SO2 estimated for the 1815 Tambora eruption16. Temperature reconstructions based on tree-ring proxies and ice-core records showed that the emission of 96 to 138 Tg of SO2, the most probable scenarios, would have induced an extra-tropical summer cooling over land of − 0.6 °C to − 5.6 °C during a period of 4–5 years17. The discrepancies between these estimates derived from ice-cores data and modelling reflect the complexity of climate reconstructions based on hypothetical S yields based on distal proxies.
The quantification of volcanogenic volatile emissions at the source commonly relies on the residual amount of volatiles dissolved in silicate melts prior to eruption recorded in small droplets of magma trapped in crystals (melt inclusions) of the erupted products18. Here we propose an alternative approach based on melt inclusions recording the different steps of magma evolution, including melt inclusions representative of both the magma that fed the eruption (a three-phased mixture of melt, gas and crystals) and of the residual melt.
Pre-eruptive magmatic conditions
The detailed petrology and mineralogy of the Holocene lavas and scoria fallouts of the Rinjani volcanic complex, including the magmatic processes leading to the 1257 Samalas eruption, are presented by Métrich
et al. (in review), and are briefly summarised hereafter. The 1257 eruption evacuated a chemically homogeneous
magma body of trachydacite (64.0 ± 0.4 wt% of SiO2; 8.1 ± 0.1 wt% of Na2O + K2O, volatile free) that derived from a parent high alumina basalt magma through fractional crystallization. The trachydacitic magma crystallised and degassed at temperatures of 900 °C to 980 °C. Its mineral paragenesis typically consists of plagioclase showing a bi-modal distribution with patchy zoned cores (An82–75) surrounded by bands (An50–46), in association with amphibole (magnesio-hastingsite), orthopyroxene (clinoenstatite), rare clinopyroxene (augite), titano-magnetite, iron sulphide and apatite.
Here we combined the detailed geochemical study of minerals and melt inclusions with matrix glass and whole-rock analyses (major, trace, S, Cl and Br) to characterise the composition of the pre- and post-eruptive magmatic system, and further quantify the volatile budget of the 1257 eruption. Samples from the four phases of the 1257 trachydacitic eruption and of the 712 A.D. basaltic scoria fallout have been examined (see Supplementary Sample description and Figure S1). Our dataset is complemented by melt inclusions from the trachydacitic pum-ice of the 2550 B.P. eruption19 (compositions are reported in Supplementary Tables S1, S2 and S3). Major and trace elements denote the bi-modality of the magma compositions and the lack of intermediate andesitic magma (Fig. 2a,b). The overall evolutionary trend is perfectly illustrated by the positive correlation between Rb and Th (Fig. 2b), suggesting that the 1257 trachydacite derived from the basalt through fractional crystallization of ~81% (Methods). Furthermore, compositions of olivine-hosted melt inclusions match that of the whole-rock parent basalt of the 1257 trachydacite (Fig. 2b). Most remarkable are the melt inclusions in plagioclase An82–75 that are representative of the whole trachydacitic magma (60.5 ± 1.3 wt% of SiO2; 9.0 ± 0.9 ppm of Th) whereas more sodic plagioclase (An50–46), amphibole and pyroxenes trapped melts that recorded the evolution towards the residual trachydacitic composition of the matrix glass (68 ± 1 wt% of SiO2; 16.3 ppm of Th) due to in-situ crystallization at shallow depth. Depicting the magma evolution respectively associated with fractional crystallization and in-situ
Figure 1. Map of the Lesser Sunda Islands and their active volcanoes. SRTM DEM at 3 arcsecond (~90 m)
resolution (http://srtm.csi.cgiar.org)63 of Bali, Lombok and Sumbawa. This map was generated using the Esri ArcMapI 10.1 software (http:www.esri.com).
crystallization is an innovative approach that enables to decipher the volatile evolution from the parent basalt to the 1257 trachydacite. We further quantify the distribution of sulphur and halogens between the pre-eruptive silicate melt (melt inclusions), the volatile-bearing mineral phases (sulphide (S), apatite (SO2, Cl) and amphi-bole (Cl)), and the vapour phase (Fig. 3) consisting of gas species exsolved during in-situ crystallization of the trachydacite in the shallow crust, with possible incremental influx of deeper-derived vapour phase20. Finally we establish the degassing budget of the 1257 Samalas eruption by comparing the pre-eruption and the post-eruption trachydacitic magma. We stress that volatile partitioning between the vapour phase and such sulphide-saturated calc-alkaline melts at 900–980 °C is still poorly constrained by experimental data.
The evolution of volatile species illustrated in Fig. 4 reflects the differential ability of each species to be frac-tionated into the vapour phase and minerals. Water contents of melt inclusions remain relatively constant along the path of magma differentiation (Fig. 4a,b). The basalt displays average water contents of 3.5 ± 0.2 wt%, a typical
Figure 2. Melt inclusions record the magma evolution leading to the 1257 eruption. (a) K2O vs SiO2 variation diagram for the Rinjani-Samalas calc-alkaline suite including whole-rocks, melt inclusions in olivine of the 712 high alumina basalt (Fo is olivine forsterite content, i.e. 100 × Mg/(Mg + Fe)), in plagioclase of 2550 B.P. and 1257 pumice clasts (An is anorthite content, i.e. 100 × Ca/(Ca + Na)), in clino-(cpx), ortho-(opx) pyroxene, amphibole, and matrix glasses of the 1257 eruptive products. Compositions are normalised to 100 wt%, free of volatiles. The Rinjani-Samalas suite plots in between the whole-rock compositional fields of 1815 Tambora53 and 1963 Agung64,65 products, highlighting the enrichment in K
2O of magmas towards the East of the Lesser Sunda arc. (b) Rb-Th positive correlation indicates that the 1257 trachydacite derived from its parent basaltic magma through a dominant process of fractional crystallization. Plagioclase An82–75 -hosted melt inclusions are representative of the 1257 whole magma composition, whereas plagioclase An50–46 -hosted melt inclusions record its shallow depth in-situ crystallization. (c) Cu vs Th variation diagram showing strong Cu fractionation during magma differentiation recording the prevalent Cu-sulphide segregation. See Supplementary Figures S2 and S3 for more major and trace element variation diagrams.
value for arc basalts21. The 1257 trachydacite magma derived from the basalt contains 3.9 ± 0.1 wt% of H 2O, a value measured in melt inclusions in plagioclase An82–75. Such a dissolved amount of H2O is well below the max-imum water concentrations (8–< 10 wt%) of amphibole-bearing dacite crystallizing at 300–400 MPa under water-saturated conditions22. This suggests a drastic loss of water during fractional crystallization and most likely during magma decompression and ascent. The distribution of the H2O concentrations in melt inclusions in pla-gioclase An50–46 indicates that ~70% cluster at 3.7 ± 0.3 wt% H2O (Supplementary Figure S4a), a value represent-ative of the H2O concentration of the residual melt (Fig. 4b). A few higher water contents (up to 5.5 wt%) reflect the multi-stage exsolution of water from the melt, and possibly magma mixing during refilling of the 1257 trach-ydacitic system. This feature is consistent with plagioclase textures and the temperature gradient (900–980 °C) calculated from thermometers (Métrich et al., in review). Fluid inclusions fully support the presence of a free water-rich vapour phase (Supplementary Figure S5a,b). No dissolved or exsolved CO2 was detected, even though some fluid inclusions show evidence of carbon bearing-complexes (Supplementary Figure S5e). Considering that the trachydacitic system contains an initial amount of 3.9 ± 0.1 wt% of dissolved H2O, we estimate a proportion of exsolved water of 3.5 wt% during in-situ crystallization of the trachydacite (Fig. 4a). The water content of the residual melt corresponds to a fluid pressure (PH O2 =Ptotal) of 90–120 MPa under equilibrium conditions, sug-gesting an upper limit of magma storage of 3.3–4.4 km assuming a crustal density of 2.8 g/cm3 23. Hence, the 1257 Samalas eruption was sustained by a trachydacite reservoir developed in the upper crust similarly to other large plinian eruptions24.
Sulphur concentrations in melt inclusions reflect a more complex behaviour (Fig. 4c,d). The parent basalt displays an average S content of 1940 ± 90 ppm, a value commonly measured in moderately oxidized, hydrous, arc basalts20. Poly-metallic sulphides (Cu-Fe-S) partitioning Cu (Fig. 2c) do not occur in S-rich melt inclusions but are ubiquitous in partly degassed glass embayments. The trachydacitic system displays a total S content of 870 ± 20 ppm distributed between the melt, the S-bearing minerals and the free gas phase. Sulphur concen-trations in melt inclusions of clinopyroxene (150 ± 20 ppm), orthopyroxene (180 ± 45 ppm) and amphibole (185 ± 45 ppm) are similar to that of the most evolved plagioclase-hosted melt inclusions (Fig. 4d). Matrix glasses
Figure 3. Volatile repositories in the 1257 trachydacitic system. Composition of the residual melt is recorded
by melt inclusions trapped in cpx, opx and amphibole whereas that of the whole magma (melt + mineral phases + pre-eruptive vapour) is preserved by melt inclusions in plagioclase An82–75. The existence of pre-eruptive vapour is illustrated by the occurrence of water-rich fluid inclusions in minerals (Supplementary Figure S5). CO2 is very likely present in pre-eruptive vapour. The whole system is likely the result of the mixing of trachydacitic magma batches displaying distinct volatile contents (Supplementary Figure S4f).
are the most degassed endmember with 50 ± 20 ppm of S (Supplementary Table S2). The positive correlation of S and FeO (Fig. 4d) corresponds to the S concentration at sulfide saturation (SCSS)25, in agreement with the occurrence of iron sulphide globules (up to 60 μm in size) entrapped with apatite in phenocrysts (mostly amphi-bole). However, the extent of FeO content range reflects the possible effect of magma mixing between melts displaying distinct S contents. The composition of iron sulphides (Supplementary Table S4) enabled to esti-mate a proportion of 0.01% of Fe-sulphides in the system (Methods), suggesting that they removed a negligible amount of S (~50 ppm) from the melt. Furthermore, the range of S concentrations in apatite (0.01–0.26 wt% of S,
Figure 4. Melt inclusions record the volatile evolution through magma differentiation and in-situ
crystallization. (a) H2O vs Th and (b) H2O vs FeO* contents in melt inclusions reflect water exsolution through magma differentiation. Reported average H2O content of basalt are calculated considering melt inclusions unaffected by H+ diffusion through host mineral (Supplementary Figure S6b). (c) S vs Th variation diagram in melt inclusions. (d) Positive correlation of S and FeO* in the 1257 melt inclusions is consistent with sulphide saturation. The S concentration at sulphide saturation (SCSS, dashed curve) was calculated with model B of Fortin et al.25. (e) Cl vs Th contents in melt inclusions and whole-rocks suggest that Cl has an incompatible behaviour during basalt differentiation. (f) Cl vs FeO* contents in melt inclusions, whole-rocks and matrix glasses reflect mixing between trachydacitic melts and Cl exsolution during in-situ crystallization of the 1257 trachydacite. The process of mixing is also demonstrated by the positive correlation of S and Cl (Supplementary Figure S4f). Symbols as in Fig. 2. Average initial volatile contents of melt inclusions representative of the basaltic magma and of the whole 1257 system as well as whole-rock compositions are reported with error bars (1σ).
Supplementary Figure S6) indicates the sporadic influx of SO2 in the gas phase26, as supported by the occurrence of submicroscopic crystals of anhydrite and gypsum (and other S-bearing complex minerals) on the walls of fluid inclusions (Supplementary Figure S5c–e).
The average Cl concentration in Rinjani-Samalas basalts (830 ± 80 ppm) is typical of a volcanic arc domain27. The trachydacitic system displays a total Cl content of 3500 ± 175 ppm (Fig. 4e) accounting for the Cl distributed between the melt, the Cl-bearing minerals (amphibole and apatite) and the pre-eruptive vapour. Simple mass balance calculation based on apatite composition (42.9 ± 0.2 wt% of P2O5 and 0.89 ± 0.02 wt% Cl; Supplementary Table S5) indicates that up to 1.5 ± 0.3% of apatite crystallised (Methods) with a negligible effect on the Cl centration of the melt (~130 ppm). Furthermore, amphibole from the 1257 trachydacite with an average Cl con-tent of 700 ± 100 ppm (Supplementary Table S6) only removed a minor amount of Cl from the melt. Residual melts trapped in pyroxenes (2250 ± 140 ppm), and amphibole (2170 ± 210 ppm) share similar Cl concentrations with matrix glasses (2170 ± 210 ppm; Supplementary Table S2), indicating low Cl exsolution from the melt dur-ing eruption. Cl is therefore dominantly exsolved into the pre-eruptive vapour phase at shallow depth, a feature that explains the significant decrease of the Cl/Th ratio during in-situ crystallization of the trachydacitic magma (Fig. 4e). Furthermore, the positive correlation between Cl and FeO (Fig. 4f) corroborates mixing of partly degassed trachydacitic magma batches differing by their volatile contents.
Pumice clasts from the four phases of the eruption contain on average 1230 ± 45 ppm of Cl (Table 1). This value is in agreement with the residual Cl content of matrix glasses after correction for crystallization. Br contents average 1.6 ± 0.2 ppm in basaltic scoria and 2.92 ± 0.08 ppm in 1257 pumice clasts (Table 1). The average Br/Cl ratio of the basaltic whole-rock (3.7 ± 0.4 × 10⁻³) is in agreement with the upper range of published values for arc/back-arc basin basalts (1–3.2 × 10⁻³)28. This probably suggests a minimum effect of syn-eruptive degassing on the Br/Cl ratio29. Considering that the whole-rock Br/Cl ratio (3.7 ± 0.4 × 10⁻³) is characteristic of the basaltic magma ratio, we calculated indirectly a Br concentration of 3.1 ± 0.4 ppm in the basalt containing 830 ± 80 ppm of Cl (Table 1). Such a Br content is comparable to the concentrations measured in basaltic melt inclusions of
Th S Cl Br
Concentrations (ppm)
Undegassed residual melt Cundegassed RM (MIs cpx, opx, amph) 170 ± 50 2235 ± 155
Degassed residual melt Cdegassed RM (Matrix glass) 16.3 50 ± 20 2170 ± 110
Pre-eruptive trachydacite Cpre–eruptive (MIs plagioclase ~An76) 9.0 ± 0.9 870 ± 20 3500 ± 175
Trachydacitic whole-rock CWR 9.5 ± 0.9 80 ± 20 1230 ± 45 2.92 ± 0.08
Parent basalt Cbasalt (MIs olivine ~Fo76) 1.7 ± 0.2 1940 ± 90 830 ± 80 3.1 ± 0.4
Basaltic whole-rock (712 AD scoria) 2.20 ± 0.07 39 ± 1 428 1.6 ± 0.2
Classic petrologic method
Volatile i loss Δ i = Cundegassed RM − Cdegassed RM × XRM (ppm) 140 ± 50 960 ± 190
Minimum mass released (Tg) 14 ± 5 96 ± 19
New approach: whole trachydacitic system
Volatile i loss Δ i = Cpre–eruptive − CWR (ppm) 790 ± 30 2270 ± 180
Mass released (Tg) 79 ± 6 227 ± 18
Contribution of the parent basalt
Theoretical amount of volatile available Csystem (ppm) 10090 ± 1480 4300 ± 720 16 ± 3
SCu–Fe–S (ppm) 690 ± 225
Sfluid (ppm) 8500 ± 1500
mSfluid assuming 1.5 wt% fluid (Tg) 13 ± 6
Volatile i loss Δ i = Csystem − CWR (ppm) 13 ± 3
Maximum mass released (Tg) 92 ± 8 1.3 ± 0.3
Global atmospheric mixing ratios (ppbv of Cl and pptv of Br) 36 90
Stratospheric emissions (Tg) 63–73 23–55 0.13–0.33
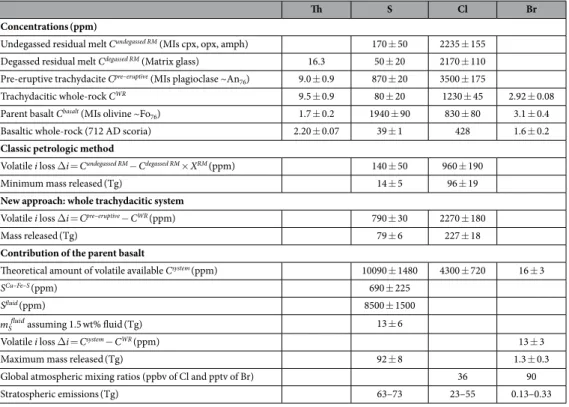
Table 1. Volatile degassing budget calculations. MIs: melt inclusions; cpx: clinopyroxene; opx:
orthopyroxene; amph: amphibole. Calculations of mass of volatile released and amount of S sequestered in Cu-Fe-S detailed in the method. XRM is the residual melt fraction, i.e. the ratio of Th contents in the 1257
trachydacitic whole-rock and the residual melt (0.59). The concentration Cisystem of each volatile species i in the
1257 trachydacitic system is derived from the C Ci/ Th ratio of the parent basalt assuming the conservation of the
ratio of volatile contents respective to Th during basalt differentiation. mSfluid=m ×X ×S
magma fluid fluid, where
Xfluid is the maximum amount of deeper-derived vapour (1.5 wt%). The maximum mass of S released is the sum
of the emissions of the trachydacitic system (79 Tg S) and mSfluid (13 Tg S). See text for Cl and Br. Global
atmospheric (troposphere and stratosphere) mixing ratios of halogen X is given by [ ]Xatm = nnX
air, where nX is the
amount of substance (moles) of halogen X released by the eruption, and nair is the amount of substance (moles)
of air in the atmosphere, i.e. 1.5 × 10²⁰ mol. Stratospheric emissions calculated as 80% of S and 10–25% of Cl and Br total emissions38. SO
Masaya, Nicaragua30. We stress that from the onset to the end of the 1257 eruption, whole-rocks record similar volatile concentrations (S, Cl, Br), suggesting a relatively constant extent of the syn-eruptive degassing.
Atmospheric volatile emissions of the 1257 Samalas eruption
The atmospheric volatile yields from volcanic eruptions are usually estimated using the petrologic method, which involves substracting the volatile concentrations in the residual melt corrected for crystallization from those of undegassed melt inclusions31. The pre-eruptive volatile contents of the residual melt (170 ± 50 ppm of S and 2235 ± 155 ppm of Cl) and that of the degassed matrix glass (50 ± 20 ppm of S and 2170 ± 110 ppm of Cl) indi-cate volatile losses of 140 ± 50 ppm of S and 960 ± 190 ppm of Cl (Table 1). When scaled to the mass of erupted magma (calculated using a volume of 40 km3 and a DRE density of 2500 kg/m3, see Methods), the syn-eruptive devolatilisation of the melt would have released 14 ± 5 Tg of S (28 Tg of SO2) and 96 ± 19 Tg of Cl. This calculation neglects, however, the amounts of S and Cl stored in the pre-eruptive vapour phase, and thus provides minimum estimates.
In the following, we quantify the atmospheric yields using the representative volatile contents of the whole 1257 trachydacitic system. Its S content is recorded by melt inclusions trapped in plagioclase An82–75 (Table 1) and accounts for the S allocated in the trachydacitic melt, the pre-eruptive vapour phase, and the iron sulphides (Fig. 3). We further assume that sulphide breakdown prior to eruption through interaction with a pre-existing fluid phase32 did not occur, as they likely remained stable prior to eruption. Given the negligible effect of iron sul-phide on the S dissolved in the melt, the S degassing (melt + vapour) is provided by the difference between the ini-tial S concentration of the system (870 ± 20 ppm) and the S content of the 1257 whole-rock (80 ± 20 ppm), which yields a loss of 790 ± 30 ppm (Table 1). Such a loss corresponds to the emission of 79 ± 6 Tg of S (158 ± 12 Tg of SO2).
The highest Cl content (3500 ± 175 ppm) recorded by the trachydacitic melt inclusions representative of the 1257 whole-rocks (Fig. 4e) accounts for the Cl allocated in the melt and in the pre-eruptive vapour phase. Using the average Cl concentration in the whole-rock (1230 ± 45 ppm), we calculate a Cl loss of 2270 ± 180 ppm, indic-ative of an atmospheric discharge of 227 ± 18 Tg of Cl (Table 1).
Underplating basalt may contribute to volatile emissions during plinian eruptions of silicic magmas6. Despite the absence of any obvious petrologic evidence of the contribution of the parent basalt into the degassing budget, we further explore how the potential contribution of a deeper-derived vapour phase would have increased the atmospheric emissions of the 1257 eruption. Using the S concentration of basaltic melt inclusions, we calculate that the trachydacitic system derived through 81% of fractional crystallization of the parent basalt would have contained 1 wt% of S (Ssystem; Table 1), distributed between the trachydacitic melt (Smelt), the pre-eruptive vapour
phase (Sfluid), and the poly-metallic sulphides (SCu–Fe–S). The Cu concentration decreases from basalt to
trachydac-ite (Fig. 2c) indicating that segregated Cu-bearing sulphides (Cu–Fe–S) sequestered a maximum of 690 ppm of S (Methods; Table 1). Considering such a sink of S in Cu-sulphides and the proportion of S dissolved in the trach-ydacitic melt (870 ± 20 ppm), the pre-eruptive vapour phase would have stored a maximum of 8500 ppm of S. This suggest a partition coefficient DSfluid melt/ of 13, which fills a gap of experimental constraints on S solubility for these
magma conditions. In order to calculate the mass of S that could have been emitted by additional pre-eruptive vapour, it is necessary to assess the amount of water lost during the magma differentiation. An amount of 5–6 wt% fluid is thought to be an upper limit beyond which percolation would occur and the fluid would be lost from the system33. Furthermore, an average value of 5 wt% fluid is consistent with the discrepancy between the water con-tent of the trachydacitic melt (3.7 ± 0.3 wt%) and the maximum H2O concentrations that an amphibole-bearing dacite could display (8–< 10 wt%)22. Assuming a maximum of 5 wt% of fluid in the system including 3.5 wt% exsolved during in-situ crystallization of the trachydacite, the parent basalt would have contributed to 1.5 wt% of supplementary vapour. This corresponds to an addition of 13 ± 6 Tg of S onto the S budget (Table 1). The large uncertainty on this estimate reflects the complexity of quantifying the proportion of water, the major component of the vapour phase. The 1257 eruption would thus have released a maximum of 92 ± 8 Tg of S (184 ± 16 Tg of SO2).
We estimate similarly a total theoretical Cl available in the trachydacitic system of 4300 ± 720 ppm (Table 1). Within the error, such concentration is relatively in agreement with the initial Cl content of the melt inclusions representative of the 1257 whole-rocks (3500 ± 175 ppm), suggesting minor Cl fractionation by Cl-bearing phases during basalt differentiation. The potential contribution of the parent basalt onto the Cl budget is thus likely negligible.
Partial exsolution of magmatic Br into pre-eruptive vapour may occur, and its fluid/melt partition coefficient
DBrfluid melt/ is typically much larger than DClfluid melt/ 34. Following the previous reasoning, the initial Br concentration
calculated for the parent basalt indicates a total of 16 ± 3 ppm Br available in the trachydacitic system (Table 1) allocated in both the melt and the pre-eruptive vapour phase. Using the average Br content of the 1257 whole-rocks (2.92 ± 0.08 ppm), we calculate a Br loss of 13 ± 3 ppm that corresponds to a maximum emission of 1.3 ± 0.3 Tg of Br (Table 1).
The largest volatile release of the Common Era
The 1257 Samalas eruption produced a S injection of 79 ± 6 Tg, equivalent to 158 ± 12 Tg of SO2 (Table 1), and a maximum of 184 ± 16 Tg of SO2 if the parent basalt contributed to the degassing budget. Hence, the influx of volatiles from the basalt would not exceed 15% of the total budget. Furthermore, our new approach increases by a factor of 5 the minimum S emission derived from the classic petrologic method. We stress that such emission probably occurred within a day9, and is much higher than the total annual global volcanic SO
2 flux of 15–21 Tg/yr associated with atmospheric emissions from both quiescent and explosive degassing volcanoes35. In addition to the prodigious S yield, the 1257 Samalas eruption emitted 227 ± 18 Tg of Cl, and a maximum of 1.3 ± 0.3 Tg of Br taking into account the potential contribution of the basalt. These yields stand as the largest volatile emissions
of the Common Era (Fig. 5), exceeding by a factor of two the SO2 emissions of the 946 Peaktu eruption (90 Tg of SO2)36, and of the 1815 Tambora eruption (73–91 Tg of SO2) that had a devastating impact on climate on a global scale. Furthermore, the Cl yield of the Samalas eruption constitutes the largest emission since the Minoan erup-tion of Santorini, 3,600 y B.P.37. Although the Br emissions have been estimated for only a few Holocene eruptions, the Br release of the 1257 Samalas eruption (1.3 ± 0.3 Tg) is similar to the maximum scenario of Br yield of the Minoan eruption (1.5 Tg of Br)37, and one order of magnitude higher than the Br emission of the Chiltepe erup-tion, 1.8 ka (0.125 Tg)30.
Stratospheric injection and potential impact on climate and atmospheric chemistry
Sulphur gases are scavenged by incorporation into ice particles in volcanic plumes before reaching the tropopause, resulting in stratospheric emissions which probably represents 80% of the initial injection38. Such a process would suggest that the 1257 Samalas eruption produced a stratospheric injection of ~126 Tg of SO2 (Table 1), which is within the range of the two SO2 stratospheric scenarios of 96 and 138 Tg of SO2 estimated based on climate modelling and tree-ring based hemispheric temperature reconstructions17. If the parent magma contributed to the degassing budget, the stratospheric injection of SO2 could reach up to 150 Tg, which should be considered as a maximum value. Hence, our estimates corroborate the upper range of sulphate yields derived from ice-core data and temperature reconstructions. We also stress that the low discrepancies between our stratospheric estimates and ice-cores based scenarios may reflect the efficient gas injection from the onset to the end of the eruption. Indeed, the stratospheric loading of volatiles is correlated to the initial dynamics of an eruption that needs to be sufficiently powerful to inject a pre-existing vapour phase accumulated at the top of the magmatic reservoir33,39 into the stratosphere via a high-flux gas jet and convective column before wholesale column collapse.The input of both volcanic Br and Cl enhances the catalytic destruction of ozone because the resulting BrO is a reaction partner for ClO40. Such reactions can occur either when halogens are released at tropospheric altitudes or when they are directly injected into the stratosphere. The Cl and Br emissions of the 1257 Samalas eruption represent initial atmospheric concentrations of 36 ppbv of Cl and 90 pptv of Br (Table 1). For comparison, the pre-industrial atmospheric Cl mixing ratio was 0.55 ppbv, corresponding to methyl chloride emissions from the oceans, i.e. before the onset of anthropogenically dominated emissions, and increased up to 3.8 ppbv in the late 1990s, during the Antarctic ozone hole climax41,42. The pre-industrial Br mixing ratio was 5 pptv, and increased up to 20 pptv in the late 1990s43. Hence, the 1257 Samalas eruption produced increments in globally averaged Cl and Br concentrations that exceed the pre-1980 levels by a factor of 65 for Cl and 18 for Br, and the ozone-hole climax concentrations by factors of 9 for Cl and 5 for Br. These results likely suggest that the 1257 eruption discharged enough halogen gases into the atmosphere to trigger ozone destruction cycles. We stress that such comparisons should be made carefully, however, given that the mixing ratios calculated for the 1257 Samalas eruption corre-spond to initial and local increases of Cl and Br concentrations, whereas background mixing ratios are global annual values.
A significant proportion of Cl and Br released by the 1257 Samalas eruption was likely scavenged by hydro-meteors during ascent in the plume and may not have reached the stratosphere. Although sattelite-based
Figure 5. The 1257 Samalas eruption produced the largest volatile emissions of the Common Era. Plots
of SO2, Cl and Br emissions (in Tg, i.e. megatons) for climate-impacting plinian eruptions. Yields of eruptions before 1980 are from petrological studies. Fine lines represent the maximum estimates (associated with the contribution of the parent basaltic magma in the case of the 1257 eruption). References: Minoan 3,600 y B.P. (Greece)37; Peaktu 946 A.D. (DPRK/China)36; Huaynaputina 1600 (Peru)66; Tambora 1815 (Indonesia), emissions re-calculated at 36–45 Tg S (73–91 Tg SO2) and 18–23 Tg Cl based on the syn-eruptive losses (400 ppm S; 200 ppm Cl)53,67 and new volume estimates of 41 ± 4 km3 DRE68 and 51 km3 DRE69); Cosigüina 1835 (Nicaragua)30,70; Krakatau 1883 (Indonesia)71; El Chichón 1982 (Mexico)72; Pinatubo 1991 (Philippines)4.
measurements of present-day volcanism enhanced our understanding of the fate of volcanic halogens in the stratosphere, much remains to be investigated, in particular concerning Br emissions and potential effects of large tropical explosive eruptions on stratospheric ozone44. Sophisticated plume experiments and modelling38 showed that 10% to 25% of halogen gases can reach the stratosphere, although the scavenging efficiency strongly depends on several parameters such as the latitude, the salinity of the fluid, the gas phase composition and the ability of ash particles to capture halogens45. Comparison of tropical versus high latitude eruptions shows that tropical humid atmospheric conditions, including the occurrence of a typhoon, may cause efficient scavenging of halogens as observed for the 1991 Pinatubo eruption46,47. It has been observed in the case of the 1982 El Chichón eruption, however, that a high mass flux rate within a plinian plume can partly preserve halogens from being scavenged, thus enhancing the stratospheric injection48. Considering that: (i) the 1257 Samalas eruption more likely occurred between May and July 1257, i.e. during the Indonesian dry season7,17; and (ii) the strong mass flux rates of the two plinian phases (2.8 × 10⁸ kg/s during phase 1 and 4.6 × 10⁸ kg/s during phase 3)9 are one order of magnitude higher than the maximum flux rate of the 1982 El Chichón eruption (6.8 × 10⁷ kg/s)49,50, we assume that the stratospheric injection of halogens could likely have reached 10 to 25% of the initial load. This would correspond to stratospheric injections of 23–57 Tg of Cl and 0.1–0.3 Tg of Br (Table 1) for the 1257 eruption. Volcanic-induced ozone depletion has been observed as a consequence of the 1991 Pinatubo eruption that caused the destruction of 2–6% of global average total ozone46 due to the release of 3–16 Tg of Cl4 most of which was scavenged by typhoon Yunya during the eruption. The combined Cl (51–675 Tg) and Br (0.1–1.5 Tg) emissions of the Minoan eruption of Santorini (Greece) would have provoked reductions of 20 to > 90% of ozone at northern high latitudes37. This strongly suggests that the 1257 Samalas eruption likely provoked strong ozone destruction, even for the lower-bound 10%-injection scenario. This process is enhanced by the simultaneous emission of S, as sulphate aerosols provide surface area for heterogeneous chemical reactions that activate Cl and Br species, thus enabling and enhancing the catalytic destruction of ozone51,52.
Our study underscores the fundamental importance of considering magmatic systems in their totality as well as the evolution of the behaviour of volatiles during magma differentiation in order to significantly improve the quantification of the degassing budget of large climate-impacting explosive eruptions. The application of this methodology to other magmatic systems that have produced volatile-rich intermediate magmas would enhance the reconstruction of the climate impact of past volatile emissions associated to eruptions of large to moderate volumes of S-rich magmas (e.g. 1815 Tambora53, 1835 Cosigüina54). Given the prodigious amounts of volatiles released by the 1257 Samalas eruption, interactions between processes involving S, Cl and Br should be consid-ered in future global scale climate-modelling. Although the probability of occurrence of such a large eruption in the next decades is statistically low, the ozone-destruction power of volcanic eruptions in general should be systematically assessed, particularly given that the Antarctic ozone-hole is decreasing43 and that stratospheric halogen concentrations are expected to reach their pre-industrial level during the second half of the century.
Methods
Calculation details.
Fraction of solid removal. We apply Rayleigh’s law to Th concentrations (Th is highlyincompatible) in basaltic and trachydacitic melts as C − =C ×f −
Thpre eruptive Thbasalt DTh 1, where CThpre eruptive− is the Th
content of the 1257 system (9.0 ± 0.9 ppm), CThbasalt is the Th content of the basalt (1.7 ± 0.2 ppm), f is the
propor-tion of remaining melt, and the global partipropor-tion coefficient of Th DTh is 1. Equation is then simplified as
= − C C f 1 Thpre eruptive
Thbasalt . We calculate a proportion of trachydacitic melt f of 0.19 ± 0.03, i.e. a solid removal (1− f) of 0.81.
Water loss during in-situ crystallization of the 1257 trachydacite. The conservation of the ratio of water respective
to Th during in-situ crystallization of the trachydacite is expressed as C −− =
C C C H O Pre eruptive Thpre eruptive H ORM ThRM 2 2 . In-situ crystallization of the 1257 trachydacite with 3.9 ± 0.1 wt% H2O and 9.0 ± 0.9 ppm Th indicates a theoretical water content of 7.2 wt% in the residual melt (RM). The latter actually contains 3.7 ± 0.3 wt% H2O, suggesting the exsolution of 3.5 wt% of H2O.
Proportion of apatite. Using P2O5 concentrations of the 1257 trachydacite (0.42 ± 0.05 wt%; Supplementary
Table S3) and of the 1257 matrix glass (0.13 ± 0.06 wt%; Supplementary Table S3), we estimate a P2O5 loss Δ P2O5 of 0.6 ± 0.1 wt% due to apatite crystallization during in-situ crystallization. The proportion of P2O5 in apatite
X ( P Oapat) 2 5 is given by = ∆ XP Oapat P O CP Oapat 2 5 2 5 2 5
, where CP Oapat2 5 is the P2O5 content of apatite (42.9 ± 0.2 wt%; Supplementary Table S5). We thus calculate a proportion of 0.015 ± 0.003 of apatite that would account for the removal of a max-imum of 130 ppm of Cl from the melt.
Proportion of Fe-sulphides in the 1257 trachydacitic system. The proportion of iron-sulphide in the 1257
trachy-dacite is derived from CWRS =CSdegassed RM×XRM+CSsulphide×Xsulphide, where XRM is the residual melt fraction
(0.59), and CSsulphide is the S content of Fe-sulphides (38.9 ± 0.5 wt%; Supplementary Table S4). This equation yields
a proportion of iron-sulphides Xsulphide of 0.01% in the 1257 trachydacite.
Mass of volatile released. The mass of volatile i released is calculated as mi = mmagma × Δ i × 10−15, where 10−15
is the conversion factor of ppm into kg, and mmagma = ρm × V is 1.00 ± 0.08 × 10¹⁴ kg (DRE magma density ρm is
Sulphur uptake by poly-metallic sulphides. Using Cu concentrations of the basalt (114 ± 32 ppm; Supplementary
Table S3) and of the 1257 trachydacite (11.4 ± 0.8 ppm; Supplementary Table S3) derived through 81% of crystal-lization, we calculate that 580 ppm of Cu (Δ Cu) were fractionated by Cu-bearing sulphides segregated during the basalt differentiation. The amount of associated S is given by SCu Fe S− − = ∆Cu×C /C
Ssulphide Cusulphide where CSsulphide
(32.1 ± 0.6 wt%) and CCusulphide (27.0 ± 1.1 wt%) are S and Cu contents in Cu-Fe sulphides, respectively
(Supplementary Table S4). This calculation yields an amount of 690 ± 225 ppm of S removed from the melt by poly-metallic sulphides. This amount is considered as a maximum because we neglected the possible fractiona-tion of Cu into the vapour phase.
Analysis of melt inclusions, matrix glasses and fluid inclusions.
Water and CO2 analysis. Meltinclusions were analysed using a Thermo-Nicolet 6700 FTIR spectrometer coupled with an optical/IR Spectra-Tech microscope (IPGP, France). Water and carbon concentrations were calculated using the Beer-Lambert law (C(wt%) = 100 × A × M/(ε × ρ × e), where A is the absorbance, M the molar mass (g/mol), ε the molar absorptivity (L/mol · cm), e the thickness (cm), and ρ the glass density in g/L). Melt inclusion densities were calculated with the model of Lange and Carmichael (1987), using a partial molar volume of water of 12.0 ± 0.5 cm3/mol55. Dissolved total water concentrations (H
2Omolec + OH−) were calculated using the broad
absorption band at 3550 cm−1 and absorption coefficients of 62.8 L/mol · cm56 for basalt, and of 68.7 ± 1.0 L/ mol · cm57 for trachydacite. Carbon concentrations were determined using the 1515 cm−1CO −
3
2 absorption band
after subtraction of the background, previously acquired on a volatile-free basalt. Deconvolution of the carbonate peaks taking into account the contribution of the 1630 cm−1 H
2Omolecular band was performed using PEAK FIT
software. The absorption coefficient was calculated as ε1515 = 451 − 342 × Na/(Na + Ca)58. The analytical uncer-tainties on CO2 and water concentrations were 17% and ≥ 10%, respectively. CO2 or carbonate ions were not observed in trachydacitic melt inclusions.
Major element, S and Cl analysis. Major element concentrations in glasses and host minerals were measured
by electron probe micro-analysis (EPMA) using a Cameca SXFive electron probe (Camparis, Paris, France). In melt inclusions they were measured with an accelerating voltage of 15 kV, a 4–10 nA defocused beam and peak counting times of 10–30 s depending on the element. Sodium was measured first with a 5 s peak count time in order to minimise alkali loss. S, Cl and P concentrations were determined with a 30 nA defocused beam and counting times of 120–200 s on peak. S speciation was investigated in these analytical conditions in a large olivine-hosted melt inclusion of the dataset, by scanning the peak position for the wavelength of S Kα radiation (λSKα)59. Accuracy of S and Cl measurements were ensured by analysis of KE12 (3332 ± 42 ppm Cl; 183 ± 6 ppm S; N = 57), of the alkali trachyte CFA47 (5399 ± 175 ppm Cl; 67 ± 17 ppm S; N = 61), and of the international standard Vg2 (291 ± 14 ppm Cl; 1435 ± 40 ppm S; N = 43). The analytical errors are ≤ 6% and 3% for S con-centrations < 200 ppm and above 1400 ppm, respectively; 4% and ≤ 2% for Cl concon-centrations < 300 ppm and > 3300 ppm, respectively. The detection limits were 55 ppm for S and 60 ppm for Cl.
Trace element analysis. Abundances of 30 traces elements (Ba, Ce, Co, Cu, Ni, Sc, V, Dy, Er, Eu, Gd, Hf, Ho, La,
Lu, Nb, Nd, Pb, Pr, Rb, Sm, Sr, Ta, Tb, Th, Tm, U, Y, Yb and Zr) were determined in melt inclusions by laser ablation inductively coupled plasma mass spectrometry (LA-ICP-MS) at the Laboratoire Magmas et Volcans (Université Blaise Pascal, Clermont-Ferrand, France), using a 193 nm ArF excimer laser ablation system (Resonetics M50) coupled to a 7500 cs Agilent ICP-MS system, with helium as the ablation gas. Samples were analysed using a laser repetition rate of 2 Hz, laser spot diameter range of 20–40 mm and pulse energy of 6 mJ (14 J/cm2). The background was measured for 30 s before ablation, and each analysis lasted 100 s. Measurements were cal-ibrated against NIST 612 glass standard60, using CaO as the internal element reference. Repeated analyses of BCR2-G glass international standard for each spot size were reproducible within 1 to ≤ 5% RSD for most elements and ≤ 7% RSD for Gd and some elements with low abundances such as Yb and Hf (< 5 ppm) and Tb, Tm, Lu and Ta (< 1 ppm). Our measurements on BCR-2G standard were compared to published values (Supplementary Table S7). Melt inclusions were analysed in single spot. Careful examination of counting statistics of each element and data reduction was performed using the Glitter software61.
Fluid inclusions characterisation. Plagioclase-hosted primary fluid inclusions of the 1257 A.D. rocks were
ana-lysed by Raman microspectrometry at the Ecole Normale Supérieure, Paris (France). Spectra were acquired in ambient conditions using a Renishaw INVIA spectrometer. This device is equipped with an Ar laser source giving an incident beam with a 514.5 nm wavelength, focused through a Leica microscope. The Rayleigh scattering com-ponent was removed by a Notch filter, and the Raman-scattered light was dispersed by a holographic grating with 1800 lines/mm and detected by a CCD camera. A power of 2 mW was used to avoid heating effects and sample damage. Raman spectra were acquired between 200 and 3900 cm−1 in order to identify S-, CO
2- and H2O- bearing components of the fluid phase.
Whole-rock analysis.
Major and trace element analyses of whole-rock samples are reported in Métrichet al. (in review). In this work, S and halogens (Cl, F and Br) were extracted by the pyrohydrolysis method62.
About 500 mg of powdered whole-rock mixed with ~500 mg of V2O5 in a platinum crucible was heated at 1200 °C in a quartz combustion tube through a H2O-vapour stream transported by a nitrogen flux. The extracted S and halogen species are converted into acids by hydrolysis in the H2O-vapour which was further condensed in a cooling system. The condensate was collected in a vial containing 10 mL of a NaOH solution (25 mmol/L). The vapour flux was adjusted in order to complete the extraction in 45–60 min and collect 80–100 ml of solution. The dilution factors (masssolution/masssample) ranged from 180 to 250. After the complete extraction, the solutions
(IC) with an Ion Pac AS9-HC (Dionex) anionic column, performed in suppression mode (ASRS-UltraII). The detection limit was 100 μg/L for both F and Cl in the sample solution. Solution concentrations were calculated using a calibration curve (0–50 ppm), and were further converted into rock concentrations using the dilution factor. Taking into account the mean dilution factor, detection limits in rock samples were 15 to 20 mg/kg for both elements. Br contents were determined using a 7900 Agilent ICP-MS device, in low resolution with a Scott spray chamber and a micro nebulizer (0.2 ml/min). Br was analysed in the ‘no gas’ mode, with an acquisition time of 0.3 sec, measuring 5 points as peak pattern, 3 replicates and 100 sweeps by replicates, 70 sec for the uptake, 40 sec as stabilisation time and 60 sec for rinsing time. Br solution concentrations were further calculated using a calibration curve (0–50 ppb), and were further converted into rock concentrations using the dilution factor. To ensure a complete extraction and the accuracy of the analyses, pyrohydrolysis/IC/ICP-MS was performed on international standards covering a wide compositional range and S, Cl, Br and F concentrations. We stress that our results were reproducible within 1–10% RSD for Cl, within 6–16% RSD for Br, and within 2–16% RSD for S except for AGV-1 (35% RSD). The efficient extraction of S from sulphide-bearing samples was guaranteed by the analysis of a sulfide-bearing syenite standard SY-2. Our results compared to published reference values are reported in Supplementary Table S8.
References
1. Schmidt, A. & Robock, A. Volcanism, the atmosphere and climate through time. In Schmidt, A., Fristad, K. E. & Elkins-Tanton, L. T. (eds) Volcanism Glob. Environ. Chang. 195–207 (Cambridge University Press, 2015).
2. Krüger, K., Kutterolf, S. & Hansteen, T. H. Halogen release from Plinian eruptions and depletion of stratospheric ozone. In Schmidt, A., Fristad, K. E. & Elkins-Tanton, L. T. (eds) Volcanism Glob. Environ. Chang. chap. 16, 244–259 (Cambridge University Press, 2015).
3. Robock, A. Volcanic eruptions and climate. Rev. Geophys. 45, 191–219 (2000).
4. Gerlach, T. M., Westrich, H. R. & Symonds, R. B. Preeruption Vapor in Magma of the Climactic Mount Pinatubo Eruption: Source of the Giant Stratospheric Sulfur Dioxide Cloud. In Newhall, C. G. & Punongbayan, C. G. (eds) Fire Mud Eruptions lahars Mt.
Pinatubo, Philipp. 415–433 (University of Washington Press, 1996).
5. Wallace, P. J. & Gerlach, T. M. Magmatic vapor source for sulfur dioxide released during volcanic eruptions: evidence from mount pinatubo. Science 265, 497–9 (1994).
6. Scaillet, B. & Pichavant, M. Experimental constraints on volatile abundances in arc magmas and their implications for degassing processes. Geol. Soc. London, Spec. Publ. 213, 23–52 (2003).
7. Lavigne, F. et al. Source of the great A.D. 1257 mystery eruption unveiled, Samalas volcano, Rinjani Volcanic Complex, Indonesia.
Proc. Natl. Acad. Sci. 110, 16742–16747 (2013).
8. Sigl, M. et al. Timing and climate forcing of volcanic eruptions for the past 2,500 years. Nature (2015).
9. Vidal, C. M. et al. Dynamics of the major plinian eruption of Samalas in 1257 A.D. (Lombok, Indonesia). Bull. Volcanol. 77, 73 (2015).
10. Connell, B., Gray, J. A., Redfern, R. & Walker, D. A bioarchaeological study of medieval burials on the site of St Mary Spital: excavations at Spitalfields Market, London E1, 1991–2007. Museum London Archeol. Monogr. Ser. 60, 1–303 (2012).
11. Miller, G. H. et al. Abrupt onset of the Little Ice Age triggered by volcanism and sustained by sea-ice/ocean feedbacks. Geophys. Res.
Lett. 39, 1–5 (2012).
12. Hammer, C. U. Acidity of polar ice cores in relation to absolute dating, pastvolcanism, and radio-echoes. J. Glaciol. 25, 359–372 (1980).
13. Langway, C. C., Clausen, H. & Hammer, C. An inter-hemispheric volcanic time-marker in ice cores from Greenland and Antarctica.
Ann. Glaciol. 10, 102–108 (1988).
14. Zielinski, G. et al. Record of volcanism since 7000 B.C. from the GISP2 Greenland ice core and implication for the volcano-climate system. Science (80-.) 264, 948–952 (1994).
15. Gao, C., Robock, A. & Ammann, C. Volcanic forcing of climate over the past 1500 years: An improved ice core-based index for climate models. J. Geophys. Res. Atmos. 113, 1–15 (2008).
16. Sigl, M. et al. Insights from Antarctica on volcanic forcing during the Common Era. Nat. Clim. Chang. 4, 6–10 (2014).
17. Stoffel, M. et al. Estimates of volcanic-induced cooling in the Northern Hemisphere over the past 1,500 years. Nat. Geosci. 8, 784–788 (2015).
18. Devine, D., Sigurdsson, H., Davis, N. & Self, S. Estimates of sulfur and chlorine yield to the atmosphere from volcanic eruptions and potential climatic effects. J. Geophys. Res. B Solid Earth 89, 6309–6325 (1984).
19. Nasution, A., Takada, A. & Mulyana, R. The volcanic activity of Rinjani, Lombok island, Indonesia, during the last 10000 years, viewed from 14C ages (Indonesian Association of Geologist, Convention Bandung 2004, 2004).
20. Wallace, P. J. & Edmonds, M. The Sulfur Budget in Magmas: Evidence from Melt Inclusions, Submarine Glasses, and Volcanic Gas Emissions. Rev. Mineral. Geochemistry 73, 215–246 (2011).
21. Plank, T., Kelley, K. & Zimmer, M. Why do mafic arc magmas contain ~4 wt% water on average? Earth Planet. Sci. Lett. 364, 168–179 (2013).
22. Grove, T. L., Till, C. B. & Krawczynski, M. J. The Role of H2O in Subduction Zone Magmatism. Annu. Rev. Earth Planet. Sci. 40, 413–439 (2012).
23. Planert, L. et al. Lower plate structure and upper plate deformational segmentation at the Sunda-Banda arc transition, Indonesia. J.
Geophys. Res. Solid Earth 115, 1–25 (2010).
24. Cashman, K. V. & Giordano, G. Calderas and magma reservoirs. J. Volcanol. Geotherm. Res. 288, 28–45 (2014).
25. Fortin, M.-A., Riddle, J., Desjardins-Langlais, Y. & Baker, D. R. The effect of water on the sulfur concentration at sulfide saturation (SCSS) in natural melts. Geochim. Cosmochim. Acta 160, 100–116 (2015).
26. Parat, F., Holtz, F. & Streck, M. J. Sulfur-bearing Magmatic Accessory Minerals. Rev. Mineral. Geochemistry 73, 285–314 (2011). 27. Ruscitto, D. M., Wallace, P. J., Cooper, L. B. & Plank, T. Global variations in H2O/Ce: 2. Relationships to arc magma geochemistry
and volatile fluxes. Geochemistry, Geophys. Geosystems 13, 1–27 (2012).
28. Kendrick, M. a. et al. Contrasting behaviours of CO2, S, H2O and halogens (F, Cl, Br, and I) in enriched-mantle melts from Pitcairn and Society seamounts. Chem. Geol. 370, 69–81 (2014).
29. Balcone-Boissard, H., Villemant, B. & Boudon, G. Behavior of halogens during the degassing of felsic magmas. Geochemistry
Geophys. Geosystems 11, 1–22 (2010).
30. Kutterolf, S. et al. Combined bromine and chlorine release from large explosive volcanic eruptions: A threat to stratospheric ozone?
Geology 41, 707–710 (2013).
31. Sisson, T. & Layne, G. H2O in basalt and basaltic andesite glass inclusions from four subduction-related volcanoes. Earth Planet. Sci. Lett. 117, 619–635 (1993).
32. Nadeau, O., Williams-Jones, A. E. & Stix, J. Sulphide magma as a source of metals in arc-related magmatic hydrothermal ore fluids.
Nat. Geosci. 3, 501–505 (2010).
33. Wallace, P. Volcanic SO2 emissions and the abundance and distribution of exsolved gas in magma bodies. J. Volcanol. Geotherm. Res.
108, 85–106 (2001).
34. Bureau, H., Keppler, H. & Métrich, N. Volcanic degassing of bromine and iodine: Experimental fluid/melt partitioning data and applications to stratospheric chemistry. Earth Planet. Sci. Lett. 183, 51–60 (2000).
35. Halmer, M. M., Schmincke, H. U. & Graf, H. F. The annual volcanic gas input into the atmosphere, in particular into the stratosphere: A global data set for the past 100 years. J. Volcanol. Geotherm. Res. 115, 511–528 (2002).
36. Iacovino, K. et al. Quantifying gas composition and yield from the 946 CE Millennium Eruption of Paektu volcano, DPRK/China.
Goldschmidt 2016 Conf. Abstr. 1223 (2016).
37. Cadoux, A., Scaillet, B., Bekki, S., Oppenheimer, C. & Druitt, T. H. Stratospheric Ozone destruction by the Bronze-Age Minoan eruption (Santorini Volcano, Greece). Sci. Rep. 5, 1–12 (2015).
38. Textor, C., Graf, H.-F. & Herzog, M. Injection of gases into the stratosphere by explosive volcanic eruptions. J. Geophys. Res. 108, 1–17 (2003).
39. Scaillet, B., Luhr, J. F. & Carroll, M. R. Petrological and volcanological constraints on volcanic sulfur emissions to the atmosphere.
Volcanism Earth’s Atmos. Geophys. Monogr. Ser. 139, 11–40 (2004).
40. Salawitch, R. J. et al. Sensitivity of ozone to bromine in the lower stratosphere. Geophys. Res. Lett. 32, 1–5 (2005).
41. Prather, M. J. & Watson, R. T. Stratospheric ozone depletion and future levels of atmospheric chlorine and bromine. Nature 344, 729–734 (1990).
42. Mégie, G. & McGinn, R. From stratospheric ozone to climate change: Historical perspective on precaution and scientific responsibility. Sci. Eng. Ethics 12, 596–606 (2006).
43. World Meteorological Organization. Scientific Assessment of Ozone Depletion. Tech. Rep. 56 (2014).
44. Mather, T. A. Volcanoes and the environment: Lessons for understanding Earth’s past and future from studies of present-day volcanic emissions. J. Volcanol. Geotherm. Res. 304, 160–179 (2015).
45. Gislason, S. R. et al. Characterization of Eyjafjallajokull volcanic ash particles and a protocol for rapid risk assessment. Proc. Natl.
Acad. Sci. 108, 7307–7312 (2011).
46. McCormick, M. P., Thomason, L. W. & Trepte, C. R. Atmospheric effects of the Mt Pinatubo eruption. Nature 373, 399–404 (1995).
47. von Glasow, R., Bobrowski, N. & Kern, C. The effects of volcanic eruptions on atmospheric chemistry. Chem. Geol. 263, 131–142 (2009).
48. Woods, A. W., Chuan, R. L. & Rose, W. I. Halite particles injected into the stratosphere by the 1982 El Chichón eruption. Science (80-.) 230, 170–172 (1985).
49. Varekamp, J. C., Luhr, J. F. & Prestegaard, K. F. The 1982 eruption of El Chichon volcano (Chiapas, Mexico): character of the eruptions, ash-fall deposits and gas phase. J. Volcanol. Geotherm. Res. 23, 39–68 (1984).
50. Sigurdsson, H., Carey, S. N. & Fisher, R. The 1982 eruption of El Chichon volcano, Mexico (3): physical properties of pyroclastic surges. Bull. Volcanol. 49, 467–488 (1987).
51. Solomon, S. Stratospheric ozone depletion: A review of concepts and history. Rev. Geophys. 37, 275 (1999).
52. Telford, P., Braesicke, P., Morgenstern, O. & Pyle, J. Reassessment of causes of ozone column variability following the eruption of Mount Pinatubo using a nudged CCM. Atmos. Chem. Phys. 9, 4251–4260 (2009).
53. Gertisser, R. et al. Processes and Timescales of Magma Genesis and Differentiation Leading to the Great Tambora Eruption in 1815.
J. Petrol. 53, 271–297 (2012).
54. Longpré, M. A., Stix, J., Costa, F., Espinoza, E. & Muñoz, A. Magmatic processes and associated timescales leading to the January 1835 eruption of Cosigüina Volcano, Nicaragua. J. Petrol. 55, 1173–1201 (2014).
55. Richet, P. et al. Water and the density of silicate glasses. Contrib. to Mineral. Petrol. 138, 337–347 (2000).
56. Mercier, M. et al. Spectroscopic analysis (FTIR, Raman) of water in mafic and intermediate glasses and glass inclusions. Geochim.
Cosmochim. Acta 74, 5641–5656 (2010).
57. Vidal, C. M. Dynamique éruptive et bilan de dégazage de l'éruption caldérique du Samalas en 1257 A.D. (Complexe volcanique du
Rinjani, Indonésie). Ph.D. thesis, IPGP - Université Sorbonne Paris Cité (2016).
58. Dixon, J. E., Stolper, E. M. & Holloway, J. R. An experimental study of water and carbon dioxide solubilities in mid-ocean ridge basaltic liquids. Part I: Calibration and solubility models. J. Petrol. 36, 1607–1631 (1995).
59. Carroll, M. R. & Rutherford, M. J. Sulfur speciation in hydrous experimental glasses of varying oxidation state; results from measured wavelength shifts of sulfur X-rays. Am. Mineral. 73, 845–849 (1988).
60. Gagnon, J. E., Fryer, B. J., Samson, I. M. & Williams-Jones, A. E. Quantitative analysis of silicate certified reference materials by LA-ICPMS with and without an internal standard. J. Anal. At. Spectrom. 23, 1529–1537 (2008).
61. Van Achterbergh, E., Ryan, C. G., Jackson, S. E. & Griffin, W. Data reduction software for LA-ICP-MS. Laser Ablation ICP-MS Earth
Sci. Princ. Appl. 39, 239–243 (2001).
62. Michel, A. & Villemant, B. Determination of halogens (F, Cl, Br, I), sulfur and water in seventeen geological reference materials.
Geostand. Geoanalytical Res. 27, 163–171 (2003).
63. Jarvis, A., Reuter, H., Nelson, A. & Guevara, E. Hole-filled SRTM for the globe Version 4. Int. Cent. Trop. Agric. available from
CGIAR-CSI SRTM 90m Database (http//srtm.csi.cgiar.org) (2008).
64. Self, S. & King, A. J. Petrology and sulfur and chlorine emissions of the 1963 eruption of Gunung Agung, Bali, Indonesia. Bull.
Volcanol. 58, 263–285 (1996).
65. Fontijn, K., Costa, F., Sutawidjaja, I., Newhall, C. G. & Herrin, J. S. A 5000-year record of multiple highly explosive mafic eruptions from Gunung Agung (Bali, Indonesia): implications for eruption frequency and volcanic hazards. Bull. Volcanol. 77, 59 (2015).
66. Costa, F. Massive atmospheric sulfur loading of the AD 1600 Huaynaputina eruption and implications for petrologic sulfur estimates. Geophys. Res. Lett. 30, 1068 (2003).
67. Self, S. Magma volume, volatile emissions, and stratospheric aerosols from the 1815 eruption of Tambora. Geophys. Res. Lett. 31, 10–13 (2004).
68. Kandlbauer, J. & Sparks, R. S. J. New estimates of the 1815 Tambora eruption volume. J. Volcanol. Geotherm. Res. 286, 93–100 (2014).
69. Carazzo, G., Kaminski, E. & Tait, S. The timing and intensity of column collapse during explosive volcanic eruptions. Earth Planet.
Sci. Lett. 411, 208–217 (2015).
70. Longpré, M.-a., Stix, J., Burkert, C., Hansteen, T. & Kutterolf, S. Sulfur budget and global climate impact of the A.D. 1835 eruption of Cosigüina volcano, Nicaragua. Geophys. Res. Lett. 41, 1–9 (2014).
71. Mandeville, C. W., Carey, S. & Sigurdsson, H. Magma mixing, fractional crystallization and volatile degassing during the 1883 eruption of Krakatau volcano, Indonesia. J. Volcanol. Geotherm. Res. 74, 243–274 (1996).
72. Bluth, G. J. S., Rose, W. I., Sprod, I. E. & Krueger, A. J. Stratospheric loading of sulfur from explosive volcanic eruptions. J. Geol. 105, 671–684 (1997).
Acknowledgements
We thank the Indonesian Ministry of Research an Technology RISTEK and the Nusa Tengara Barat Governor’s Office, M. Hendrasto (CVGHM), Surono (Badan Geologi) and J.-P. Toutain (IRD) for their permission to conduct fieldwork and administrative support. We also thank H. Rachmat, Muntaharlin and J.-P. Degeai for providing additional samples. We thank M. Fialin, N. Rividi, J.-L. Devidal, D. Deldicque and V. Zanon for dedicated assistance during EPMA, LA-ICP-MS and Raman analyses. 14C dates were obtained by C. Moreau and J.-P. Dumoulin (LMC14, CNRS UMS2572). SRTM data was provided by CIAT-CSI. This study was partly funded by INSU-CNRS CT3-ALEA projects ECRin I and II and INSU-CNRS Artemis 2014 for 14C dating in the framework of C.M. Vidal PhD’s thesis. This is IPGP contribution 3754.
Author Contributions
C.M.V., N.M. and J.-C.K. conducted fieldwork, sampling, sample preparation and analysis, interpreted the results, performed degassing budget calculations and co-wrote the manuscript and co-drafted the figures. A.M. conceived and conducted the pyrohydrolysis/IC/ICP-MS analyses. I.P., N.K., V.R. and F.L. conducted fieldwork and sampling. All authors reviewed the manuscript.
Additional Information
Supplementary information accompanies this paper at http://www.nature.com/srep Competing financial interests: The authors declare no competing financial interests.
How to cite this article: Vidal, C. M. et al. The 1257 Samalas eruption (Lombok, Indonesia): the single greatest
stratospheric gas release of the Common Era. Sci. Rep. 6, 34868; doi: 10.1038/srep34868 (2016).
This work is licensed under a Creative Commons Attribution 4.0 International License. The images or other third party material in this article are included in the article’s Creative Commons license, unless indicated otherwise in the credit line; if the material is not included under the Creative Commons license, users will need to obtain permission from the license holder to reproduce the material. To view a copy of this license, visit http://creativecommons.org/licenses/by/4.0/