Difference in Risk Factors for Postoperative Nausea and
Vomiting
Michaela Stadler, M.D., M.Sc.,* Françoise Bardiau, R.N., Ph.D.,† Laurence Seidel, M.Sc.,‡ Adelin Albert, Ph.D.,§ Jean G. Boogaerts, M.D., Ph.D.储
Background:It is commonly stated that risk factors for post-operative nausea are the same as for vomiting. The authors designed a prospective study to identify and differentiate the risk factors for postoperative nausea and vomiting in various surgical populations in a clinical audit setting.
Methods:The study included 671 consecutive surgical inpa-tients, aged 15 yr or more, undergoing various procedures. The study focused on postoperative nausea visual analog scale scores every 4 h and vomiting episodes within 72 h. Both vomiting and retching were considered as emetic events. Pa-tient-, anesthesia-, and surgery-related variables that were con-sidered to have a possible effect on the proportion of patients experiencing postoperative nausea and/or vomiting were ex-amined. The bivariate Dale model for binary correlated out-comes was used to identify selectively the potential risk factors of postoperative nausea and vomiting.
Results: Among the 671 patients in the study, 126 (19%) reported one or more episodes of nausea, and 66 patients (10%) suffered one or more emetic episodes during the studied pe-riod. There was a highly significant association between the two outcomes. Some risk factors were predictive of both nausea and vomiting (female gender, nonsmoking status, and general an-esthesia). History of migraine and type of surgery were mainly responsible for nausea but not for vomiting. The predictive effect of risk factors was controlled for postoperative pain and analgesic drugs.
Conclusion:This study shows that differences exist in risk factors of postoperative nausea and vomiting. These could be explained by differences in the physiopathology of the two symptoms.
POSTOPERATIVE nausea and vomiting— usually summa-rized as PONV—remains one of the most common and distressing complications after surgery. Several studies have outlined the factors related to an increased inci-dence of PONV with the aim to target specific patients who might need effective antiemetic prophylaxis.1–13It
is assumed that PONV has a multifactorial origin, such as patient-related factors (e.g., female gender, history of motion sickness, or PONV), anesthetic factors (e.g., mask ventilation, volatile anesthetics, opioids), and surgical factors.1–3
It is commonly assumed that risk factors for postoper-ative nausea are virtually the same as those for vomit-ing.6,8 However, review of the literature on individual factors contributing to PONV is often complicated by the lack of standardization in the definitions of “nausea,” “retching,” and “vomiting.” The interchangeable use of the terms nausea and vomiting has led to much confu-sion because the symptoms do not always accompany each other in severity. In some studies, analysis of PONV is restricted to vomiting, whereas in others, nausea, vomiting, and retching are recorded together. The score constructed by Apfel et al.11,12only dealt with vomiting and did not try to predict nausea. These inconsistencies have limited the significance of interstudy analyses. Re-cently, Tramèr14 proposed that nausea and vomiting should be reported and analyzed separately, considered as “two biologically different phenomena.” This is not an easy task since the two complications often occur to-gether and are therefore highly correlated.
The present epidemiologic study was designed to dis-cern risk factors of PONV with a clear distinction be-tween the two events. Nausea and vomiting were re-corded as two different end points, using a quantitative analysis. The survey was performed in a clinical audit setting.
Materials and Methods
A standardized follow-up survey of PONV incidence was performed over a 3-month period, including all surgical inpatients older than 15 yr who were able to read and understand French and were undergoing vari-ous elective surgical procedures: orthopedics, neurosur-gery, vascular–thoracic, ophthalmology, maxillofacial, gynecology, urology, plastic, abdominal, stomatology, and ear, nose, and throat (ENT). Thus, a representative sample of everyday surgery was achieved. Patients were excluded if they were unable to understand or realize a visual analog scale (VAS) test, were transferred directly to an intensive care unit, were undergoing an emergency procedure, had preexisting nausea or vomiting, or had received drugs with antiemetic properties 4 h before surgery. Prior to the start of the study, local Ethics Committee (Charleroi, Belgium) approval was obtained, and written informed consent was given by all patients. Inclusion was prospective and consecutive. At the time of the preoperative visit, a case report form was filled out for each patient by the attending anesthesiol-ogist. It contained characteristics assumed to be predic-* Staff Anesthesiologist, Department of Anesthesiology, and Director, Acute
Pain Service, † Assistant Director of Nursing,储 Professor of Anesthesia and Chair-man, Department of Anesthesiology, University Hospital Center of Charleroi. ‡ Biostatistician, § Professor of Biostatistics, Department of Biostatistics, Univer-sity of Liege, Liege, Belgium.
Received from the Department of Anesthesiology, University Hospital Center of Charleroi, Charleroi, Belgium. Submitted for publication April 2, 2002. Accepted for publication August 20, 2002. Supported by the Research Founda-tion of the University Hospital Center of Charleroi, Charleroi, Belgium. Presented in part at the annual meeting of the American Society of Anesthesiologists, San Francisco, California, October 14 –18, 2000.
Address reprint requests to Dr. Stadler: Department of Anesthesiology, University Hospital Center of Charleroi, 92 boulevard Paul Janson, 6000 Charleroi, Belgium. Address electronic mail to: [email protected]. Individual article reprints may be purchased through the Journal Web site, www.anesthesiology.org.
tive for PONV (see Materials and Methods section, fourth paragraph). Patients were familiarized with a 10-cm VAS device for pain (0 ⫽ no pain; 10 ⫽ worst imaginable pain) and nausea (0 ⫽ no nausea at all, 10 ⫽ worst imaginable nausea) assessment.15No special instructions were given to the attending anesthesiologist regarding anesthesia and postoperative analgesia regimens. Details of anesthesia and surgery, as well as all postoperative events, were recorded on the same case report form that followed the patient during the survey.
Upon arrival in the postanesthesia care unit, patients were asked by the nurse to rate their nausea experience on the VAS device. This process was repeated every 2 h for the first 4 h and was continued every 4 h within 72 h on the surgical ward. The VAS score measured nausea intensity at the time of assessment. Nausea was not assessed while the patient was asleep. Vomiting was recorded as either present or absent by direct observa-tion, by spontaneous complaint at the time of face-to-face interview with the patient every 4 h. The times and number of vomiting and retching episodes were re-corded. Both vomiting and retching were considered as emetic events.4 Data concerning nausea and vomiting were registered on the patient’s case report form. The intensity of pain was also evaluated at the same time as nausea using a VAS. All drugs given for pain relief were documented. Patient records, nurses’ notes, and medi-cation sheets were reviewed in detail by the study inves-tigators to ensure completeness of the information.
Factors considered to have a possible effect on the risk of experiencing PONV (nausea and/or vomiting) in-cluded age, female gender, body mass index (BMI), non-smoking status, history of migraine, motion sickness and PONV, type of anesthesia (general or locoregional), and type and duration of surgery (⬎ 100 min or not).16 Postoperative pain and analgesic consumption (mor-phine, paracetamol, and nonsteroidal antiinflammatory drugs) were also used to control for postoperative status and treatment of the patients. In the subsequent study, nausea and vomiting were considered as the two out-comes of interest.
Statistical Analysis
Results were expressed as mean⫾ SD for quantitative variables and as proportions for categorical factors. Post-operative incidence rates of nausea and vomiting were estimated from the data. Time-related pain VAS measure-ments were summarized by various parameters as de-scribed elsewhere: AUC ⫽ area under the VAS–time curve (cm⫻ h); mean VAS (cm); VASmax ⫽ peak of VAS (cm); Tmax⫽ time of VASmax (h); and PVAS ⬎ 3 ⫽ the persistence of pain VAS over 3 cm, i.e., the time period during which pain VAS was above the critical threshold (h).17,18 The bivariate Dale model was used to identify risk factors specifically associated with nausea, vomiting, or both complications.19 This method models the joint
probability of the two binary outcomes, P(nausea, vom-iting), where nausea and vomiting are coded 0 for absent and 1 for present, and accounts for the association be-tween them, in contrast to classic approaches, which simply consist of considering the two outcomes as inde-pendent and applying logistic regression to each of them separately. In addition, the Dale model has an attractive property in the sense that the marginal probabilities, P(nausea) and P(vomiting), can be expressed as logistic functions and the effects of the covariates can be inter-preted in terms of odds ratios (OR). In the Dale model, one has to estimate (1) the regression coefficients of the covariates for nausea, (2) the regression coefficients of the covariates for vomiting, and (3) the association pa-rameter between nausea and vomiting. It is also possible to test whether the association is dependent on the covariates. The estimation of the unknown parameters of the Dale model and of their SEs is carried out by the maximum likelihood method. It is therefore possible to assess the significance of each covariate’s effect and of the association by a classic normal test (parameter esti-mate divided by SE). The simplest Dale model is the so-called tetrachoric model (no covariate included), which is fitted to the 2 ⫻ 2 table obtained by cross-classifying patients according to nausea and vomiting. In turn, the most complicated model incorporates all co-variates for both outcomes. Statistical calculations were carried out by means of the SAS package (SAS Institute, Cary, NC; version 8 for Windows), always using all data available. Results were considered to be significant at the 5% critical level (P⬍ 0.05).
Results
A sample of 671 surgical patients with complete case report forms was included in the study. The distribution of patients according to type of surgery was as follows: orthopedics (141), neurosurgery (54), vascular (32), ophthalmology (8), maxillofacial (41), gynecology (69), urology (58), plastic (32), abdominal (184), stomatology (23), and ENT (29).
The patients preoperative characteristics are summa-rized in table 1. There were 317 (47%) women and 354 (53%) men with a mean age of 47.7 ⫾ 17.4 yr. The proportion of nonsmokers was amounted to 63%. More than 25% of the patients had a history of PONV, motion sickness, or migraine. Eighty patients (12%) had an American Society of Anesthesiologists physical status of III or IV, whereas 102 patients (15%) experienced their first surgery. Premedication was administered to 653 (97%) of the patients. The majority of them received midazolam (92%) and atropine (74%).
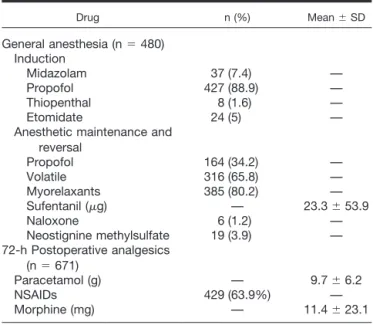
Among the patients, 480 (72%) received general anes-thesia, and 191 (28%) received locoregional anesthesia. The drugs used for general anesthesia are detailed in
table 2. The induction of general anesthesia was per-formed in 89% of the patients with propofol. Anesthesia was maintained with a combination of nitrous oxide, isoflurane, and sufentanil in 316 patients (66%); the oth-ers received continuous administration of propofol and sufentanil (34%). Neuromuscular blocking agents, in-cluding atracurium or rocuronium, were administered in 385 (80%) of the patients. Pharmacologic reversal of neuromuscular blocking agents was administered in 19 patients (4%) using neostigmine methylsulfate at a mean dose of 1.5 mg associated with glycopyrrolate (mean dose, 0.4 mg) or atropine (mean dose, 0.3 mg). The mean dose of sufentanil used was 23.3⫾ 53.9g.
Opi-oids were antagonized in six patients (1.2%) using nal-oxone. Duration of anesthesia (general and locoregional) was 100⫾ 66 min.
During the 72 postoperative hours (table 2), paraceta-mol was given to all patients with a mean dose of 9.7⫾ 6.2 g. Nonsteroidal antiinflammatory drugs were used in 429 patients (64%), and morphine was administered in 324 patients (48%) at a mean dose of 11.4 ⫾ 23.1 mg. Patient-controlled analgesia was prescribed in 20 pa-tients (1.5%) during the study period. Postoperatively, pain VAS characteristics were the following: AUC (59⫾ 69 cm⫻ h), mean VAS (1.0 ⫾ 1.1 cm), VASmax (3.9 ⫾ 2.5 cm), the time of maximal VAS, Tmax (8.2⫾ 13 h), and PVAS⬎ 3 (6.1 ⫾ 11.2 h).
The distribution of patients according to postoperative nausea and vomiting is given in table 3. The overall incidence of nausea was 19%, and that of vomiting was 10%. Nausea alone occurred in 73 (11%) patients, vom-iting alone occurred in 13 (2%) patients, 53 (8%) patients suffered from both nausea and vomiting, while 532 (79%) were free from the complications. There was a strong association between the two outcomes. Among the 126 patients with nausea, 53 (42%) experienced vomiting. Conversely, among the 66 patients with vom-iting, 53 (80%) had nausea. Postoperative nausea scores, expressed as area under the nausea–VAS time curve (AUC) was 2.9⫾ 11.4 cm ⫻ h, mean VAS 0.32 ⫾ 0.83 cm and VASmax 0.7⫾ 1.8 cm. The time of the peak of VAS (Tmax) occurred at 2.4 ⫾ 8.1 h postoperatively. Mean time of vomiting episodes was estimated at 10.1⫾ 11.4 postoperative hours. By fitting the tetrachoric model (Dale model with no covariates), the parameters were highly significant (estimates⫾ SE): 1.43 ⫾ 0.12 for nausea, 2.09⫾ 0.15 for vomiting, and 3.55 ⫾ 0.40 for the association, respectively (P ⬍ 0.0001). Thus, by taking the exponential of the association coefficient (3.55), the odds of vomiting for patients with nausea were about 35 times the odds of vomiting for patients without nausea, and vice versa, emphasizing the strong association between the two outcomes.
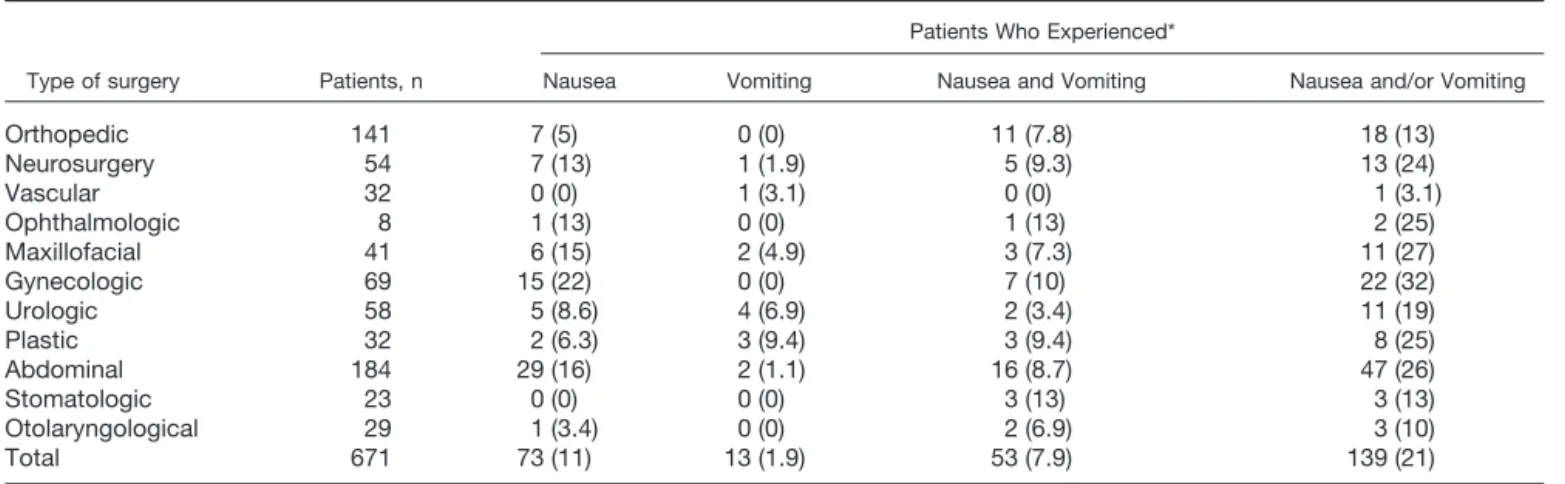
In table 4, a detailed distribution of postoperative nau-sea and/or vomiting is given according to type of sur-gery. A clear relationship can be seen between the two outcomes and type of surgery. Patients undergoing gy-necologic (32%), abdominal (26%), maxillofacial (27%), plastic (25%), neurosurgical (24%) and urological (19%) surgical procedures had the highest incidences of PONV.
Table 1. Patient Characteristics
Variable Frequency (%) Mean⫾ SD
Sex Female 317 (47) — Male 354 (53) — Age (yr) — 47.7⫾ 17.4 Weight (kg) — 73.5⫾ 17.1 Height (cm) — 167.2⫾ 9.5 BMI (kg/m2) — 26.2⫾ 5.4 Nonsmoking status 420 (62.6%) — History Nausea or vomiting 48 (7.2) —
PONV or motion sickness 68 (10.1) —
Migraine 63 (9.3) — ASA status I 339 (50.5) — II 252 (37.6) — III 69 (10.3) — IV 11 (1.64) — First surgery 102 (15.3) —
ASA⫽ American Society of Anesthesiologists; BMI ⫽ body mass index; PONV⫽ postoperative nausea and vomiting.
Table 2. Anesthetic and Postoperative Analgesic Drugs
Drug n (%) Mean⫾ SD General anesthesia (n⫽ 480) Induction Midazolam 37 (7.4) — Propofol 427 (88.9) — Thiopenthal 8 (1.6) — Etomidate 24 (5) —
Anesthetic maintenance and reversal Propofol 164 (34.2) — Volatile 316 (65.8) — Myorelaxants 385 (80.2) — Sufentanil (g) — 23.3⫾ 53.9 Naloxone 6 (1.2) — Neostignine methylsulfate 19 (3.9) — 72-h Postoperative analgesics (n⫽ 671) Paracetamol (g) — 9.7⫾ 6.2 NSAIDs 429 (63.9%) — Morphine (mg) — 11.4⫾ 23.1
NSAID⫽ nonsteroidal antiinflammatory drug.
Table 3. Distribution of Patients According to Postoperative Nausea and Vomiting
Nausea Vomiting Total n (%) No Yes No 532 13 545 (81) Yes 73 53 126 (19) Total, n (%) 605 (90) 66 (10) 671 (100)
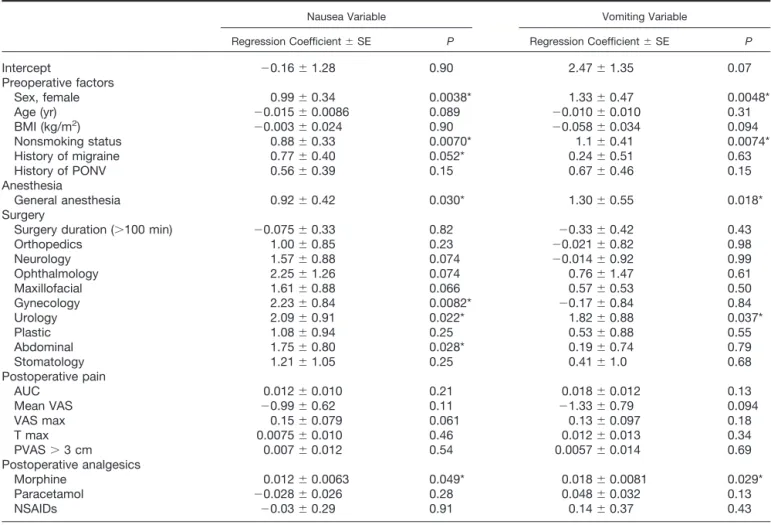
To identify among preoperative and perioperative risk factors those predictive of postoperative nausea and vomiting, we fitted the bivariate Dale model to the data set by including all covariates, namely, gender, age, BMI, nonsmoking status, history of migraine and of PONV, type of anesthesia, and duration and type of surgery (using ENT as the reference group). To control for post-operative factors, VAS pain parameters (AUC, mean VAS, VASmax, Tmax, and PVAS ⬎ 3) and analgesic drugs (morphine, paracetamol, and nonsteroidal antiinflamma-tory drugs) were also included in the Dale model. Pa-tients with vascular surgery were excluded from the analysis because of a singularity in the maximum likeli-hood estimation process; this was explained by the fact that only one vascular patient experienced vomiting alone as seen in table 4. Results are displayed in table 5, which gives for each covariate and each outcome the estimated regression coefficient with its SE and corre-sponding P value. Positive coefficients are associated with an increased risk of developing the complication (OR⬎ 1). Conversely, negative coefficients correspond to a protective effect against the complication (OR⬍ 1). It is seen that female gender, nonsmoking status, and general anesthesia are significantly related to both nau-sea and vomiting. Specifically, women are at greater risk of nausea (OR⫽ 2.69; 1.38–5.24) and of vomiting (OR⫽ 3.78; 1.51–9.50) than men. The same argument applies for nonsmokers who are more likely to develop the complications than smokers: nausea (OR ⫽ 2.41; 1.26 – 4.60) and vomiting (OR ⫽ 3.0; 1.35–6.71). Pa-tients undergoing general anesthesia have an increased risk of nausea (OR⫽ 2.51; 1.10–5.72) and of vomiting (OR ⫽ 3.67; 1.25–10.8) when compared to patients undergoing locoregional anesthesia. Among anesthesia-related factors, maintenance of anesthesia with propofol did not alter the risk for nausea and/or vomiting (P⫽ 0.61). Patients who had nausea or vomiting received a similar amount of sufentanil throughout the perioperative period as patients without these symptoms (P⫽ 0.74).
History of migraine was almost significantly related to
nausea (P ⫽ 0.052) but not to vomiting (P ⫽ 0.63). Duration of surgery was unrelated to outcomes. Overall, however, the type of surgery was significantly associated with nausea but not with vomiting, except for urological procedures (P ⫽ 0.037). As seen in table 5, patients undergoing gynecological (P⫽ 0.0082), urological (P ⫽ 0.022), abdominal (P⫽ 0.028), and, to a lesser extent, neurologic (P⫽ 0.074), ophthalmologic (P ⫽ 0.074), or maxillofacial (P⫽ 0.066) surgery had an increased risk of developing nausea but not vomiting when compared to ENT patients.
It should be noted that postoperative morphine doses were slightly more significantly associated with vomiting (OR⫽ 1.02; P ⫽ 0.029) than with nausea (OR ⫽ 1.01;
P⫽ 0.05), while pain parameters were not significant.
More importantly, in the full Dale model, the association parameter between nausea and vomiting was still highly significant (3.74⫾ 0.54; P ⬍ 0.0001) but was unrelated to the covariates. Thus, even when accounting for co-variates, the two outcomes remained strongly depen-dent on each other (i.e., they most often did and did not occur together).
Discussion
Although risk factors for postoperative nausea are gener-ally assumed as being the same as those for vomiting, the present study made a clear distinction between the two events, considered as two different end points.3,6,8,11 In-deed, we found that some risk factors were predictive of both nausea and vomiting (female gender, nonsmoking status, general anesthesia) but that history of migraine and type of surgery, with the exception of urology, were solely related to nausea. There was a clear relationship be-tween nausea and vomiting. In the present study, the overall incidence rate for nausea amounted to 19%, and that for vomiting amounted to 10%. Approxi-mately half of the patients with nausea suffered also from vomiting. This is in accordance with the survey performed by Koivuranta et al.8
Table 4. Distribution of the Patients with Nausea and Vomiting According to Type of Surgery
Type of surgery Patients, n
Patients Who Experienced*
Nausea Vomiting Nausea and Vomiting Nausea and/or Vomiting
Orthopedic 141 7 (5) 0 (0) 11 (7.8) 18 (13) Neurosurgery 54 7 (13) 1 (1.9) 5 (9.3) 13 (24) Vascular 32 0 (0) 1 (3.1) 0 (0) 1 (3.1) Ophthalmologic 8 1 (13) 0 (0) 1 (13) 2 (25) Maxillofacial 41 6 (15) 2 (4.9) 3 (7.3) 11 (27) Gynecologic 69 15 (22) 0 (0) 7 (10) 22 (32) Urologic 58 5 (8.6) 4 (6.9) 2 (3.4) 11 (19) Plastic 32 2 (6.3) 3 (9.4) 3 (9.4) 8 (25) Abdominal 184 29 (16) 2 (1.1) 16 (8.7) 47 (26) Stomatologic 23 0 (0) 0 (0) 3 (13) 3 (13) Otolaryngological 29 1 (3.4) 0 (0) 2 (6.9) 3 (10) Total 671 73 (11) 13 (1.9) 53 (7.9) 139 (21)
The importance of female gender is well estab-lished and appears as the most important predictor of PONV.3– 6,9 –12,20 In our survey, nonsmoking status in-creased both the incidence of nausea and vomiting, as already demonstrated by others.6,8,11,13,21,22 History of migraine majored nausea without any influence on vomiting.8
Our study pointed out that BMI and history of PONV or motion sickness had no predictive value for the occur-rence of nausea and vomiting when accounting for the other factors. Although some authors have suggested that incidence of PONV is increased in obese patients, we were not able to identify a high BMI as a risk factor in the bivariate Dale model.1,2,6 Muir et al.,23 Apfel et
al.,11,12,24and more recently Kranke et al.25in a system-atic review did not find a relationship between BMI and the incidence of PONV, either.
Among perioperative related factors, general anesthe-sia influenced the probability of nausea and vomiting, but there was no direct association between the dura-tion of anesthesia and the incidence of PONV, as dem-onstrated by Sinclair et al.13Administration of propofol for anesthesia induction and/or maintenance did not
reduce the risk for early nausea or delayed vomiting in our surgical population. This is in accordance with the results of a meta-analysis performed by Tramèr et al.,26,27 who found that intravenous induction of anesthesia with propofol has no relevant effect on PONV. Only when propofol was used for induction and maintenance of anesthesia did the risk for early PONV seem to be smaller, as demonstrated by Tramèr et al.27and Ericks-son and Kortilla.28 Results of our study are unable to support this statement.
In the present study, patients without and with nausea or vomiting received a similar amount of sufentanil throughout the operative procedure. The role of opioids in PONV is unclear.29Review of the literature on anes-thetic factors contributing to PONV is difficult because of a lack of standardization. The incidence of PONV after administration of various anesthetic agents reported by different authors cannot be compared since each group of authors used different criteria and different popula-tion groups. Recently, Apfel et al.30 in a randomized control trial found that volatile anesthetics were the leading cause of early postoperative vomiting. Neverthe-less, this study included 46% of children and focused
Table 5. Results of the Application of the Bivariate Dale Model to Nausea and Vomiting Data
Nausea Variable Vomiting Variable
Regression Coefficient⫾ SE P Regression Coefficient⫾ SE P
Intercept ⫺0.16 ⫾ 1.28 0.90 2.47⫾ 1.35 0.07 Preoperative factors Sex, female 0.99⫾ 0.34 0.0038* 1.33⫾ 0.47 0.0048* Age (yr) ⫺0.015 ⫾ 0.0086 0.089 ⫺0.010 ⫾ 0.010 0.31 BMI (kg/m2) ⫺0.003 ⫾ 0.024 0.90 ⫺0.058 ⫾ 0.034 0.094 Nonsmoking status 0.88⫾ 0.33 0.0070* 1.1⫾ 0.41 0.0074* History of migraine 0.77⫾ 0.40 0.052* 0.24⫾ 0.51 0.63 History of PONV 0.56⫾ 0.39 0.15 0.67⫾ 0.46 0.15 Anesthesia General anesthesia 0.92⫾ 0.42 0.030* 1.30⫾ 0.55 0.018* Surgery
Surgery duration (⬎100 min) ⫺0.075 ⫾ 0.33 0.82 ⫺0.33 ⫾ 0.42 0.43
Orthopedics 1.00⫾ 0.85 0.23 ⫺0.021 ⫾ 0.82 0.98 Neurology 1.57⫾ 0.88 0.074 ⫺0.014 ⫾ 0.92 0.99 Ophthalmology 2.25⫾ 1.26 0.074 0.76⫾ 1.47 0.61 Maxillofacial 1.61⫾ 0.88 0.066 0.57⫾ 0.53 0.50 Gynecology 2.23⫾ 0.84 0.0082* ⫺0.17 ⫾ 0.84 0.84 Urology 2.09⫾ 0.91 0.022* 1.82⫾ 0.88 0.037* Plastic 1.08⫾ 0.94 0.25 0.53⫾ 0.88 0.55 Abdominal 1.75⫾ 0.80 0.028* 0.19⫾ 0.74 0.79 Stomatology 1.21⫾ 1.05 0.25 0.41⫾ 1.0 0.68 Postoperative pain AUC 0.012⫾ 0.010 0.21 0.018⫾ 0.012 0.13 Mean VAS ⫺0.99 ⫾ 0.62 0.11 ⫺1.33 ⫾ 0.79 0.094 VAS max 0.15⫾ 0.079 0.061 0.13⫾ 0.097 0.18 T max 0.0075⫾ 0.010 0.46 0.012⫾ 0.013 0.34 PVAS⬎ 3 cm 0.007⫾ 0.012 0.54 0.0057⫾ 0.014 0.69 Postoperative analgesics Morphine 0.012⫾ 0.0063 0.049* 0.018⫾ 0.0081 0.029* Paracetamol ⫺0.028 ⫾ 0.026 0.28 0.048⫾ 0.032 0.13 NSAIDs ⫺0.03 ⫾ 0.29 0.91 0.14⫾ 0.37 0.43
Association parameter between the two outcomes, nausea and vomiting: 3.74⫾ 0.54 (P ⬍ 0.0001). A P value ⬍ 0.05 was considered significant.
AUC⫽ area under the curve; BMI ⫽ body mass index; NSAID ⫽ nonsteroidal antiinflammatory drug; PONV ⫽ postoperative nausea and vomiting; PVAS ⫽ persistence of VAS pain scores; VAS⫽ visual analog scale; T max ⫽ time of the maximal pain score.
only on patients after specific surgical procedures, i.e., ENT and ophthalmology, known to maximize the inci-dence of PONV. No relationships could be established with our results.
It is commonly stated that the type of surgery influ-ences the risk of PONV.1–3,6Our data reflected a casual impact of surgical procedures on nausea alone, notably gynecology, and abdominal surgery with the exception of urology that increased both nausea and vomiting. These results are in contradiction with the papers from Apfel et al.16,24and other authors8,22,31who found that the type of surgery did not seem to play a major role in the incidence of PONV. Studies published to date have used a variety of methodologies that do not permit mean-ingful conclusions to be drawn. To our knowledge, this is the first that accounts for the high association between the two outcomes. In that respect, the bivariate Dale model is an interesting alternative to classic approaches, which apply logistic regression to each outcome sepa-rately and hence ignore the dependence structure of nausea and vomiting.
Our data showed that the dose of administered mor-phine significantly increased the incidence of nausea and vomiting. The outstanding importance of morphine use, not considered as a predictive factor, is in line with results of previous studies.1,32Postoperative pain did not influence nausea and vomiting. Nevertheless, our pa-tients benefited from formal acute pain management in the form of an acute pain service.17
The difference in risk factors for postoperative nausea and vomiting could be explained by the difference in the physiology of the two events.32–34Nausea is a subjective sensation requiring activation of neural pathways, which eventually project to areas of the cerebral hemispheres dealing with conscious sensations.34 Nausea is not al-ways followed by retching or vomiting. Vomiting is a complex reflex under the control of two functionally distinct medullar centers: the vomiting center in the dorsal portion of the lateral reticular formation and the chemoreceptor trigger zone in the area postrema of the floor of the fourth ventricle. Furthermore, it is well proved that an antiemetic drug may have more antinau-sea efficacy, i.e., droperidol, or more antiemetic efficacy,
i.e., the 5-HT3antagonists.14
As recently stated by Tramèr,14,35“more precise quan-tification of PONV incidence will come from studies where nausea and vomiting are separate endpoints, and the cumulative incidence of nausea and vomiting is re-ported at different time points.” The methodological issue used in this survey considered these recommenda-tions. In the present prospective investigation, we stud-ied a fairly large number of surgical inpatients. Nausea and vomiting episodes have been dissected every 4 h during a long observation period, namely 72 postopera-tive hours. Our study gave detailed information on the time course of postoperative nausea and vomiting.
Nau-sea was more frequently encountered in the postanes-thesia care unit, but vomiting episodes appeared later, around the 12th postoperative hour. Motion, including transportation on a stretcher during the recovery phase, can precipitate nausea.36 Furthermore, nausea intensity was assessed using a VAS device as a secondary end point.15These measurements are in accordance with the studies conducted by Cohen et al.6and Koivuranta et al.8 To confirm the results of the present study, larger-scale trials using a similar methodological approach should be carried out, not only in other centers but also on other surgical patient populations, e.g., in day-case surgery.
In conclusion, female gender, nonsmoking status, and general anesthesia increase both postoperative nausea and vomiting. History of migraine and a variety of sur-geries (gynecological, abdominal, neurologic, ophthal-mology, and maxillofacial) do or tend to influence nau-sea only. The clinical implication is important for prophylaxis and treatment of the two symptoms and could influence how future work in this area is done.
The authors thank Professor Geert Molenberghs, Ph.D. (Department of Biosta-tistics, Limburgs Universitair Centrum, Diepenbeek, Belgium), for helpful discus-sions and advice on the Dale model.
References
1. Watcha MF, White PF: Postoperative nausea and vomiting: Its etiology, treatment, and prevention. ANESTHESIOLOGY1992; 77:162– 84
2. Palazzo MG, Strunin L: Anaesthesia and emesis: I. Etiology. Can Anaesth Soc J 1984; 31:178 – 87
3. Lerman J: Surgical and patient factors involved in postoperative nausea and vomiting. Br J Anaesth 1992; 69(suppl 1):24S–32S
4. Kortilla K: The study of postoperative nausea and vomiting. Br J Anaesth 1992; 69(suppl 1):20S–23S
5. Bellville JW, Bross IDJ, Howland S: Postoperative nausea and vomiting: IV. Factors related to postoperative nausea and vomiting. ANESTHESIOLOGY1960; 21: 186 –93
6. Cohen MM, Duncan PG, DeBoer DP, Tweed WA: The postoperative inter-view: assessing risk factors for nausea and vomiting. Anesth Analg 1994; 78:7–16 7. Palazzo M, Evans R: Logistic regression analysis of fixed patient factors for postoperative sickness: A model for risk assessment. Br J Anaesth 1993; 70: 135– 40
8. Koivuranta M, Läärä E, Snare L, Alahuhta S: A survey of postoperative nausea and vomiting. Anaesthesia 1997; 52:443–9
9. Dent SJ, Ramachandra V, Stephen CR: Postoperative vomiting: Incidence, analysis and therapeutic measures in 3,000 patients. ANESTHESIOLOGY1955; 16: 564 –72
10. Burtles R, Peckett BW: Postoperative vomiting: Some factors affecting its incidence. Br J Anaesth 1957; 29:114 –23
11. Apfel CC, Greim CA, Haubitz I, Goepfert C, Usadel J, Sefrin P, Roewer N: A risk score to predict the probability of postoperative vomiting in adults. Acta Anaesthesiol Scand 1998; 42:495–501
12. Apfel CC, Greim CA, Haubitz I, Grundt D, Goepfert C, Sefrin P, Roewer N: The discriminating power of a risk score for postoperative vomiting in adults undergoing various types of surgery. Acta Anaesthesiol Scand 1998; 42:502–9
13. Sinclair DR, Chung F, Mezei G: Can postoperative nausea and vomiting be predicted. ANESTHESIOLOGY1999; 91:109 –18
14. Tramèr MR: A rational approach to the control of postoperative nausea and vomiting: Evidence from systematic reviews: Part II. Recommendations for prevention and treatment, and research agenda. Acta Anaesthesiol Scand 2001; 45:14 –9
15. Boogaerts JG, Vanacker E, Seidel L, Albert A, Bardiau FM: Assessment of postoperative nausea using a visual analogue scale. Acta Anaesthesiol Scand 2000; 44:470 – 4
16. Apfel CC, Kranke P, Eberhart LHJ, Roos A, Roewer N: Comparison of predictive models for postoperative nausea and vomiting. Br J Anaesth 2002; 88:234 – 40
17. Bardiau FM, Braeckman MM, Seidel L, Albert A, Boogaerts JG: Effectiveness of an acute pain service inception in a general hospital. J Clin Anesth 1999; 11:583–9
18. Boogaerts JG, Bardiau FM, Seidel L, Albert A, Ickx BE: Tropisetron in the prevention of postoperative nausea and vomiting. J Clin Anesth 2000; 12:402– 8 19. Dale JR: Global cross-ratio models for bivariate, discrete, ordered re-sponses. Biometrics 1986; 42:909 –17
20. Myles PS, Hunt JO, Moloney JT: Postoperative “minor” complications: Comparison between men and women. Anaesthesia 1997; 52:300 – 6
21. Chimbira W, Sweeney BP: The effect of smoking on postoperative nausea and vomiting. Anaesthesia 2000; 55:540 – 4
22. Junger A, Hartmann B, Benson M, Schindler E, Dietrich G, Jost A, Béye-Basse A, Hempelmann G: The use of an anesthesia information management system for prediction of antiemetic rescue treatment at the postanesthesia care unit. Anesth Analg 2001; 92:1203–9
23. Muir JJ, Warner MA, Offord KP, Buck CF, Harper JV, Kunkel SE: Role of nitrous oxide and other factors in postoperative nausea and vomiting: A random-ized and blinded prospective study. ANESTHESIOLOGY1987; 66:513– 8
24. Apfel CC, Läärä E, Koivuranta M, Greim C-A, Roewer N: A simplified risk score for predicting postoperative nausea and vomiting: Conclusions from cross-validations between two centers. ANESTHESIOLOGY1999; 91:693–700
25. Kranke P, Apfel CC, Papenfuss T, Rauch S, Lobmann U, Rubsam B, Greim CA, Roewer N: An increased body mass index is no risk factor for postoperative nausea and vomiting: A systematic review and results of original data. Acta Anaesthesiol Scand 2001; 45:160 – 6
26. Tramèr M, Moore A, McQuay H: Propofol anesthesia and post-operative nausea and vomiting: Quantitative systematic review of randomized controlled studies. Br J Anaesth 1997; 78 :247–55
27. Tramèr M, Moore A, McQuay H: Meta-analytic comparison of prophylactic antiemetic efficacy for postoperative nausea and vomiting: propofol anaesthesia
vs omitting nitrous oxide vs a total i.v. anaesthesia with propofol. Br J Anaesth 1997; 78:256 –9
28. Eriksson H, Kortilla K: Prevention of postoperative pain and emesis. Curr Opin Anaesthesiol 1997; 10:438 – 44
29. Sneyd JR, Carr A, Byrom WD, Bilski AJT: A meta-analysis of nausea and vomiting following maintenance of anaesthesia with propofol or inhalational agents. Eur J Anaesth 1998; 15 :433– 45
30. Apfel CC, Kranke P, Papenfufl T, Rauch S, Greim CA, Roewer N: Volatile anaesthetics may be the main cause for early but not delayed postoperative nausea and vomiting: a randomised control trial of factorial design. Br J Anaesth 2002; 88:659 – 68
31. Pierre S, Benais H, Pouymayou J: Apfel’s simplified score may favorably predict the risk of postoperative nausea and vomiting. Can J Anaesth 2002; 49:237– 42
32. Andrews PLR: Physiology of nausea and vomiting. Br J Anaesth 1992; 69(suppl 1):2S–19S
33. Camu F, Lauwers MH, Verbessem D: Incidence and aetiology of postop-erative nausea and vomiting. Eur J Anaesth 1992; 9(suppl 6):25–31
34. Andrews PLR: Towards an understanding of the mechanism of PONV, The Effective Management of Postoperative Nausea and Vomiting. Edited by Strunin L, Rowbotham D, Miles A. London, Aesculapius Medical Press, 1999, pp 13–30 35. Tramèr MR: A rational approach to the control of postoperative nausea and vomiting: Evidence from systematic reviews: Part I. Efficacy and harm of antiemetic interventions, and methodological issues. Acta Anaesthesiol Scand 2001; 45:4 –13
36. Kamath B, Curran J, Hawkey C, Beattie A, Gorbutt N, Guiblin H, Kong A: Anaesthesia, movement and emesis. Br J Anaesth 1990; 64:728 –30