HAL Id: hal-00665950
https://hal.archives-ouvertes.fr/hal-00665950
Submitted on 3 Feb 2012
HAL is a multi-disciplinary open access
archive for the deposit and dissemination of
sci-entific research documents, whether they are
pub-lished or not. The documents may come from
teaching and research institutions in France or
abroad, or from public or private research centers.
L’archive ouverte pluridisciplinaire HAL, est
destinée au dépôt et à la diffusion de documents
scientifiques de niveau recherche, publiés ou non,
émanant des établissements d’enseignement et de
recherche français ou étrangers, des laboratoires
publics ou privés.
TOWARDS A DESCRIPTIVE DEPTH INDEX FOR
3D CONTENT: MEASURING PERSPECTIVE
DEPTH CUES
Lutz Goldmann, Touraj Ebrahimi, Pierre Lebreton, Alexander Raake
To cite this version:
Lutz Goldmann, Touraj Ebrahimi, Pierre Lebreton, Alexander Raake. TOWARDS A DESCRIPTIVE
DEPTH INDEX FOR 3D CONTENT: MEASURING PERSPECTIVE DEPTH CUES. Sixth
Inter-national Workshop on Video Processing and Quality Metrics for Consumer Electronics - VPQM 2012,
Jan 2012, Scottsdale, Arizona, United States. pp.1-6. �hal-00665950�
TOWARDS A DESCRIPTIVE DEPTH INDEX FOR 3D CONTENT:
MEASURING PERSPECTIVE DEPTH CUES
Lutz Goldmann, Touradj Ebrahimi
Ecole Polyt. Federale de Lausanne
Multimedia Signal Processing Group
Lausanne, Switzerland
Pierre Lebreton, Alexander Raake
Telekom Innovation Labs & TU Berlin
Assessment of IP-Based Applications
Berlin, Germany
ABSTRACT
3D quality of experience (QoE) in nature is a mul-tidimensional problem and involves many factors that contribute to the global quality rating such as image quality, depth perception and visual discom-fort. One important aspect for the development and evaluation of 3D processing techniques is the selection of appropriate 3D content. To this aim it is necessary to develop computational methods that can automatically measure the 3D character-istics of a scene, similar to the spatial and tempo-ral information indices commonly used for assess-ing 2D content. The presented work is one step in the development of such a depth index (DI) which will target the evaluation of the depth-related char-acteristics of 3D video sequences. The paper fo-cuses on the linear perspective as one of the ma-jor monocular depth cues. It compares two distinct approaches for measuring the strength of perspec-tive depth cues and analyzes their limits on a 2D image dataset with associated subjective ratings.
1. INTRODUCTION
Recently, the interest in 3DTV, as one of the emerg-ing multimedia formats, has remarkably increased due to the rapid technological development.As a consequence efforts have been devoted to the cre-ation of suitable 3D content to feed this growing market. However, one of the most important fac-tors for a sustainable success of 3DTV is that it
pro-Pierre Lebreton is also affiliated with the University of Nantes. The authors thank Marcus Barkowsky and Patrick Le Callet from the University of Nantes for their comments and fruitful discussions. This work was partially supported by the COST IC1003 European Network on Quality of Ex-perience in Multimedia Systems and Services - QUALINET (http://www.qualinet.eu/).
vides an increased quality of experience (QoE) when compared to traditional 2D media formats. Achiev-ing this is not straightforward due to the various quality factors which are involved in a 3D expe-rience. Three dimensions are usually considered when studying 3D quality: image quality, depth perception and visual discomfort.
In this paper we focus on the depth perception since this directly reflects the added value of 3DTV. There are various factors which contribute to the human depth perception. These depth cues can be divided into monocular (pictorial) and binocular cues [1]. The monocular depth cues provide depth information available in single views and include shading, relative size, interposition, blur, texture gradients, linear perspective, motion parallax and dynamic occlusions. In addition to the monocu-lar cues, the binocumonocu-lar vision (stereopsis) provides binocular depth cues. Here, binocular disparity is considered as one of the most important binocular depth cues.
In this paper we focus on the contribution of monocular depth cues to the overall depth percep-tion. As one of the strongest monocular depth cues the linear perspective has been used for many years by artists to give a good understanding of the depth layout of a scene. Another aspect which makes lin-ear perspective particularly interesting is its abil-ity to give quantitative depth information: using linear perspective it is possible to estimate the dis-tance in depth between objects. This is not neces-sarily the case with other depth cues: if interposi-tion is considered without addiinterposi-tional informainterposi-tion, it is only possible to say that one object is in front of another, but not at which distance. The linear perspective has been studied in the past and typi-cally in two different granularities: firstly as a local depth measure [2, 3] where the linear perspective
is used to estimate a dense depth map of a scene, and secondly in a global way [4] where a single depth indicator is computed to provide informa-tion about the perceived depth. Both approaches are valuable but target different objectives. The first one could be used to understand more precisely the structure of the scene and could then be applied to improve the quality of depth maps or to evaluate distances to objects in the context of autonomous robots. The second approach directly targets the description of a scene, which can be particularly useful for the development of realiable 3D process-ing techniques, where it is crucial to select repre-sentative 3D content with different characteristics. While for 2D content, the spatial (SI) and temporal information (TI) indices are commonly used [5], an additional depth index (DI) is required, to capture the depth characteristics as well.
The general objective of our work is to develop a depth index which describes the depth character-istics of a scene by analyzing and fusing the most prominent depth cues. In the context of this paper, only the measurement of linear perspective is stud-ied since it is considered as one of the most promi-nent monocular depth cues.
The paper is structured as follows. Section 2 provides a concise review of depth perception in general, and the most important depth cues. Sec-tion 3 describes two approaches which have been developed to objectively measure the influence of the linear perspective on the perceived depth. In section 4 both approaches are evaluated on a pub-licly available 2D image dataset and their limita-tions are analyzed. Finally, section, 5 summarizes the work and discusses future research directions.
2. DEPTH PERCEPTION
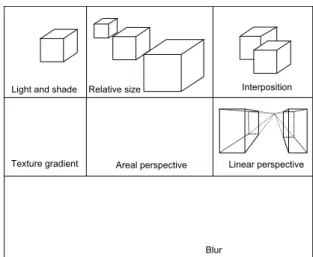
There are many factors which contribute to the gen-eral understanding of the organization in depth of the different objects composing a scene (the depth layout). These can be decomposed into two distinct classes: the monocular depth cues and the binocu-lar depth cues [1]. The monocubinocu-lar depth cues provide information on the depth using only a single view. They can be decomposed into two distinct classes: the static and motion-based cues. An illustration of different monocular depth cues is depicted in Fig-ure 1. In addition to the monocular depth cues, the binocular vision provides binocular depth cues. The pupils of the two human eyes are shifted by
Light and shade Relative size Interposition
Texture gradient Areal perspective Linear perspective
Blur
Fig. 1. Different types of monocular depth cues.
X Y Disparity = X-Y
Fix Target
Fig. 2. Binocular disparity used for stereopsis.
approximatively 6.5 cm, which causes each retinal image to provide a slightly different view of the same scene. This difference between the two views is called retinal disparity. The brain is able to com-bine these two views into a single 3D image in a process called stereopsis (see Figure 2). The gen-eral perception of the depth layout results from a combination of the different sources of depth in-formation.
The question of how all these depth cues con-tribute to the general depth perception has been studied by Cutting & Vishton [6]. Their analysis included 9 distinct depth cues including occlusion, relative size, relative density, height in the visual field, perspective, motion perspective, binocular dis-parities, convergence and accomodation. Based on a comparison of their ordinal depth-threshold
func-convergence & Accomodation Binocular Disparities Motion Perspective Height in visual field occlusion relative size relative density assumed utility threshold for infoormation 1 10 100 1000 10 000 aerial perspective 0.001 0.01 0.1 1.0
Depth (in meters)
De
pth con
tr
ast
Fig. 3. Depth contrast perception as a function of
the visualization distance [6].
tions they have shown that the influence of each depth cue on the overall depth perception depends largely on the distance (see figure 3). According to these variations they have partitioned the space around the observer into 3 concentric circles where specific depth cues are dominant. In the personal space (0–2 m) the most important depth cues are oc-clusions, retinal disparity, relative size, convergence and accommodation. In the action space (2-30 m) the depth cues can be ranked according to their im-portance in the following way: occlusion, height in the visual field, binocular disparity, motion per-spective, and relative size. In the vista space (be-yond 30 m) the only effective sources of informa-tion are the so-called pictorial cues including oc-clusion, height in the visual space, relative size and aerial perspective. While the derived rankings pro-vide a way to understand the importance of the in-dividial depth cues for certain depth ranges, a com-putational model for their integration is still miss-ing and requires further studies.
3. LINEAR PERSPECTIVE
Linear perspective refers to the expansion of a 3D space [4] as it is illustrated in figure 4. The con-vergence of parallel lines such as the borders of the street in a visible vanishing point provides a strong perspective depth cue. On the other hand, the lack of vanishing lines for example in a row of trees or a vanishing point perpendicular to the camera view such as in a frontal view of a house provide very weak perspective depth cues.
In order to automatically predict the strength of linear perspective for a given image, local and
Fig. 4. From strong to weak linear perspective.
global image properties can be analyzed. One way is to detect and group visible lines and analyze the corresponding vanishing points. Another way is to ignore these local properties and characterize the scene layout globally by analyzing the statistical regularities of features within the image. Both ap-proaches have been considered here, and the spe-cific methods are described below.
3.1. Global layout properties (GLP)
The global approach is based on the analysis of global texture features and adopts the method proposed by Ross & Oliva [4] for scene description. A 2D im-age is divided into a 2×2 grid of non-overlapping rectangular regions which are described through a set of GIST features [7]. These features are ob-tained by convolving each image region with a set of Gabor-like filters and averaging the complex mag-nitudes at 4 scales and 8 orientations as it is illus-trated for several examples in figure 5. Principal component analysis (PCA) is applied to reduce the dimensionality of the features from 128 to 24. Given a set of training images and the corresponding fea-tures a cluster weighted model (CVM) is trained to predict the strength of the perspective depth cues x within a test image. A CVM is essentially a gen-eralization of a Gaussian mixture model (GMM) to linear regression problems. It consists of several clusters and their associated linear regression func-tions, which are combined to derive the predicted perspective according to the mixture proportions for a given sample.
3.2. Vanishing point model (VPM)
The geometric approach is based on the analysis of vanishing lines and their corresponding vanishing points, and adopts the unified model for geomet-ric parsing by Barinova et al. [8]. It models the scene as a composition of geometric primitives at different levels (edges, lines, vanishing points) as
Fig. 5. Illustration of the global layout properties (GLP) with input image (left), global (middle) and local Gabor responses (right).
it is illustrated in figure 6. Line segments are de-tected by applying the line segment detector (LSD) by von Gioi et al. [9] on an image pyramid of 3 different scales and grouped into lines using the probabilistic Hough transform. The candidate van-ishing point are derived using the J-linkage algo-rithm. In order to compute the final set of vanish-ing points along with the horizon and the zenith, the relationships between the different levels are explicitly recovered through a joint optimization process that does not require the Manhattan world assumption with 3 orthogonal directions to be ful-filled. By analysing the position of the detected vanishing points for a set of images a heuristic rule has been derived to predict the strength of the per-spective cues. It is based on the observation that the perspective cues are strongest if one of the van-ishing points is close to the image center and de-creases if the vanishing points lie outside the im-age. Therefore, the strength of the perspective depth cues s is computed as x= d+11 given the distance d of the closest vanishing point to the image center.
4. EXPERIMENTAL RESULTS 4.1. Dataset
For the development and the evaluation of the two methods, the 2D image database created by Ross & Oliva [4] was used. It contains 7138 unique images from urban and natural outdoor environments. A few representative samples are shown in figure 7.
Fig. 6. Illustration of the vanishing point model
(VPM) with input image (left), line segments (mid-dle) and vanishing lines (right).
Fig. 7. Samples from the used 2D image dataset
with urban (left) and natural environments (right).
For each of the images, 1 out of 14 observer has been asked to rate the degree of perspective, open-ness and depth on a scale from 1 to 6. A small subset of 838 images has been rated by a second observer, which can be used to consistency of the ratings. For the experiments the subjective scores of the perspective rating have been rescaled to the interval[0, 1]. They serve as ground truth y for the evaluation of the two methods.
4.2. Performance
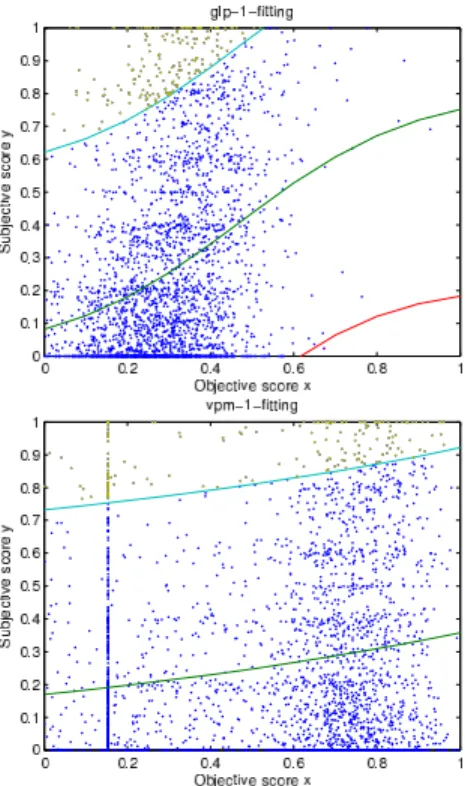
The performance of the developed methods was evaluated by comparing the predicted objective val-ues x to the ground truth valval-ues y obtained from the subjective test. Figures 8 and 9 provide scat-ter plots (subjective vs. objective scores) compar-ing the two methods for urban and natural envi-ronments, respectively. While the correlation be-tween subjective and objective scores seems to be
Fig. 8. Scatter plot (subjective vs. objective) of GLP (top) and VPM (bottom) for urban environments.
quite high for urban environments, it is very small for natural environments. This is confirmed by the computed Pearson correlation coeffcients after fitting a logistic function (green curve) [10]. For ur-ban scenes the results are quite promising with 0.64 for the global approach (GLP) and 0.59 for the geo-metric approach (VPM). For natural scenes the per-formance drops considerably with correlation coef-ficients of 0.33 and 0.17, respectively.
4.3. Analysis
To better understand the limits of both approaches, the upper (cyan curve) and lower (red curve) pre-diction bounds, with a confidence level of 0.95, have been computed for the logistic function. The cor-responding upper (yellow points) and lower (ma-genta points) outliers have been sorted according to their distance between the objective and subjec-tive scores and have been visually analyzed. The figures 10 and 11 show a selection of the upper (y > x) and lower (y < x) outliers, respectively. Analysing the upper outliers in figure 10 shows that the GLP method usually underestimates the strength of the linear perspective for scenes which
Fig. 9. Scatter plot (subjective vs. objective) of GLP (top) and VPM (bottom) for natural environments.
Fig. 10. Selected upper outliers of GLP (left) and
VPM (right) for the urban environment.
Fig. 11. Selected lower outliers of GLP (left) and
contain strong textures throughout the whole im-age. On the other hand, the VPM method typically underestimates the strength of the linear perspec-tive for scenes which contain only a few vanishing lines or which contain both parallel and perpendic-ular vanishing lines. For the lower outliers in fig-ure 11 the GLP method seems to overestimate the strength of the linear perspective for scenes which contain both textured and homogeneous areas. The majority of the overestimates by the VPM method are caused by the non-parallel lines which are acci-dently considered as vanishing lines. Furthermore, both figures reveal an issue of the used dataset. Some large differences between the subjective and objective scores are actually caused by question-able subjective scores. An analysis of the images which have been rated twice shows that for 12% of the images the subjective ratings are inconsistent with a difference of 2 on a scale from 1 to 6. The performance can be expected to be higher if these ambiguous scores are excluded from the evalua-tion.
5. CONCLUSION
After providing a concise review of the most im-portant aspects of depth perception, this paper ex-plores global and geometric approaches for mea-suring linear perspective as one of the most impor-tant monocular depth cues. The global approach (GLP) uses texture features and a trained regres-sion model to predict the strength of the perspec-tive depth cues. The geometric approach (VPM) relies on the detection of vanishing lines and their corresponding vanishing points and uses a heuris-tic rule to relate their position to the linear perspec-tive. While both approaches perform comparably well for urban environments, the performance drops considerably for natural environments. Especially, the geometric approach suffers from the lack of par-allel lines in natural scenes. A detailed analysis of the outliers has revealed the complementary weak-nesses of both approaches and motivates their in-tegration as one future research direction. Another direction is the integration of additional monocular depth cues, which are assumed to be especially im-portant when it comes to natural scenes. During the analysis questionable subjective scores in the used database have been observed which affect the measured performance. The lack of an alternative dataset shows that more comprehensive datasets
with a large variety of monocular and binocular depth cues and reliable subjective ratings are needed.
References
[1] S. Reichelt, R. H¨aussler, G. F ¨utterer, and N. Leister, “Depth cues in human visual per-ception and their realization in 3D displays,” in Three-Dimensional Imaging, Visualization, and Display, 2010.
[2] E Delage, H Lee, and A. Y Ng, “Auto-matic single-image 3d reconstructions of in-door manhattan world scenes,” in Interna-tional Symposium of Robotics Research, 2005. [3] A Criminisi, I Reid, and A Zisserman, “Single
view metrology,” International Journal of Com-puter Vision, vol. 40, pp. 123–148, 2000. [4] M.G. Ross and A. Oliva, “Estimating
percep-tion of scene layout properties from global im-age features,” Journal of Vision, vol. 10, no. 1, 2010.
[5] ITU-T, “Audiovisual quality in multimedia services: Subjective video quality assessment methods for multimedia applications,” Tech. Rep. P.910, 1999.
[6] J.E. Cutting and P.M. Vishton, “Perceiving lay-out and knowing distances: The integration, relative potency, and contextual use of differ-ent information about depth,” Perception of space and motion, vol. 5, pp. 69–117, 1995. [7] A. Oliva and A. Torralba, “Modeling the
shape of the scene: a holistic representation of the spatial envelope,” International Journal of Computer Vision, vol. 42, no. 3, 2001.
[8] O Barinova, V. Lempitsky, E. Tretyak, and P. Kohli, “Geometric image parsing in man-made environments,” in ECCV, 2010.
[9] R.G. von Gioi, J. Jakubowicz, J.-M. Morel, and G. Randall, “Lsd: A fast line segment detector with a false detection control,” Pattern Anal-ysis and Machine Intelligence, IEEE Transactions on, vol. 32, no. 4, pp. 722 –732, april 2010. [10] ITU-R, “Methodology for the subjective
as-sessment of the quality of television pictures,” Tech. Rep. BT.500-11, ITU-R, 2002.
![Fig. 3. Depth contrast perception as a function of the visualization distance [6].](https://thumb-eu.123doks.com/thumbv2/123doknet/8227868.276658/4.918.483.801.106.214/fig-depth-contrast-perception-function-visualization-distance.webp)