HAL Id: hal-01006841
https://hal.archives-ouvertes.fr/hal-01006841
Submitted on 30 May 2017
HAL is a multi-disciplinary open access
archive for the deposit and dissemination of sci-entific research documents, whether they are pub-lished or not. The documents may come from teaching and research institutions in France or abroad, or from public or private research centers.
L’archive ouverte pluridisciplinaire HAL, est destinée au dépôt et à la diffusion de documents scientifiques de niveau recherche, publiés ou non, émanant des établissements d’enseignement et de recherche français ou étrangers, des laboratoires publics ou privés.
Experimental data highlighting the role of surface
fracture energy in quasi-static confined comminution
Carlos Ovalle, Christophe Dano, Pierre-Yves Hicher
To cite this version:
Carlos Ovalle, Christophe Dano, Pierre-Yves Hicher. Experimental data highlighting the role of surface fracture energy in quasi-static confined comminution. International Journal of Fracture Mechanics, Springer-Verlag, 2013, 182 (1), pp.123-130. �10.1007/s10704-013-9833-4�. �hal-01006841�
EXPERIMENTAL DATA HIGHLIGHTING THE ROLE OF SURFACE FRACTURE
ENERGY IN QUASI-STATIC CONFINED COMMINUTION
Carlos Ovalle
1-2, Christophe Dano
1, Pierre-Yves Hicher
11 LUNAM University, Ecole Centrale Nantes, CNRS UM 6183,1 rue de la Noë BP 92101 44321
Nantes Cedex 3, France.
2 Dept. of Struct. and Geotech. Eng., Pontificia Universidad Católica de Chile
e-mail: carlos.ovalle@ec-nantes.fr ; christophe.dano@ec-nantes.fr
Abstract. Since the pioneering work of Griffith, Linear Elastic Fracture Mechanics has been widely
experimentally validated and successfully developed in solid mechanics modeling. However, recent theoretical models applying the energy balance found in Griffith theory specifically for quasi-static confined comminution have until now not been systematically confronted to experiments. In this study, we analyze data of compression tests on crushable sand, where grain breakage has been triggered by flooding the initially dry material at constant stresses. We consider a partition of the dissipation between surface fracture energy and the rearrangement of fragments and grains surrounding crushed particles. Our results show that the role of the surface fracture energy is stress-dependent and that its influence becomes less significant at high stresses.
Keywords: quasi-static comminution, surface fracture energy.
1. Introduction. Quasi-static confined comminution is a major topic in several research disciplines
such as geomechanics and powder technology. It is well known that, when crushing occurs, the evolution of the grain size distribution (GSD) causes an increase of the compressibility because of the rearrangement of the polydisperse packing (Biarez and Hicher, 1997). In the field of soil mechanics, this phenomenon has been modeled mostly by phenomenological approaches based on the Critical State Theory (Roscoe et al. 1963), which considers that plastic work depends only on internal frictional dissipation (Daouadji et al., 2001; Russell and Khalili, 2004; Muir Wood et al., 2009; Daouadji and Hicher, 2010; Hu et al., 2011). On the other hand, other approaches consider that the increment of plastic work (δWp) is due, not only to friction (δΦ
friction), but also to dissipation
by breakage (δΦB) (McDowell et al., 1996; Einav, 2007): δWp=δΦfriction+δΦB.
Miura and O-Hara (1979) have shown experimentally that plastic work in quasi-static confined comminution is related to the increase of surface area of grains (S). This finding has motivated some recent works based on the concept of fracture surface energy in Linear Elastic Fracture Mechanics (LEFM). For instance, McDowell et al. (1996) suggested that δΦB can be written as the energy
needed to create an increment δS in a given volume: δΦB=δΦS=ΓδS/[Vs(1+e)] ; where Γ is the
specific surface energy from the theory of Griffith (1921), Vs is the volume of solids and e is the
void ratio (volume of voids / volume of solids). This equation neglects the energy lost by heat production, as well as the plastic dissipation due to inelastic deformations around the crack, i.e., it assumes an assembly of perfectly brittle grains. However, McDowell et al. (1996) did not give any experimental validation for their equation.
Pugno and Carpinteri (2008) also applied the Griffith energy balance to predict the isotropic pressure needed to obtain a given δS, towards a first step to what they called Linear Elastic
mechanisms affect also the term δΦB. Let us consider a confined granular packing of elastic
particles. Before crushing, the macro-mechanical stresses are transmitted through inter-particle contact forces, which leads to a stored elastic energy in grains. Any stress increment will increase the elastic energy and will be accompanied by frictional dissipation at contacts. Once the grain internal stress reaches the strength limit, breakage occurs and the elastic energy is converted in fracture surface energy in crushed grains and in kinetic energy in fragments and also in surrounding grains. Finally, the system will reach a new static equilibrium state, where the kinetic energy will be divided into some recovered elastic energy and dissipation by friction at newly formed contacts. To take into account these micro-mechanical mechanisms in continuum modeling, some authors proposed that δΦB should be written as the sum of δΦS and a second term of redistribution (δΦredist),
capturing the dissipation of the kinetic energy triggered by crushing (Nguyen and Einav, 2009; Nieto-Gamboa, 2011; Russell; 2011). Russell (2011) defined R=δΦs/δΦredist, which gives the
following equation for the plastic work:
(
R
)
W
friction S redist friction S p+
Φ
+
Φ
=
Φ
+
Φ
+
Φ
=
δ
δ
δ
δ
δ
1
δ
(1)Using test results on two silica sands, Russell (2011) showed that the uniaxial compression line can be predicted by using an R value around 13 to 15 when significant amount of particle breakage occurs and when the GSD can be assumed to tend to a fractal. In these cases, δΦS represents less
than 10% of the total plastic work.
Consequently, although LEFM has been widely applied and substantial experimental validations have been reported in solid mechanics, including interesting developments in dynamic fragmentation (Grady, 1982; Pugno, 2006; Jandacka et al., 2009), only few works have been developed in quasi-static confined comminution. As discussed before, in this case a suitable definition of the specific surface energy should include not only the fracture surface, but also micro-mechanical effects. Nevertheless, as far as we know, experimental results are still insufficient to decide whether this material parameter depends on stress conditions or if it has an intrinsic value. For this reason, based on experimental data, the aim of this letter is to discuss the partition of the plastic work in granular assemblies made of crushable brittle grains and particularly the role of the specific fracture energy.
2. Experimental method. We propose an experimental method in order to estimate the role of the
breakage energy on the total plastic work of a crushable granular material. Several authors have shown that the amount of crushing increases with the water content (Lee et Coop, 1995; Oldecop and Alonso, 2001). Based on the subcritical crack propagation theory in brittle rock samples (Atkinson, 1982), Oldecop and Alonso (2007) have suggested that when the relative humidity increases, suction decreases at the micro-crack tips in grains. As a consequence, the mechanism of crack opening is affected, increasing the crack propagation velocity and reducing the particle strength. Therefore, if the effect of suction and lubrication of grain contacts is neglected, when a dry compressed material is flooded at constant stresses, crushing is triggered and it can be reasonably assumed that dissipation during collapse and creep after flooding is only due to grain breakage. In this study, this hypothesis has been validated by experimental data.
We performed several uniaxial compression tests on cylindrical samples (19mm high and 70mm in diameter) of sand with initial uniform GSD made of angular grains sieved between 2 to 2.5 mm. The material was obtained from the grinding of a quartzite shale rock from the Trois Vallées quarry in the north of France and it has a unit mass of solids ρ=2.75 gr/cm3. To avoid crushing during
preparation, loose samples of dry material were prepared in a cylindrical mould at an initial void ratio eo=1.019 +/- 0.046 (see Table 1). Then, 23 stress controlled compression tests were carried out
at the following effective vertical stress levels: σv’= 0.15, 0.4, 0.8, 1.3 and 2.1 MPa. 24 hours of
creep at each mentioned stress level were then imposed. As shown in Table 1, three test conditions were used: (1) dry, (2) saturated and (3) initially dry flooded material. A saturated test accounts for a dry sample which was simply filled with water before loading (without measuring the degree of saturation). The third case refers to a dry material which was flooded at the selected stress level. For flooding, we slowly added demineralized water into the sample through a pipe connected to its base, at a constant water level equal to the upper level of the sand sample. This process took approximately 1 minute and we did not observe any chemical reaction or mineral dilution of sand grains after wetting. After each test, samples were slowly dried and accurately sieved between 2.5mm and 0.08mm. Fig. 1 shows microscopic observations of crushed grain fragments sieved between 0.08 and 0.1 mm after a test. It appears that the shale rock is composed of thin sheets. Once crushing occurs, significant amount of fines is produced essentially by small pieces of detached sheets.
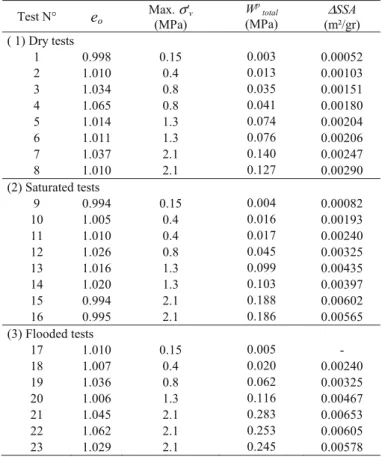
Table 1. Uniaxial compression tests on shale sand
Test N° eo Max. (MPa) σ'v W
p total (MPa) Δ SSA (m²/gr) ( 1) Dry tests 1 0.998 0.15 0.003 0.00052 2 1.010 0.4 0.013 0.00103 3 1.034 0.8 0.035 0.00151 4 1.065 0.8 0.041 0.00180 5 1.014 1.3 0.074 0.00204 6 1.011 1.3 0.076 0.00206 7 1.037 2.1 0.140 0.00247 8 1.010 2.1 0.127 0.00290 (2) Saturated tests 9 0.994 0.15 0.004 0.00082 10 1.005 0.4 0.016 0.00193 11 1.010 0.4 0.017 0.00240 12 1.026 0.8 0.045 0.00325 13 1.016 1.3 0.099 0.00435 14 1.020 1.3 0.103 0.00397 15 0.994 2.1 0.188 0.00602 16 0.995 2.1 0.186 0.00565 (3) Flooded tests 17 1.010 0.15 0.005 - 18 1.007 0.4 0.020 0.00240 19 1.036 0.8 0.062 0.00325 20 1.006 1.3 0.116 0.00467 21 1.045 2.1 0.283 0.00653 22 1.062 2.1 0.253 0.00605 23 1.029 2.1 0.245 0.00578
Figure 1. Crushed grains of quartzite shale sand after uniaxial compression test
sieved between 80 and 100 μm.
3. Surface area estimation. Let us consider that the volume v of each grain is a function of its
surface area of a grain is given by δv(d)/δd=s(d)=3βvd2. For the ith size fraction of characteristic
diameter di, the surface area is given by Si=Nisi=3Niβ
vdi2 (where Ni is the number of particles in the
size fraction). One can also write the mass of the size fraction as mi=Niρv=Niρβ
vdi3. Thus, the GSD
expressed by the retained mass on the ith size fraction is given by f i=mi/M
t (where Mt is the total
mass of the sample). Assuming that βv is constant along sizes and combining Si and f i, we obtain the
increment of surface area of the ith size fraction after crushing, by considering the change on the retained mass Δf i : i i t i
d
f
M
S
ρ
Δ
=
Δ
3
(2)However, the aforementioned analysis based on a constant shape factor might be unrealistic for fine grains composed of thin sheets. This is particularly important because the finer fraction stands for the main part of the surface area in a granular material. Therefore, following Miura and O’Hara (1979), for grains of characteristic size under 0.125 mm, we estimated the surface area by the Blaine test (air permeability), typically used for cements according to the standard ASTM C204-11. We separated the finer material in three fractions: 0.125-0.1 mm, 0.1-0.08 mm and <0.08 mm and we carried out 9 tests on each size fraction for samples prepared at a constant void ratio e=0.500 +/- 0.004. Table 2 shows the average values for the void ratio and the corresponding specific surface area (SSA). Using the aforementioned approach, the increment of the SSA was computed for all tests, as shown in Table 1.
Table 2. Blaine tests on fine size fractions Size fraction
(mm) Avg. e (*)
Min. SSA
(m2/gr) Max. SSA (m2/gr) Avg. SSA (*) (m2/gr)
<0.08 0.502 0.380 0.407 0.394
0.1-0.08 0.499 0.148 0.156 0.152
0.125-0.1 0.500 0.116 0.133 0.125
(*) each average value corresponds to 9 tests on 3 samples, i.e., 3 tests per sample
0.6 0.7 0.8 0.9 1.0 1.1 0.0 0.5 1.0 1.5 2.0 2.5 σv' (MPa) Void ratio
Test 1 Test 2 Test 3 Test 4 Test 5 Test 6 Test 7 Test 8 Test 9 Test 10 Test 11 Test 12 Test 13 Test 14 Test 15 Test 16 Test 18 Test 19 Test 20 Test 21 Test 22 Test 23
Figure 2. Uniaxial compression (load-unload) tests.
4. Experimental results. Finally, we have a complete determination of the void ratio and the GSD,
test condition. Fig. 2 shows the compression curves (loading-unloading) and Fig. 3 presents the GSD before and after crushing for all tests. The increment of plastic work for a given stress increment was obtained by subtracting the elastic strain (εe) recovered after unloading: ΔWp=Δσv’(ε-εe). Then,
the total plastic work in Table 1 (Wp
total) is the sum of all increments during a test. We observed that
saturated and flooded materials are more compressible and they present more crushing in comparison to the dry material. Moreover, regardless of the point of flooding, a collapse is triggered from the dry compression curve to the saturated one, which is in agreement with other results from the literature (Lee et Coop, 1995; Oldecop and Alonso, 2001).
0.1 1 10 100 0.01 0.1 1 10 Particle size (mm) % finer by mass Initial GSD Test 1 Test 2 Test 3 Test 4 Test 5 Test 6 Test 7 Test 8
(a) dry tests
0.1 1 10 100 0.01 0.1 1 10 Particle size (mm) % finer by mass Initial GSD Test 9 Test 10 Test 11 Test 12 Test 13 Test 14 Test 15 Test 16 (b) saturated tests 0.1 1 10 100 0.01 0.1 1 10 Particle size (mm) % finer by mass Initial GSD Test 18 Test 19 Test 20 Test 21 Test 22 Test 23 (c) flooded tests
Figure 3. Grain size distributions after uniaxial compression tests of (a) dry, (b) saturated and (c) flooded samples.
0.6 0.7 0.8 0.9 1.0 0.0 0.5 1.0 1.5 2.0 2.5 σv' (MPa) Void ratio Test 8 Test 15
flooding tests Glass beads 2mm
point of flooding te st N°2 1 te st N°2 0 te st N°1 9 te st N°1 8 te st N°1 7 0 20 40 60 80 0.001 0.01 0.1 1 Wptotal (MPa) Δ SSA (m²/gr) 10
4 saturated (initially flooded) flooded
dry
Figure 4. Uniaxial compression tests on quartzite shale crushable sand and glass beads.
Figure 5. Increment of specific surface area on samples after uniaxial compression tests
We have also performed a uniaxial compression test on a stronger material, where no crushing is expected at σv’=2.1 MPa. We compressed a dry sample (19mm high and 70mm in diameter) of
uniformly sized glass beads of 2 mm in diameter. No grain breakage was obtained and after flooding the additional measured plastic strain was negligible. This shows that it can be reasonably assumed that the collapse after flooding is triggered only by grain crushing. Fig. 4 presents the compression curve of the glass beads, as well as the most representative tests on crushable sand, where the arrow stands for the point of flooding. For all tests, Fig. 5 presents the increment of specific fracture surface area in specimens as a function of Wp
total. It can be seen that saturated and flooded samples
follow a unique curve, separately from dry samples which have experienced less crushing. Consequently, the fact that saturated and flooded samples present a unique compression curve can be explained by the fact that they have the same final GSD, i.e., the same amount of particle crushing.
5. Partition of the plastic work. Let us assume that the collapse of flooded samples is triggered
only by grain crushing. Thus, at constant effective vertical stress, the plastic work done after flooding of a dry sample is partitioned only between ΔΦS and ΔΦredist: ΔΦB=ΔΦS+ΔΦredist. Then, by
measuring the difference between the GSD after a dry test and after a flooded one at the same maximal σv’, we can compute the surface area increment due to the collapse (ΔScollapse). Then,
following McDowell et al. (1996) and using Eq. 1, we obtain an expression for the measured incremental plastic work during collapse (ΔWp
collapse):
(
e
) (
R
)
V
S
W
c s Collapse p collapse⋅
Γ
+
+
Δ
=
Δ
1
1
Δ
=
∑
∀iΔ
i CollapseS
CollapseS
where
;
(3)where we use Γc, for comminution. Fig. 6 shows the fitting of Γc(1+R) for flooded samples during
collapse according to Eq. 3, where it can be seen that it tends to a positive value of around 2.5 N/m when ΔWp
collapse tends to zero (i.e. at very low stresses). This value is in the same order of magnitude
of some reported parameters of surface fracture energy in shale rock samples, around Γ=5 N/m for fracture in mode I (Ashby and Jones, 2006).
Let us assume that the minimal breakage dissipation that can be obtained corresponds only to the creation of fracture surface (i.e., with none or negligible triggered kinetic energy). Therefore, if we take Γc=2.5 N/m, the amount of plastic work due to redistribution depends on the stress
magnitude and it tends to zero at low stresses. This occurs presumably because at low macro-mechanical stresses, inter-particle contact forces on a crushed grain can be transferred to nearby grains with small amount of redistribution (see case (a) on Fig. 7). On the other hand, at relatively high stresses, surrounding grains are not able to sustain the redistributed forces and an overall rearrangement of the material skeleton should take place with significant collapse, i.e., a high R value illustrated by the schematic drawing in Fig. 7(b).
6. Discussion. Considering the non negligible data scatter that appears on crushing strength of rock
aggregates and sand grains at a given water content (see for instance McDowell and Amon (2000) and Ovalle et al. (2013)), we can expect that Γc values present also an important dispersion. This is
not only due to the heterogeneity of the natural material, but also because of the physics of the crack propagation in stressed grains which could be affected by the corrosive environment. Therefore, Γc
is not strictly a constant. Then, weaker grains (higher corrosive potential and lower particle strength) should break at relatively low macro-mechanical stresses and stronger ones at high stresses. If this is the case, the energy needed for a given δS could be a function of the stress magnitude. Then, starting
with a Γc of around 2.5 N/m for early crushing of saturated grains in our tests, this value could be
higher when comminution develops and become significant at higher stresses.
0 5 10 15 20 25 0.001 0.01 0.1 1 ΔWp collapse (MPa) Γc (1+R) (N/m) constant δS increasing R=ΔΦredistr/ΔΦs (δεp) a (δεp)b (a) (b) (δεp) a< (δεp)b
Figure 6. Values of Γc(1+R) after collapse by flooding at different effective vertical stresses.
Figure 7. Schematic redistribution triggered by crushing.
The fragmentation of a grain during comminution depends also on the morphology and the magnitude of the forces transmitted by inter-granular contacts. Numerical analyses by the Discrete Element Method (DEM) have shown that the stresses applied on an assembly of grains are divided into a limited number of strong force chains in the same principal direction as the macro-mechanical stresses, as well as several weak force chains which stabilize the system (Cundall and Strack, 1979). As for the phenomenon of confined comminution, when the coordination number is low, it is reasonable to consider that a particle belonging to a strong chain is likely to be crushed in mode I. This is mostly the case for materials with an initial uniform GSD. However, the evolution of the grading will lead to a change in the contact force network and also to an increase of the coordination number, which could affect the grain crushing probability (Åström and Herrmann, 1998; Tsoungui et al., 1999). For instance, a high coordination number could induce a fracture by shear stresses (i.e. mode II). Likewise, fines production due to friction at grain contacts should be associated to shear induced stresses. In these cases, the specific surface energy will be much higher than the one from fracture in mode I. Thus, a physical based parameter Γc in continuum modeling should cover all
these aspects and should not be constant all over the comminution process. This complex issue could be better examined from a micromechanical point of view by way of DEM simulations.
7. Conclusions. A definition of the specific fracture energy in quasi-static confined comminution is
highly welcome for the prediction of the energy balance. However, this is a complex problem since micro-mechanical dissipative mechanisms cannot be accurately captured by continuous models. Our experimental results show that pure fracture energy is predominant at low stresses and becomes less prominent at high stresses, when the redistribution of the packing after crushing produces significant plastic work. This is true if one considers that the material specific fracture energy is constant throughout the comminution process. Nevertheless, the influence of data scatter on the material parameters and the effect of grading evolving during comminution are still not well understood. Further work needs to be done to understand how this phenomenon could be affected by the stress path and the initial conditions of the material (e.g. grain size distribution, density, grain shape).
Acknowledgements. Carlos Ovalle gratefully acknowledges the financial support of CONICYT
References
ASTM C204-11 (2011). Standard Test Methods for Fineness of Hydraulic Cement by Air-Permeability Apparatus, Annual Book of Standards Vol. 04.01
Ashby, M., Jones, D. (2006). Engineering Materials 1. 3rd edition, Elsevier. Oxford. 424 p.
Åström, J.A., Herrmann, H.J. (1998). Fragmentation of grains in a two dimensional packing, Eur. Phys. J. B 5, 551-554. Atkinson, B. K. (1982). Subcritical crack growth in geological materials, J. Geophys. Res. 89(B6), 4077–4114
Biarez, J., Hicher, P.Y. (1997). Influence de la granulométrie et de son évolution par ruptures de grains sur le comportement mécanique de matériaux granulaires, Revue Française de Génie Civil 1(4), 607-631
Cundall P., Strack, O. (1979). A discrete numerical model for granular assemblies, Géotechnique 29(1), 47-65
Daouadji, A., Hicher, P-Y. (2010). An enhanced constitutive model for crushable granular materials, Int. J. Numer. Anal. Meth. Geomech. 34(6), 555–580
Daouadji, A., Hicher, P-Y., Rahma, A. (2001). An elastoplastic model for granular materials taking into account grain breakage, Eur. J. Mech. A-Solid. 20, 113-137
Einav, I. (2007). Breakage mechanics- Part I: Theory, J. Mech. Phys. Solids 55(6), 1274-1297
Grady, D. E. (1982). Local Inertial Effects in Dynamic Fragmentation”, Journal of Applied Physics 53, 322-325. Griffith, A.A. (1921). The phenomena of rupture and flow in solids, Phil. Trans. R. Soc. Lond. A 221, 163-198.
Hu W., Yin Z., Dano C., Hicher P.-Y. (2011). A constitutive model for granular materials considering grain breakage, Sci. China Tech. Sci. 54, 1-9
Jandacka, P., Hlavac, L., Madr, V., Sancer, J., Stanek, F. (2009). Measurement of specific fracture energy and surface tension of brittle materials in powder form, Int. J. Fract. 159, 103-110
Lee, I., Coop, M. (1995). The intrinsic behaviour of a decomposed granite soil, Géotechnique 45(1), 117-130
McDowell, G. R., Amon, A. (2000). The application of Weibull statistics to the fracture of soil particles, Soils Found.
40(5), 133–141
McDowell, G. R., Bolton M. D., Roberston D. (1996). The fractal crushing of granular materials, J. Mech. Phys. Solids
44(12), 2079-2102
Muir Wood, D., Kikumoto, M., Russell, A.R. (2009). Particle crushing and deformation behaviour. Prediction and simulation methods for geohazard mitigation (eds F. Oka, A. Murakami, S. Kimoto), CRC Press, London.
Miura, N., O-Hara, S. (1979). Particle-crushing of a decomposed granite soil under shear stresses, Soils Found. 19(3), l-14 Nguyen. G., Einav, I. (2009). The energetics of cataclasis based on breakage mechanics, Pure Appl. Geophys. 166,
1693-1724
Nieto-Gamboa, C. (2011). Mechanical behavior of rockfill materials application to concrete face rockfill dams. Doctoral Thesis, Ecole Centrale Paris, France
Oldecop, L., Alonso, E. (2001). A model for rockfill compressibility, Geotechnique 51(2), 127–139
Oldecop L., Alonso, E. (2007). Theoretical investigation of the time dependent behavior of rockfill, Géotechnique 57(3), 289-301
Ovalle, C., Frossard, E., Dano, C., Hu, W., Maiolino. S., Hicher, P-.Y (2013). The effect of size on the strength of coarse rock aggregates and large rockfill samples through experimental data, submitted to Acta Mechanica
Pugno, N. (2006). Dynamic Quantized Fracture Mechanics, Int. J. of Fracture 140, 159-168.
Pugno, N., Carpinteri, A. (2008). On linear elastic fragmentation mechanics under hydrostatic compression, Int. J. Fract.
149, 113-117
Roscoe, K., Schofield, A., Thurairajah, A. (1963). Yield of clays in states wetter than critical, Géotechnique 13(3), 211-240 Russell, A. (2011). A compression line for soils with evolving particle and pore size distributions due to particle crushing,
Géotechnique Letters 1, 5-9
Russell A., Khalili N. (2004). A bounding surface plasticity model for sands exhibiting particle crushing, Can. Geotech. J.
41(6), 1179-1192
Tsoungui, O., Vallet, D., Charmet, J.C. (1999). Numerical model of crushing of grains inside two-dimensional granular materials, Powder Technol. 105, 190-198